UNIVERSITY OF ALGARVE
Screening of process conditions for the
production of biogas from diluted organic
waste streams using microreactors
Leonardo Silva
Report
Master in Biological Engineering
Advisors:
Prof. Dr. Guilherme Ferreira
Prof. Dr. Gert-Jan Euverink
Screening of process conditions for the
production of biogas from diluted organic
waste streams using microreactors
Leonardo Silva
Nº39296
Report
Master in Biological Engineering
Advisors:
Internal Advisor: Prof. Dr. Guilherme Ferreira
External Advisor from University of Groningen: Prof. Dr. Gert-Jan
Euverink
Screening of process conditions for the
production of biogas from diluted organic
waste streams using microreactors
Declaração de autoria do trabalho:
Declaro ser o autor deste trabalho, que é original e inédito. Autores e trabalhos consultados estão devidamente citados no texto e constam da listagem de referências incluída.
_______________________________
A Universidade do Algarve tem o direito, perpétuo e sem limites geográficos, de arquivar e publicitar este trabalho através de exemplares impressos reproduzidos em papel ou de forma digital, ou por qualquer outro meio conhecido ou que venha a ser inventado, de o divulgar através de repositórios científicos e de admitir a sua cópia e distribuição com objetivos educacionais ou de investigação, não comerciais, desde que seja dado crédito ao autor e editor.
Screening of process conditions for the
production of biogas from diluted organic
waste streams using microreactors
Statement of authorship of work:
I declare to be the author of this work, which is unique and unprecedented. Authors and works consulted are properly cited in the text and are included in the listing of references included.
_______________________________
The University of the Algarve has the right, perpetual and without geographical limits, to file and publish this work through printed copies reproduced in paper or digital form, or by any other means known or to be invented, to disclose through scientific repositories and to admit its copying and distribution with educational or research objectives, non-commercial purposes, provided that credit is given to the author and publisher.
R E S U M O
A utilização das energias renováveis tem vindo a aumentar nos últimos anos devido à diminuição do crude e dos seus efeitos negativos para o planeta (efeito estufa). Alternativas a esta fonte de energia são necessárias.
Existem várias alternativas designadas verdes aos combustíveis fósseis, nomeadamente, energia do vento, energia solar e energia proveniente de biomassa. O biogás (maioritariamente composto por metano e dióxido de carbono) apresenta ser uma alternativa viável por dois motivos: a sua combustão não contribui para o aumento do efeito estufa (ciclo de carbono é completo) e os resíduos sólidos da biomassa digerida durante a digestão anaeróbia podem ser utilizados como fertilizantes para agricultura.
Apesar da produção de biogás em digestores anaeróbios ser um processo bastante conhecido, existe espaço para novos avanços pois embora os reatores estejam bem descritos em termos de população microbiana o estabelecimento dessa população permanece pouco conhecido.
Neste sentido interessa compreender a complexidade do sistema anaeróbio de forma a obter um maior rendimento de biogás. Isto passará por determinar quais as populações microbianas envolvidas em diferentes condições de digestão. Prevendo-se que principalmente a temperatura, o substrato e o inóculo terão maior influência nas espécies e o número de indivíduos presentes no digestor. Neste estudo tentou-se cultivar microrganismos responsáveis pela digestão anaeróbia em culturas puras e desconhecidas para a produção de biogás. Os Archaea que foram utilizados nas culturas puras foram Methanosarcina
mazei, Methanococcus maripaludis and Methanospirillum hunatei. As culturas
com microrganismos não conhecidos partiram duas lamas de estações de tratamento de águas residuais em regime mesófilico Garmerwolde e Lelystad, ambas no norte da Holanda. Os meios de cultura e as culturas puras utilizadas foram da Deutsche Sammlung von mikroorganismen und Zelkulturen (DSMZ).
O crescimento das culturas metanogénicas foi monitorizado através da turbidez medindo a absorvância da amostra ao comprimento de onda de 600nm no espectrofotómetro. Para a determinação do consumo de substrato e produção do produto foram analisadas amostras usando cromatografia líquida de alta pressão (HPLC) e cromatografia gasosa (GC), respetivamente. A verificação da presença de organismos produtores de metano foi feita recorrendo à microscopia de fluorescência com excitação a 350 nm e filtro de emissão a 460 nm.
Os resultados obtidos mostraram que não foi possível crescer os microrganismos em culturas puras com os equipamentos usados, contudo o crescimento em câmara anaeróbia e mistura de gases apropriada poderá solucionar o problema. Por outro lado, o cultivo de uma população desconhecida foi possível e produziu-se metano. O fato de existirem microrganismos na população desconhecida que sejam anaeróbios facultativos permite a eliminação do oxigénio na cultura, permitindo, em condições menos favoráveis o crescimento de microrganismos anaeróbios. A presença de microrganismos anaeróbios responsáveis pela produção de metano foi confirmada pelas observações ao microscópio de fluorescência- fluorescência azul.
A deteção de metano foi possível através de cromatografia gasosa, contudo a correta e replicável quantificação de metano não foi possível por motivos técnicos. A resolução destes problemas técnicos vai para além do objetivo deste trabalho.
Para solucionar os problemas encontrados para a produção de biogás nas condições laboratoriais existentes sugere-se um sistema contínuo ao invés de um sistema descontínuo.
A B S T R A C T
In this work, attempts to produce biogas with unknown and known consortia were performed in small bioreactors with working volume of 50 and 5 mL using different media. The unknown consortium of microorganisms originated from two different mesophilic digesters in The Netherlands. The known consortium consists of pure strains of methanogens Methanosarcina mazei, Methanococcus maripaludis and
Methanospirillum hungatei from DSMZ. The cultures were monitored by
measuring pH, optical density, substrate consumption with High-pressure liquid chromatography and biogas production by measuring head-space pressure. The presence of methanogens in the unknown consortia was performed by detecting blue fluorescence from co-factor F420 unique to methanogens. The known consortium did not grow with the experimental setup used. Methane was produced, but its quantification was not possible.
T A B L E O F C O N T E N T S
1 Scope ... 1
2 Introduction ... 2
2.1 Anaerobic digestion ... 3
2.2 Biochemistry and thermodynamics of methanogenesis ... 5
2.3 Methanogens ... 7
2.4 Reactors in small scale ... 10
3 Materials and methods ... 11
3.1 Methanogenic bacteria ... 11
3.2 Media preparation ... 11
3.3. Culturing methanogens ... 12
3.3.1. Cultures in serum bottles (50 mL) ... 12
3.3.2. Cultures in Hungate-type tubes (5 mL) ... 12
3.4. Growth monitoring and product quantification ... 13
3.4.1. Optical density and pH ... 13
3.4.2. Dry weight ... 13
3.4.3. High-Pressure Liquid Chromatography ... 13
3.4.4. Head-Space pressure ... 14
3.4.5. Gas chromatography ... 14
3.5. Methanogens identification with Fluorescence and Phase-Contrast microscopy ... 14
4 Results and Discussion ... 16
4.1. Serum bottle cultures (50 mL) ... 16
4.2. Hungate-Type Tube (5 mL) ... 22
6 References ... 34
7 Appendix ... 36
7.1 DSMZ media ... 36
7.2 High-Pressure Liquid Chromatography ... 42
7.2.1 Data Acquisition ... 42
7.2.2 Operation parameters ... 42
7.2.3 Calibration curves ... 43
7.2.4 Medium and medium components chromatograms ... 44
7.2.5 Example of chromatograms from serum bottle cultures ... 46
1 SCOPE
Renewable sources of energy are becoming more important for the reduction of greenhouse gases, namely carbon dioxide from combustion of fuels from oil. The energy crisis in the 70s in the United States of America and other developed countries brought attention to global environment quality (Chynoweth et al., 2001).
One of the most known and common green combustibles existent is biogas which is why production of biogas - biomethanation- has turned to be an important subject of study. As so, two big reasons can be pointed: the reduction of solid waste and the production of energy in an environment friendly fashion (Kashyap et al., 2003).
Today, biogas is mainly produced in anaerobic digesters where biogas yields are not continuous indicating that some problems exist and, therefore, should be resolved. The study of anaerobic digestion in different conditions (media, temperature, pH, etc) can be achieved by high-throughput screening using small digesters.
In this work, attempts to produce biogas in small bioreactors were performed with different media and consortia of microorganisms aiming to identify the lowest culture volume regarding the sample volume for different monitoring and quantification techniques.
2 INTRODUCTION
Life on Earth is very complex, but as far as we know, it started in a very simple way. Possibly, primitive bacteria were the living beings at that time. The conditions of the planet were not favourable for life as we know today. For instance, the atmosphere did not have oxygen and it was warmer, that is why the primitive cells were most likely to be anaerobic and heat-stable (Balch et al., 1979).
Phylogenetically organisms are divided in three domains: Bacteria, Archaea and
Eucaryota. Archaea is the domain characterized by organisms that grow in
extreme/hostile conditions, such as methanogens.
In the eighteenth century, Alessandro Volta identified places plentiful of decaying vegetation as source of biogas, which at that time was called “combustible air” (Balch et al., 1979). This lead to additional research for the identification of the organisms involved in methane production (Balch et al., 1979).
The composition of biogas is approximately 55-65% methane and 45-35% carbon dioxide. A comparison of calorific values between biogas and natural gas is shown in
Table 2.1. Also biogas when compared to diesel, 6 kWh/m3 corresponds to a half-liter
of diesel showing that the current use of fuel could be reduced in fair amounts (Kashyap et al., 2003).
Table 2.1: Calorific value of biogas and natural gas at standard temperature
and pressure (modified) (Angelidaki et al., 2003).
Biogas 65% CH4 Biogas 55% CH4 Natural gas
Lower calorific
value kWh/m3 6.5 5.5 10.8
Upper calorific
2.1 Anaerobic digestion
Anaerobic digestion occurs naturally in ecosystems such as sediments, swamps, rumen and others (Zinder, 1993). By knowing that, sources of complex polymers as sewage sludges, vegetables, fruit waste, wood, weeds and aquatic biomass have potential to be digested and ultimately converted into methane (Gunaseelan, 1997). The substrate used by methanogens is the product of continuous steps of hydrolysis of polymers and oxidation of the resulting monomers in the anaerobic digestion process (Kashyap et al., 2003; Miyamoto, 1997). Methanogens need anoxic conditions in the anaerobic digestion to grow and to produce energy (Archer, 1983). It should be mentioned that anaerobe microorganisms that can survive to oxygen are named oxyduric and those that die in its presence are named oxylable (Hungate and Macy, 1973).
Methanogens are the organisms that perform the last step in the oxidation-reduction chain in the anaerobic digestion. They consume hydrogen (H2) produced by
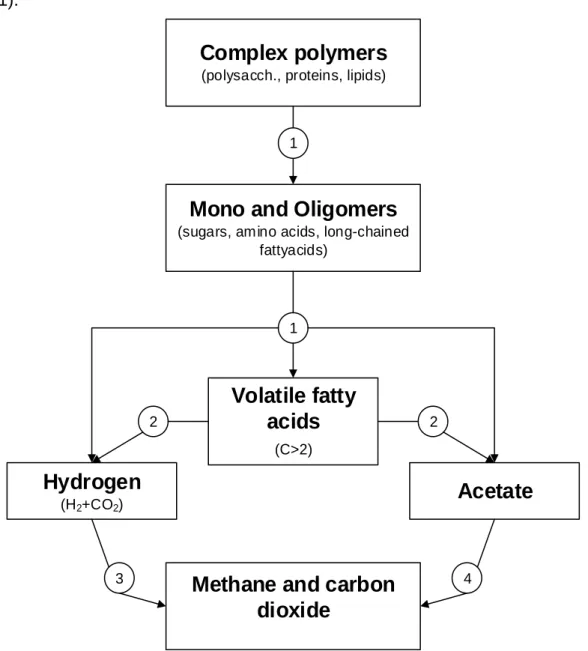
hydrogen-producing bacteria which is essential for organic matter degradation during the digestion process (Bryant, 1979). This means that methanogens thrive in syntrophy (Sieber et al., 2010), explained below. In Figure 2.1 where anaerobic digestion is represented, it is shown that it is carried out by microorganisms in different trophic levels (Elferink et al., 1998; Zeikus et al., 1980) and each step in is carried out by a different group of organisms (represented by numbers).
In the first step, Hydrolysis, hydrolysing and fermenting microorganisms degrade large polymers (“1” in Figure 2.1). Large polymers and monomers are mainly used to produce acetate and hydrogen, but also volatile fatty acids (propionate and butyrate) and some alcohols (Ahring, 2003). In this hydrolysis step, anaerobic and facultative bacteria (Deublein and Steinhauser, 2011) use extracellular enzymes such as proteases, cellulases and amylases to degrade the polymers (Miyamoto, 1997). The efficiency of polymer degradation can be considered as a rate-limiting step for the next anaerobic digestion steps (Miyamoto, 1997). Facultative anaerobes play an important role in the anaerobic digestion because they remove the dissolved oxygen, reducing the redox potential needed for strict anaerobes (Deublein and Steinhauser, 2011).
In the second and third step, Acidogenesis and Acetogenesis occur, respectively. In these steps short-chain organic acids with three to five carbons (e.g. propionate and butyrate (Ahring, 2003)) are converted into acetate, carbon dioxide, and hydrogen by hydrogen-producing acetogenic bacteria through endergonic reactions (“2” in Figure
2.1) (Deublein and Steinhauser, 2011). Acetogenic bacteria are obligatory hydrogen
producers and require low hydrogen partial pressure (Deublein and Steinhauser, 2011).
The fourth step, Methanogenesis, is divided according to which substrate is used, into acetoclastic or hydrogenotrophic bacteria (Deublein and Steinhauser, 2011). Acetoclastic bacteria produce methane from acetate and hydrogenotrophic bacteria produce methane from hydrogen (H2) and carbon dioxide (CO2) (“3” and “4” in Figure
Complex polymers
(polysacch., proteins, lipids)
Mono and Oligomers
(sugars, amino acids, long-chained
fattyacids) 2 2
Volatile fatty
acids
(C>2)Hydrogen
(H2+CO2)Acetate
Methane and carbon
dioxide
3 4
1
1
2.1) (Ahring, 2003). The hydrogenotrophic microorganisms help to keep the hydrogen
partial pressure low, which is important for the previous step. For these archaea, strictly anaerobic conditions (redox potential below -300 mV (Miyamoto, 1997)) are essential for the production of methane.
In summary, the anaerobic digestion process requires microbial consortia composed of fermentative bacteria, acetogenic bacteria and strictly anaerobic methane-producing organisms which metabolic pathways are connected and dependent on each others (Ferry, 1992; Mah et al., 1977). As a consequence, the microbial community present in the digester, determines its performance (Demirel and Scherer, 2008).
2.2 Biochemistry
and
thermodynamics
of
methanogenesis
The purpose of studying methanogens in laboratory is needed in order to understand their importance in methane production. Hungate & Macy (1973) have described methanogenic bacteria as one of the most difficult organisms to study in laboratory conditions. However, their growth is still possible.
Methanogens grow on different carbon sources and, hence, can be grouped according to that source. These groups and their substrate are indicated in Table 2.2.
Table 2.2: Types of methanogens according to substrate (Deublein and
Steinhauser, 2011).
Type of methanogen Substrate
CO2 type CO2 , HCOO-,CO
Methyl type CH3OH, CH3NH3, (CH3)3NH +, CH
3SH,
(CH3)2S
Acetate type CH3COO
-Although methanogenic bacteria can get energy from chemical reactions 1) and (2-2) only few can get energy through (2-3) (Bryant, 1979). The free Gibb’s energy for these equations are respectively −135.4, −131.4 and −130.4 kJ mol⁄ (Deublein and Steinhauser, 2011).
4𝐻2+ 𝐻𝐶𝑂3−+ 𝐻+ → 𝐶𝐻
4+ 3𝐻2𝑂 (2-1)
4𝐻𝐶𝑂𝑂− + 𝐻
2𝑂 + 𝐻+ → 𝐶𝐻4 + 3𝐻𝐶𝑂3− (2-3)
Using acetate as substrate, methanogenic species can grow and obtain energy by the chemical reaction showed in equation (2-4). This reaction has a ∆𝑮𝒇′ = −30.9 kJ/mol (Deublein and Steinhauser, 2011):
𝐶𝐻3𝐶𝑂𝑂−+ 𝐻2𝑂 → 𝐶𝐻4 + 𝐻𝐶𝑂3− (2-4)
The chemical reactions involved to obtain energy from different carbon sources by methanogenic archaea can be approximated by equation (2-5) (Deublein and Steinhauser, 2011):
𝐶𝑐𝐻ℎ𝑂𝑜𝑁𝑛𝑆𝑠+ 𝑦𝐻2𝑂 → 𝑥𝐶𝐻4+ 𝑛𝑁𝐻3+ 𝑠𝐻2𝑆 + (𝑐 − 𝑥)𝐶𝑂2 (2-5)
Where the subscript indicates the number of atoms and 𝑦, 𝑥, 𝑛 and 𝑠 are the stoichiometry coefficients. Specifically, 𝑥 = 0.125(4𝑐 + ℎ − 2𝑜 − 3𝑛 − 2𝑠) and 𝑦 = 0.250(4𝑐 − ℎ − 2𝑜 + 3𝑛 + 2𝑠).
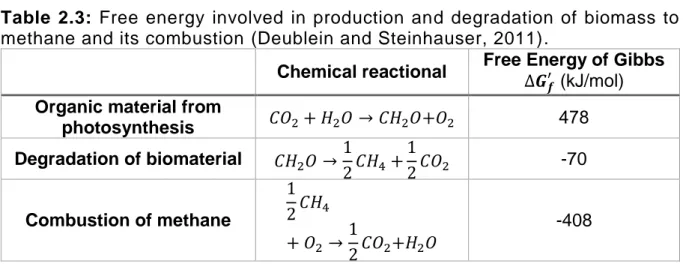
The methane formation is very important in the global carbon cycle because it degrades complex organic matter with a relatively small growth yield (Bryant, 1977) allowing 85% saving of the energy content of glucose (Deublein and Steinhauser, 2011). During anaerobic digestion a large amount of organic matter is digested and around 90% of the overall energy, or more, is retained in methane (Bryant, 1979). This energy saving can be understood with the Gibb’s free energy for the three key steps of the carbon energy cycle in Table 2.3 (Deublein and Steinhauser, 2011).
Table 2.3: Free energy involved in production and degradation of biomass to
methane and its combustion (Deublein and Steinhauser, 2011).
Chemical reactional Free Energy of Gibbs ∆𝑮 𝒇
′ (kJ/mol) Organic material from
photosynthesis 𝐶𝑂2+ 𝐻2𝑂 → 𝐶𝐻2𝑂+𝑂2 478 Degradation of biomaterial 𝐶𝐻2𝑂 →1 2𝐶𝐻4 + 1 2𝐶𝑂2 -70 Combustion of methane 1 2𝐶𝐻4 + 𝑂2 → 1 2𝐶𝑂2+𝐻2𝑂 -408
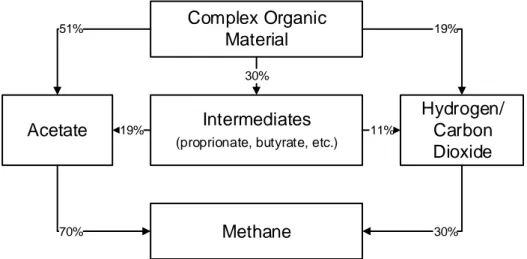
From all the carbon sources that methanogens can use to produce methane, 70% is produced from acetate and 30% from hydrogen/carbon dioxide as is shown in Figure
2.3 Methanogens
All methanogens belong to the domain Archaea, phylum Euryarcheaota (Madigan et al., 2012) they appear in all shapes: irregular plates, spirilli, rods or cocci (Deublein and Steinhauser, 2011).
Methanogens are a special group of microorganisms for two reasons. The first reason is the number of unique coenzymes they possess (F420, F430, methanopterin, methanofuran, HS-HTP and M) (Cheeseman et al., 1972; Deublein and Steinhauser, 2011; Wolfe and McBride, 1971). For example, coenzyme F420 and coenzyme M are only detected in methanogens (Balch et al., 1979). Coenzyme F420, is an electron donor in the reduction of carbon dioxide and in the production of methane that, when reduced, fluoresces a blue-green colour at 420 nm (Ashby et al., 2001). The fluorescence properties are a powerful method for recognition of methanogens in mixed cultures, or to verify the purity of a culture (Doddema and Vogels, 1978). The second reason is the presence of two rare amino acids: the 21th amino acid, selenocysteine contains selenium instead of sulphur (Madigan et al., 2012). Thus, the growth of microorganisms belonging to genus Methanococcus is stimulated by selenium (Deublein and Steinhauser, 2011). The 22th amino acid, pyrrolysine was first discovered in archaea that generate methane (Hao et al., 2002; Madigan et al., 2012; Srinivasan et al., 2002). Complex Organic Material Acetate Hydrogen/ Carbon Dioxide Intermediates
(proprionate, butyrate, etc.)
Methane 51% 19% 11% 19% 30% 70% 30%
Figure 2.2: Carbon flow in anaerobic digestion with methanogens
As stated before methane is mainly produced from acetate, e.g. by Archaea
Methanosarcina barkeri, Methanobacterium soehngenii and Methanabacterium thermocutotrophium which are characterized by slow growth, with duplication time
around 100 h (Deublein and Steinhauser, 2011).
Methanogens, specifically hydrogentrophic, play an important role in anaerobic digestion, because of syntrophic growth. This group of methanogens keeps hydrogen (H2) partial pressure low by using it to produce methane (Bryant, 1977). This syntrophic
reaction allows, thermodynamically, the oxidation of complex molecules by acetogenic bacteria (e.g. proprionate and butyrate (Visser et al., 1993)) (Sieber et al., 2010). Recent studies in granular sludge demonstrated that colonies with syntrophic growth of bacteria and methanogenic archaea allowed an efficient interspecies hydrogens transfer that, as a consequence, can lead to high degradation rates of different complex substrates (Hulshoff Pol et al., 2004).
The polymorphism of Archaea allows them to be distinguished from other domains only by the sequence of the 16S-rRNA (Deublein and Steinhauser, 2011). The both extreme conservative and variable region of 16S-RNA (Elferink et al., 1998) can be useful to establish relationships between different microorganisms using bioinformatics. This method of obtaining information is very important to detect and identify microbial composition of an anaerobic sludge due, to its complexity (Balch et al., 1979).
The methanogenic strains used in this study were Methanospirillum hungatei DSM864,
Methanococcus maripaludis DSM14266 and Methanosarcina mazei DSM3647.
Taxonomy of these organisms is shown in Table 2.4 and a brief description and reference to its metabolism are shown in Table 2.5.
Table 2.4: Taxonomy of the methanogens used in this study. All belong to the
domain archaea and phylum Euryarcheaota. (C)-class, (O)- order, (F)- Family, (G)-genus.
Methanogens strain Taxonomy
Methanospirillum hungatei (C) Methanomicrobia (O) Methanomicrobiales (F) Methanospirillaceae (G) Methanospirillum Methanococcus maripaludis (C) Methanococci (O) meMethanococcales (F) Methanococcaceae (G) Methanococcus Methanosarcina mazei (C) Methanomicrobia (O) Methanosarcinales (F) Methanosarcinaceae (G) Methanosarcina
Table 2.5: Pure strains of methanogens used in this study (Balch et al., 1979;
Deublein and Steinhauser, 2011).
Methanogens
strain Description Metabolism
Methanospirillum hungatei
Methanospirillum are rod shape
with polar flagellation and separate by spacers. Cells surrounded with SDS-resistant protein, constituted by 70% amino acids, 11 % lipid and 6.6% carbohydrates. 45-50%
G+C DNA base composition.
Substrate can be 𝑯𝟐/
𝑪𝑶𝟐 and formate. Some
species use 2-butanol and 2-propanol as hydrogens donors for the methanogenesis of
CO2
Methanococcus maripaludis
Methanococcus are Gram-negative
cocci. The cell wall is composed of non-glycosylated proteins subunits.
30-41 % G+C DNA base composition
Grow thermophilically or mesophilically. Growth stimulated by selenium.
Sources of energy are 𝑯𝟐/𝑪𝑶𝟐and formate
Methanosarcina mazei
Most species are Gram-positive containing methanochondroitin. Cell spherical to pleomorphic. The
cell walls consist of N-acetyl-D-galactosamine and D-glucuronic or
D-galacturonic acid in a molecular ratio of 2:1. 40-51% G+C DNA
base composition.
Long range of nutrients: acetate, 𝑯𝟐/𝑪𝑶𝟐, metanol, methylamines.
2.4 Reactors in small scale
Usually, experiments using large and/or small scale reactors gives different results about the same process (Doig et al., 2006) which makes it difficult to scale-up a process. In contrast, some microorganisms perform better in small scale than in large scale (Leeuwen, 2011). For this reason, small scale bioreactor technology aims to improve wild-type productivity, accelerate the screening of newly discovered microbes and process optimization, e.g. medium and parameters tuning (Betts and Baganz, 2006; Leeuwen, 2011)
Small scale (bio)reactors will allow a better comparison between screening and industrial scale through the developments in miniaturization of sensors and microfluidics allowing on-line measurements (Kumar et al., 2004; Leeuwen, 2011). For example, the pH can be measured and controlled in a similar way at both large and small scale. Thus, mini reactors scale-up will become fast, cost and time effective (Kumar et al. 2004).
3 MATERIALS AND METHODS
3.1 Methanogenic bacteria
In this study pure cultures of methanogenic archaea were used, namely
Methanobacterium hungatei, Methanosarcina mazei and Methanococcus maripaludis.
All strains were purchased from Deutsche Sammlung von Mikroorganismen und Zelkulturen, DSMZ, (Braunshweig, Germany) with the designation DSM864, DSM3647 and DSM14266, respectively.
The two unknown consortia originated from samples of wastewater treatment plants in Garmerwolde 1) and municipal solid waste treatment plant in Lelystad (sludge-2), The Netherlands.
3.2 Media preparation
The media used were a modification of the DSMZ’s protocols and prepared with common laboratory glassware and chemicals with grade for analysis. Stock solutions were prepared and sterilized to avoid the need for a final sterilization as in DSMZ protocols.
For medium DSM141 the compound ammonium iron (II) sulphate hexahydrate was not used. The sulphate ion was compensated increasing the sodium sulphate concentration from 0.10 to 0.1014 g/L in the trace elements stock solution of this medium. For DSM120 the acetate and methanol 50% (v/v) concentration were changed from 2.5 g/L and 10 mL/L to 10 g/L and 0.5 mL/L, respectively (Mah, 1980). After the medium was prepared, the flush steps were performed with anoxic gases using air filters (0.2 μm) to keep the system sterile. The anoxic gas mixture H2/CO2
(80/20) (v/v) in the media DSM119 and DSM141 was not used. N2/CO2 (80/20) (v/v)
was used in all cultures for sparging/flushing (during 20-30 min) and as culture atmosphere. The pressure in the head-space was set to zero relatively to atmosphere
pressure, before inoculation. For DSM141 the cultures were not cultivated on overpressure.
DSMZ medium protocols can be found in appendix DSMZ media.
3.3. Culturing methanogens
Each known methanogenic strain was cultivated in the respective modified medium. This means, Methanobacterium hungatei, Methanosarcina mazei and Methanococcus
marpaludis were cultivated in the medium DSM119, DSM120 and DSM141,
respectively. The growth conditions were mesophilic (35 ºC) with casual shaking and without light (unless otherwise stated).
The cultures were divided in two ways. In the first way, cultures grew in serum bottles (50 mL) while the second way was in Hungate-type tubes (5 mL) from Bellco Glass (USA).
3.3.1.
Cultures in serum bottles (50 mL)
The cultures started with 50 mL of fresh medium prepared as explained before and inoculated under sterile conditions with 500 μL of DSMZ aliquots for each methanogen. The bottles were closed with butyl-rubber stoppers beforehand cleaned with 70% ethanol (v/v) under flame and secured with a metal-screw cap.
3.3.2.
Cultures in Hungate-type tubes (5 mL)
Unlike the previous cultures, due to small volumes of medium needed, 250 mL of modified media DSM119, DSM120 and DSM141 were prepared as stated above. The Hungate-type tubes were flushed during 15 min with nitrogen gas before being autoclaved. Then fresh medium (4.5 mL) was transferred with a sterile syringe into the tubes. If the medium turned pink, the medium was flushed with N2/CO2 80/20 (v/v) gas
that they were shaken by hand once a day. Note that the oxygen in the syringe was removed by filling and depleting it three times with a gas mixture of nitrogen and carbon dioxide N2/CO2 80/20 (v/v) in a serum bottle.
3.4. Growth monitoring and product quantification
3.4.1.
Optical density and pH
From the 50 mL cultures samples of 1.5 mL were taken before and after inoculation during approximately 30 days. The samples were diluted ten times and the absorption was measured at 600 nm (DR39000, Hach, USA).
The pH was measured (Sentro) directly from the 1.5 mL sample tube. After this the samples were frozen at -20 ºC.
3.4.2.
Dry weight
The stored samples from serum bottles cultures were thawed at room temperature and 1 mL was transferred to a new 1.5 mL tube previously weighted (AG204 Delta Range, Mettler Toledo, CH). From the Hungate-type cultures fresh samples of 1 mL were collected.
The pellet was obtained by centrifuging during 10 min at 15000 g (Sorvall Legeng X1R, Thermo Scientific, USA) and frozen with liquid nitrogen during five minutes. The tubes were covered with parafilm, pierced and placed in the freeze dryer operating at -80 ºC and 1 mbar overnight (Christ, GE). Finally, the tubes were again weighted.
3.4.3.
High-Pressure Liquid Chromatography
The acetate and formate were quantified through chromatography using the HPLC-UV system with a pump P4000, an autosampler AS3500 and UV/Vis detector UV1000 from SpectraSystems, USA. For the chromatographic separation a fatty acids column
ROA-Organic Acid H+ (8%) (Phenomenex, NL) was used with the following operation parameters: flow rate 1 mL/min, room temperature and injections of 10 μL. The mobile phase was 2.5 mM of sulfuric acid in MiliQ water. The compounds were detected at 210 nm and the data was collected using the data acquisition device USB-2408 from Measurement Computing (USA). The data collected was saved as comma separated value file using the software TracerDAQ v2.3.0.0, filtered in MS Excel and treated with Ezdata. In Ezdata the data was adjusted to “Great” on Baseline Correct and for acetate concentration the y-data was set to 100 units/point. More details can be found in appendix 7.2 High-Pressure Liquid Chromatography.
3.4.4.
Head-Space pressure
The growth was also followed by measuring the pressure inside the tube relatively to atmospheric pressure using a pressure meter (GMH3151 from Greisinger, CZ).
3.4.5.
Gas chromatography
The methane produced was quantified using a micro gas chromatography C2V-200 micro GC (NL). The calibration gas consisted of 50% methane, 19.97% carbon dioxide, 30% nitrogen (Messer, GE). The samples were injected with a syringe pump operating at 1 mL/min for a 5 mL syringe or 0.2 mL/min for a 1 mL syringe.
3.5. Methanogens identification with Fluorescence and
Phase-Contrast microscopy
Samples of cultures were taken and concentrated by centrifugation at 16000 g during 5 min (5414C, Eppendorf, GE). The pellet was resuspended in the same medium, pipeted to a microscope slide and covered with cover slip. Slides were analysed with an Oxion (Euromex, NL) with UV filter block AE.3248 (on position one) and a CX41 phase microscope (Olympus, JP). Microscope pictures were taken with an EOS Canon
(JP) camera with aperture time of 30 seconds for fluorescence and 15 seconds for phase-contrast with ISO3200 and default settings for MemoPad FHD10 (Asus, TW).
4 RESULTS AND DISCUSSION
4.1. Serum bottle cultures (50 mL)
In this section the results obtained for the cultures of pure methanogens species are shown. The methanogens grew in 50 mL serum bottles in respective DZMS’s modified media at 35 ºC.
Three modified media were used to inoculate the DSMZ aliquot of methanogens M.
hungatei, M. mazei and M. marpaludis, except for M. mazei. The medium was
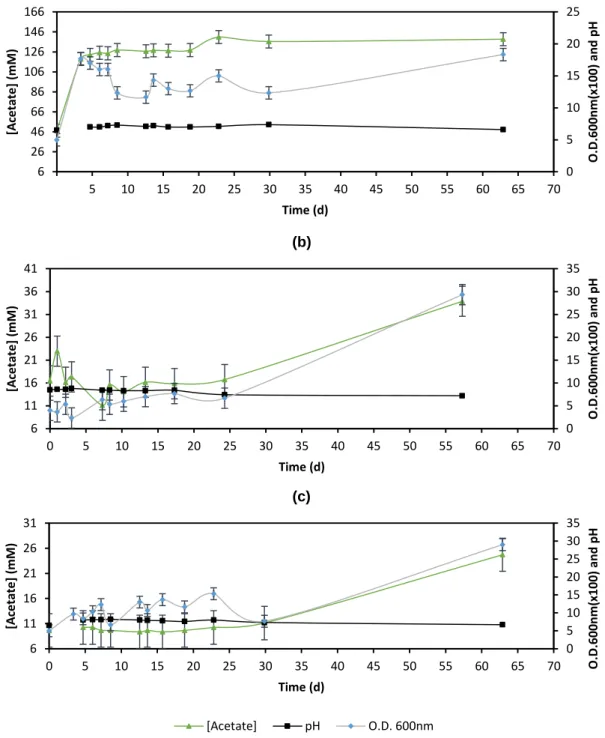
inoculated with a previous culture with eleven days. To follow the growth of cultures, samples of 1.5 mL were taken everyday for approximately a month, which lead to decreasing of the volume of culture and increasing the probability of contaminations with oxygen and microorganisms. After a month samples have been taken again to avoid those previous issues. The samples of culture were used to determine pH, optical density (O.D.) and acetate concentration, which were summarized in Figure 4.1. In the first days after inoculation the pH values were relatively high (pH = 8). A previous study reported that pH values should be between 6.5 and 7.0 for the optimal growth (Bryant, 1979). However, the pH decreased to expected values after the cultivation period for all the cultures (Figure 4.1).
The optical density (Figure 4.1) remained relatively constant during the first twenty days compared to the values after sixty-three days of culture. This result showed that the difference between O.D. values after the first month and the beginning of the culture is not as big as the difference between the second month and the first month. These differences are 0.22 and 0.21 for M. hungatei (Figure 4.1b) and M. maripaludis (Figure 4.1c), respectively. There was no difference observed between the second and the first month of M. mazei cultivation (Figure 4.1a).
However, despite the increase in optical density and the decrease in pH after the cultivation period, no growth of methanogens could be noticed since no obvious differences in the amount of substrate (acetate) were observed (Figure 4.1). Comparing the initial and final concentration of acetate in the growth media of M.
4.1a), while for M. hungatei and M. maripaludis cultures, the concentration increased
from 12 mM to 34 ± 3 mM and 25 ± 3 mM, respectively (Figure 4.1b and Figure 4.1c, respectively). Thus, with high-pressure liquid chromatography (HPLC) analysis it was shown that acetate was slightly consumed for M. mazei (Table 4.1) which was not
Figure 4.1: Evolution of pH, optical density at 600 nm and concentration
of acetate for methanogens in pure culture: (a) M. mazei, (b) M. hungatei and (c) M. maripaludis. 0 5 10 15 20 25 6 26 46 66 86 106 126 146 166 5 10 15 20 25 30 35 40 45 50 55 60 65 70 O.D .60 0n m( x10 0) an d p H [A ce tate] (mM ) Time (d) (a) 0 5 10 15 20 25 30 35 6 11 16 21 26 31 36 41 0 5 10 15 20 25 30 35 40 45 50 55 60 65 70 O.D .60 0n m( x10 0) an d p H [A ce tate] (mM ) Time (d) (b) 0 5 10 15 20 25 30 35 6 11 16 21 26 31 0 5 10 15 20 25 30 35 40 45 50 55 60 65 70 O.D .600n m( x100) an d p H [A cetate] ( mM) Time (d) (c) [Acetate] pH O.D. 600nm
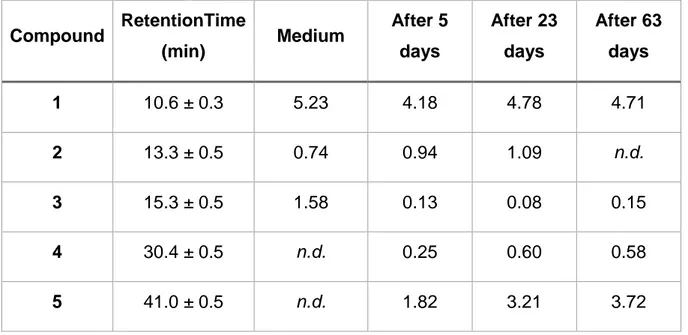
shown in M.hungatei and M.maripaludis cultures (Table 4.2 and Table 4.3, respectively). Despite of that, HPLC results suggests that other compounds were consumed by methanogens and also new products were visible as new peaks in the chromatograms (chromatograms are shown in appendix 7.2.5-Example of chromatograms from serum bottle cultures). As an example, in Table 4.1 for M. mazei showed that the peak area of acetate (compound-1) slightly decreased (0.52 units), compound-3 also decreased in value while compounds-4 and 5 were produced. Similar results were obtained for M. hungatei and M. maripaludis (Table 4.2 and Table 4.3, respectively). Under same conditions, M. hungatei cultures showed that acetate (Compound-2) was not consumed (0.58 units) and additionally compound-1, 4 and 5 dropped to zero after fifty-seven days. At the end of the cultivation, two other new compounds were detected in the chromatogram (Compound-6 and 7). For M.
maripaludis it can be seen that compounds-1 and 3 were consumed and yielded
compounds-4, 5 and 6 and were only detected after fifty-seven days of cultivation suggesting that they were produced. However, as stated before, the area of the peak corresponding to acetate (compound-2) increased (0.45 units)
Table 4.1: Area of relevant peaks identified on the chromatograms from
High-Pressure Liquid Chromatography, using organic acids column to separate compounds during cultivation of Methanosarcina mazei. Compound-1 is acetate, the remaining are unknowns. n.d- not detected.
Compound RetentionTime (min) Medium After 5 days After 23 days After 63 days 1 10.6 ± 0.3 5.23 4.18 4.78 4.71 2 13.3 ± 0.5 0.74 0.94 1.09 n.d. 3 15.3 ± 0.5 1.58 0.13 0.08 0.15 4 30.4 ± 0.5 n.d. 0.25 0.60 0.58 5 41.0 ± 0.5 n.d. 1.82 3.21 3.72
The decreasing or increasing of acetate in the growth of methanogens can be explained as follows. The first reason is the evaporation of water that will lead to more
concentrated medium, because the cultures were incubated at 35 ºC. The second reason is the presence of oxygen, which could inhibit or kill the strict methanogens hence reducing or stopping acetate consumption, respectively. However, none of the cultures turned into pink due to oxidation of resazurin. This could indicate that the amount of oxygen present was not enough to oxidize resazurin but could inhibit and/or kill the present methanogens as they only grow under strict anaerobic conditions. This suggests that a minimum concentration of oxygen was in the cultures, thus they were not completely anoxic for M. hungatei, M. mazei and M. marpaludis to grow.
Table 4.2: Area of relevant peaks identified on the chromatograms from
High-Pressure Liquid Chromatography, using organic acids column to separate compounds during cultivation of Methanobacterium hungatei. Compound-2 is acetate, the remaining are unknowns. n.d.- not detected.
Compound RetentionTime (min) Medium After 3 days After 24 days After 57 days 1 9.7 ± 0.3 1.50 1.46 1.22 0 2 10.6 ± 0.3 0.58 0.60 0.58 1.16 3 13.2 ± 0.3 0.18 0.16 0.15 0.45 4 14.2 ± 0.0 0.34 n.d. n.d. n.d. 5 22.5 + 0.0 0.26 n.d. n.d. n.d. 6 30.6 ± 0.0 n.d. n.d. n.d. 0.36 7 41.3 ± 0.0 n.d. n.d. n.d. 0.11
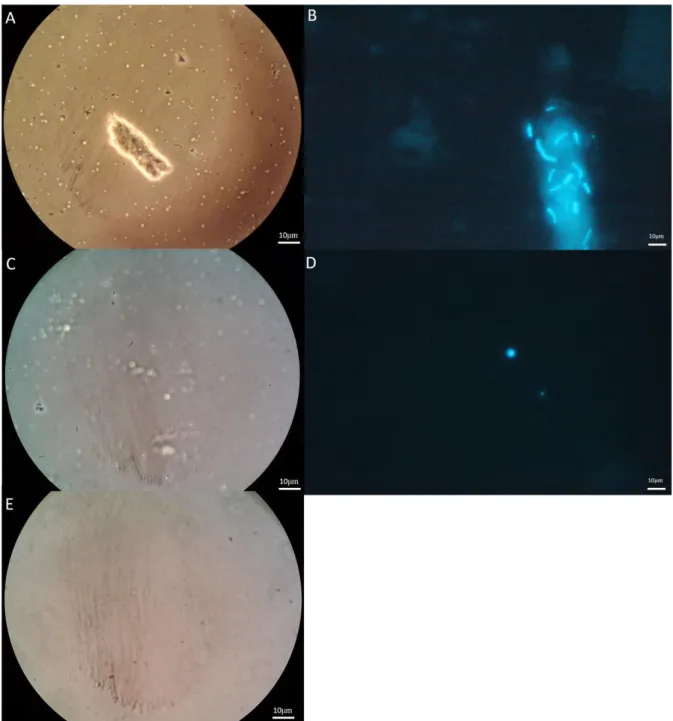
To verify the hypothesis of contamination, samples of each culture were taken after seventy-seven days and observed in phase contrast and fluorescence microscope. The observations showed that the expected cluster of cocci shaped M. mazei were not present in the sample but a bacilli shape organism was visible on both fluorescence and phase-contrast microscopy (Figure 4.2A and B). M. hungatei has a bacilli shaped and it was observed in phase contrast microscope, although, only cocci shaped bacteria were seen in both fluorescence microscopy, suggesting that the bacilli were
not methanogens (Figure 4.2C and D). For M. maripaludis, with cocci form, it was not seen in phase contrast microscope (Figure 4.2E) and fluorescence microscope (picture not taken because nothing relevant was observed).
Table 4.3: Area of relevant peaks identified on the chromatograms from
High-Pressure Liquid Chromatography, using organic acids column to separate compounds during cultivation, of Methanococcus maripaludis. Compound-2 is acetate, the remaining are unknowns. n.d.- not detected.
Compound RetentionTime (min) Medium After 3 days After 24 days After 57 days 1 9.4 ± 0.3 0.58 0.32 0.36 0.05 2 10.6 ± 0.2 0.40 0.36 0.36 0.85 3 15.3 ± 0.5 0.26 0.25 0.20 n.d. 4 17.6 ± 0.0 n.d. n.d. n.d. 0.69 5 30.3 ± 0.0 n.d. n.d. n.d. 1.53 6 40.8 ± 0.0 n.d. n.d. n.d. 5.20
With these observations, it can be concluded that contamination(s) occurred during sampling and/or while the liquid aliquots from DSMZ tubes were stored at 7 ºC (in syringes). The putative contaminations occurred during sampling could have been avoided and/or mitigated if samples were taken in wider periods and inside an anaerobic chamber (to avoid oxygen contamination). One solution that can be discussed is the use of on-line sensors to collected data (e.g. O.D, pH), hence decreasing the risk of contaminations. As referred in the introduction, this is already an emerging and commercialized technology by Applikon (NL) ( http://www.applikon-bio.com). Micro-Matrix is a device, from Applikon, that allows monitoring and control (pH, temperature, dissolve oxygen) of twenty-four individual reactors with working-volumes from 1 to 7 mL for high-throughput fermentation.
Figure 4.2: Phase contrast picture (A, C and E) and fluorescence microscope
pictures using Exitation350/Emission460 (B and D. Pictures A and B are from cultures of Methanosarcina mazei; Pictures C and D are from culture of
Methanobacterium hungatei; and picture E is from culture of Methanococcus maripaludis after seventy-seven days of culture.
4.2. Hungate-Type Tube (5 mL)
To produce methane with two different consortia from two different samples of sewage sludge, i.e., produce biogas with unknown consortia. The experiments were conducted by using two different diluted sludge consortia which were labelled as “sludge-1” to refer to the sludge from the waste water treatment plant from Garmerwolde, and “sludge-2” to refer the sludge from Lelystad’s waste water treatment plant. Both consortia are mesophilic and from The Netherlands. The experiments with 5 mL with the pure cultures were not possible to establish due to issues explained in sub-chapter 4.1 (4.1.Serum bottle cultures (50 mL)).
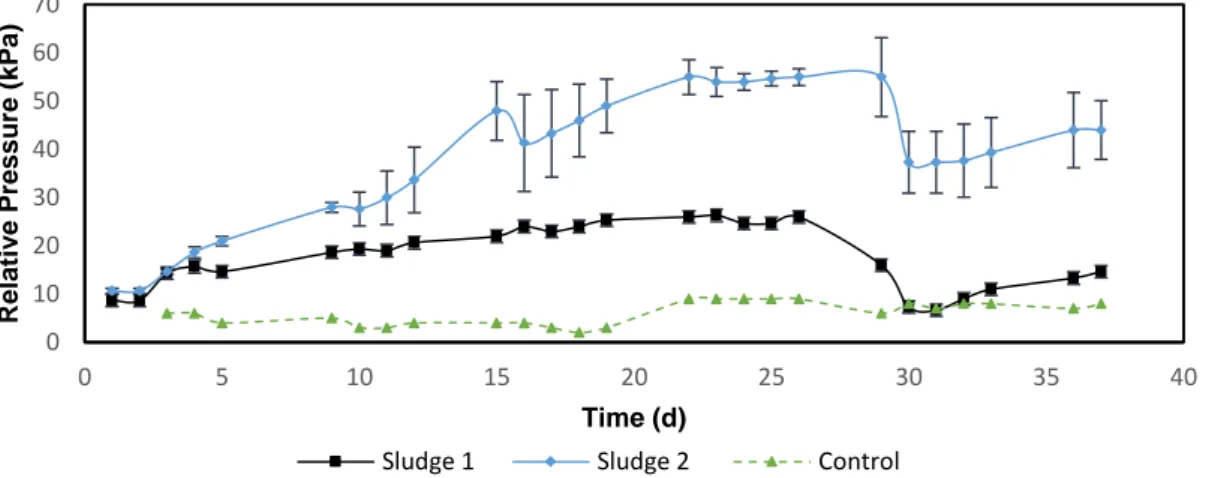
The 5 mL cultures of two sludge samples started with inoculation in three different culture media, which are modifications of DSMZ119, 120 and 141, in Hungate-tubes. They were subsequently monitored during the incubation period by measuring the relative pressure in the headspace. After fourteen days of anaerobic digestion cultures on modified DSMZ120 which was inoculated with sludge-2 showed increased pressure in the headspace. The pressure was approximately twice the pressure of the same medium inoculated with sludge-1, 35 kPa and 15 kPa, respectively. These pressure values indicated that the consortium of microorganisms present in the sludge-2 grow better than the consortium present in sludge-1. Therefore, it indicates a higher probability for methane production. These sludge cultures on medium DSM120 were separately inoculated in new tubes with fresh medium and the pressure was monitored once a day for a month. Cultures growing in the other media were further incubated. The results of pressure increase in the headspace (approximately 13 mL for 5 mL of culture) for the new cultures on modified medium DSM120 (Figure 4.3) showed that the relative pressure inside the tubes inoculated with sludge-1 is less than those inoculated with sludge-2. This data suggests that the consortium in sludge-2 could adapt better, and, consequently, had higher growth rate when comparing with the consortium of sludge-1. However, the difference is probably due to the amount of inoculation material: sludge-1 consortium was a sample from a bottle with diluted sludge, while sludge-2 was obtained as a concentrated sample. In this study, both sludges were diluted with ratio 1:10. Sludge-2 was otherwise not possible to manage, due to high viscosity and dust particles without any dilution step. This difference in dilution could explain the relatively big difference in relative pressure (30 kPa) between both experiments.
Substrate consumption was also tested for the fresh cultures grown in modified medium DSM120. The results of HPLC analysis showed that not all acetate was consumed in approximately forty days of incubation (Table 4.4). The acetate consumption was 20 ± 3 mM and 105 ± 2 mM for sludge-1 and sludge-2, respectively, suggesting that the growth rate of methanogens on acetate was relatively low.
Table 4.4: Area of relevant peaks identified on the chromatograms from
High-Pressure Liquid Chromatography, using organic acids column to separate compounds in the supernatant inoculated with consortium from sludge-1 and sludge-2, with 37 days of incubation at 35 ºC in medium modified medium DSM120. Compound-1 is acetate, the remaining are unknowns. n.d.- not
detected.
Compound Retention Time
(min) Medium Consortium from sludge- 1 Consortium from sludge- 2 1 10.6 ± 0.5 5.23 4 1.75 2 13.4 ± 0.0 0.74 n.d. n.d. 3 15.3 ± 0.7 1.58 0.08 n.d. 4 17.6 ± 1.07 n.d. 0.23 0.1 5 23.9 ± 0.0 n.d. n.d. 0.09 6 24.3 ± 0.0 n.d. 0.39 n.d. 7 39.5 ± 3 n.d. 1.54 1.45
Figure 4.3: Relative pressure in the head-space for cultures of sludge-1 and
sludge-2 on DSM120 modified (1% acetate/0.05% MetOH) medium inoculated with previous culture.
0 10 20 30 40 50 60 70 0 5 10 15 20 25 30 35 40 Rel a tiv e Pres s ure (k Pa ) Time (d)
The substrate consumption of the first 5 mL cultures with the sludge samples grown in modified media DSM119, 120 and 141 was also verified using HPLC analysis after fifty days of cultivation (Table 4.5, Table 4.6, and Table 4.7, respectively). These data suggest the different concentration of inoculated sludge might have affected the non-complete acetate consumption for cultures inoculated with sludge-1. In sludge-2 inoculated cultures all acetate was consumed (compound-2 in Table 4.5 and Table
4.7, compound-1 in Table 4.6 for modified media DSM119 and 141, and DSM120,
respectively). In the modified media, acetate and other medium components were consumed by microorganisms in sludge-2 and sludge-1. Furthermore, new compounds were detected which were not present in the medium before the inoculation; for example: 3 and 4 on modified medium DSM119 (Table 4.5); compounds-2, 4 and 5 on modified medium DSM120 (Table 4.6); and, compounds-3, 4, 5 and 6 on modified medium DSM141 (Table 4.7). In summary, the chromatograms from the supernatant of the cultures showed that for both consortia, the carbon sources were not completely depleted. Based on these results, it is not possible to conclude which medium is the best for the growth of the two unknown methanogenic consortia. Further analysis with gas chromatography (GC) of the produced gas is necessary to understand the best medium. However, quantifying methane proved to be difficult and not reliable which is explained in more detail below.
Table 4.5: Area of relevant peaks identified on the chromatograms from
High-Pressure Liquid Chromatography, using organic acids column to separate compounds in the supernatant of cultures inoculated with consortium from of sludge-1 and sludge-2 growing on medium DSM119. Compound-2 is acetate, the remaining are unknowns. n.d.- not detected.
Compound Retention
time (min) Medium 119
Consortium from sludge 1 Consortium from sludge 2 1 9.8 ± 0.5 1.50 n.d. n.d. 2 10.7 ± 1 0.58 0.82 n.d. 3 14.2 ± 0.5 n.d. n.d. n.d. 4 17.7 ± 0.5 n.d. 0.12 n.d.
In order to understand if there was a direct correlation between acetate consumption and methane production, an assay with consortium from sludge-2 on modified medium DSM119 with increased concentration of acetate from 12 mM to 50 mM was conducted. It was expected that a higher concentration of acetate would generated more methane (Figure 4.4).
Table 4.6: Area of relevant peaks identified on the chromatograms from
High-Pressure Liquid Chromatography, using organic acids column to separate compounds in the supernatant of cultures inoculated with consortium from of sludge-1 and sludge-2 growing on medium DSM120. Compound-1 is acetate, the remaining are unknowns. n.d.- not detected. Data corresponding to
sludge-2 assay was not possible to obtain due to use of culture to inoculate medium for the acetate assay.
Compound Retention time
(min) Medium 120 Consortium from sludge 1 1 10.6 ± 0.5 5.23 3.56 2 12.41 ± 0.00 n.d. 0.18 3 13.36 ± 0.00 0.74 n.d. 4 24.13 ± 0.00 n.d. 0.23 5 39.80 ± 0.00 n.d. 4.26
Table 4.7: Area of relevant peaks identified on the chromatograms from High
-Pressure Liquid Chromatography, using organic acids column to separate compounds in the supernatant of cultures inoculated with consortium from of sludge-1 and sludge-2 growing on medium DSM141. Compound-2 is acetate, the remaining are unknowns. n.d.- not detected.
Compound Retention
time (min) Medium 141
Consortium from sludge 1 Consortium from sludge 2 1 9.4 ± 0.5 0.58 n.d. n.d. 2 11 ± 1 0.40 1.33 n.d. 3 12.50 ± 0.00 n.d. 0.15 n.d. 4 13.21 ± 0.00 n.d. n.d. 0.21 5 29.38 ± 0.00 n.d. 1.48 n.d. 6 40.80 ± 0.00 n.d. n.d. 1.92
In Figure 4.4, no direct correlation was observed between biogas production and substrate concentration which could have been resulted in stability of the relative pressure in a certain value for each concentration of acetate: lower values for lower acetate concentration and higher values for higher acetate concentrations.
In comparison with similar experiments (Yang & Okos, 1987) the acetate conversion to methane and carbon dioxide in these conditions may need more than thirty-five days to reach the expected correlation.
The presence of methanogens in the cultures was verified using fluorescence and phase microscopy. The natural fluorescence of methanogens allowed their identification due to the presence of co-factor F420 (Doddema and Vogels, 1978). On the left-hand side of Figure 4.5 different shapes of methanogens bacilli and cocci for both consortia where observed. Comparing the pictures from both microscope techniques for both consortia it was observed that cocci and bacilli shape bacteria were visible using fluorescence microscopy.
With these results of pressure increase in the head-space, acetate consumption and presence of methanogens in the sludges’ consortia the production of methane was expected. In order to confirm biogas production, gas chromatography analysis of the headspace was performed. However, the microGC C2V could not be properly setup to analyse the gas samples in a reproducible manner.
Figure 4.4: Pressure increase in the head-space of the tube with 5 mL of
culture of sludge-2 on modified medium DSM119 with different concentrations of acetate. 0 10 20 30 40 50 60 0 5 10 15 20 25 30 35 40 Pr e ssur e in cr e ase ( kPa) Time (d) 12mM 20mM 30mM 40mM 50mM Control
The microGC C2V was designed to be used as a continuous analysis system. To operate continuously means that the headspace of the (mini) reactor where the anaerobic digestion happens is connected directly to the chromatographic system (more precisely the sampler) (see schematic representation on appendix 7.3 Gas Chromatography). The biogas produced by the culture can then be analysed in real time, i.e., online. The biogas is introduced into sample loop of the GC by the increased pressure in the headspace. Therefore, the pressure of sample is important and for accurate measurements according to the manufacturer, the recommended minimum pressure should be 50 kPa.
In this study, direct connection to the microGC for biogas analysis was not used, but biogas was sampled with a syringe, i.e., samples were not analysed online. The syringe was placed in a syringe pump programmed to operate at a certain flow rate (according to the volume of the syringe), therefore simulating the online measurement of biogas. However, this method was verified as unreliable for quantification of methane and carbon dioxide, due to the low pressure of the sample (values between 1-10 kPa).
Figure 4.5: Fluorescence microscope picture using Exitation350/Emission460
(left side) on the fluorescence microscope and phase contrast picture (right side) of living sample on microscope slide and cover slip . Top row is sample from sludge-2 and bottom row sludge-1 both magnified with 100x oil objective.
Possible reasons for the low pressure of the sample are air leaks/intakes and the syringe used. The samples were collected using a manual valve with adapter for syringe. However, not all connections were properly tested for possible leakages. It was not within the scope of this thesis to optimize the GC and no further optimization of the GC was done. Instead some control experiments with different pressures and different syringes were performed.
To assess the low pressure issue two experiments were conducted using two known gasses. In the first experiment the results on quantification due to sample’s pressure were tested comparing the percentages of methane and carbon dioxide detected when using biogas injected with a syringe and using direct connection to the calibrations’ gas bottle. Thus, three different pressures were compared: pressure from syringe injection, 50 kPa and 5 kPa. The results showed that a higher pressure resulted in more accurate values than lower a pressure and pressure from syringe. For example the value of 50.24 ± 0.03% was obtained at 50 kPa and 49 ± 2% at 5 kPa for gas-1 when it was expected 50%. This can be seen in Figure 4.6 were the blue bar is higher than black and green bars. Hence, better results were obtained for higher pressure, 50 kPa, as the manufacturer recommended.
The second experiment, aimed to understand the use of different syringes and consequently different flow rates to obey the chosen operation method (described in materials and methods). Therefore, two air-tight syringes with maximum volume of 5 mL and 1 mL samples were used to collect the same volume of gas (1 mL), and the syringe pump operated at 1 mL/min and 0.2 mL/min, respectively. Additionally 1 mL syringe was filled with 0.5 mL and the injection of the gas was at 0.1 mL/min. It was verified that there was influence on the quantification of methane and carbon dioxide depending on the volume of harvested sample (Figure 4.7).
0 5 10 15 20 25 30 35 40 45 50 55
Gas 1 Methane Gas 2 Methane Gas 1 Carbon Dioxide Gas 2 Carbon Dioxide
m
ol
%
Calibration gas components
Syringe 50kPa 5kPa
Figure 4.6: Quantity of methane and carbon dioxide in mol% detected with
different sample pressures for gas-1 and gas-2 with the composition 50/20/30 and 5/20/75 (%v/v) of Methane/CarbonDioxide/Nitrogen, respectively. The flow rate of the syringe was 1 mL/min.
Figure 4.7 shows that using different syringes for analysis, there is a decrease in the
quantity of the components detected by the microGC C2V. For example, the percentage of methane detected on gas-1 is 8% higher using 5 mL syringe than using 1 mL syringe. This result is also verified for carbon dioxide and other known gas, i.e., for samples of higher syringe volume (black bars) the amount of methane and carbon dioxide detected is closer to the predicted percentage, contrary to what happens for small volume samples (blue and green bars).
For the above mentioned reasons, it was not possible to determine the concentration of methane and carbon dioxide in the samples.
It should be noted that for small reactors producing biogas only small sample volumes could be taken because sampling with higher volumes could create vacuum. This creates more difficulties because better results can only be obtained with higher sample volumes, which brings the importance of online gas measurements with microC2V. Thus, a system that operates continuously should be considered for future anaerobic digestions and biogas analysis.
0 5 10 15 20 25 30 35 40 45 50 55
Gas 1 Methane Gas 2 Methane Gas 1 Carbon Dioxide Gas 2 Carbon Dioxide
m
ol
%
Calibration gas components
5mL syringe 1mL syringe 0.5mL
Figure 4.7: Quantity of methane and carbon dioxide in mol% detected with
different sample pressures for gas-1 and gas-2 with the composition 50/20/30 and 5/20/75 (%v/v) of Methane/CarbonDioxide/Nitrogen, respectively. The flow rate of the syringes was 1 mL/min, 0.2 mL/min and 0.1 mL/min for 5, 1 and 0.5 mL syringe, respectively.
In Figure 4.8 a schematic representation of a continuous system shows how this could be achieved. The continuous system should include pumps for pumping in and withdraw fresh medium and culture broth, respectively. The use of two valves upstream and downstream of the minireator will allow the working volume to be constant over time, i.e., a continuous anaerobic digestion. Therefore, the volume that enters the reactor is equal to the volume coming out of the reactor and does not washout the biomass. The way to operate continuously with the valves listed above can be achieved using syringe pumps operating synchronously with two syringes.
Figure 4.8: Schematic representation of a continuous system for production of
biogas. “P”- pressure gauge.
The synchronised operation of the two pumps might work as follows: when the pump-1 injects fresh medium to the reactor through the valve-pump-1 output (axial), while in the valve-2 (perpendicular entry) the culture broth is removed from the reactor pulled by pump-2. The other way, when the valve-1 syringe is filled, the fresh medium (from "Medium" bottle) enters through the valve-1 (perpendicular input), whereas in the valve-2, medium previously removed from the reactor is injected to the waste bottle, or to sampling container (axial output). This way the working volume is constant.
For this continuous system, there is a direct connection from the headspace of the reactor to the chromatograph. This system will allow the headspace in small-scale reactor to be smaller for an anaerobic digestion with well-established consortia
Medium Fresh medium Culture broth Waste P Gas Chromatography Valve 1 Mini Reactor Valve 2
because the gas is being released through the GC which avoids risk of overpressure. Furthermore, the pressure should be enough for the correct/reliable quantification of methane and carbon dioxide.
Therefore, operating this way will allow online analysis of biogas. Hence, methane and carbon dioxide can be quantified at a given time of the anaerobic digestion in contrast to offline sampling of biogas.
5 CONCLUSION
This study demonstrated the difficulties of growing strict anaerobes in pure cultures. For this reason, pure cultures of different strains to study biogas production was not possible using the medium and culture techniques described in this report. However, it was possible to grow strict anaerobes in cultures inoculated with sludge samples, but reliable quantification of methane was not possible. Nonetheless, there is strong evidence that biogas was produced in cultures inoculated with sludge.
Cultures with methanogenic archaea, M. mazei, M. hungatei, and M. maripaludis in a volume of 50 mL did not grow. The reason why it has not been possible to grow these microorganisms, may be due to high probability of contamination by oxygen and/or microorganisms.
For the production of biogas, it was only possible to study the cultures inoculated with sludge. These cultures were monitored by measuring the relative pressure in headspace in relation to atmospheric pressure. The pressure recorded was significantly higher, indicating possible production of biogas.
Since there are strong indications of biogas production the next step would be the quantification of methane and carbon dioxide by gas chromatography. However, for technical reasons it was not possible to quantify with sufficient confidence the methane and carbon dioxide produced during anaerobic digestion. The gas chromatograph micro C2V was designed to operate online, establishing a connection between the headspace of culture and the sampler. In addition, according to the manufacturer of microC2V the minimum pressure of 50 kPa is required to obtain reliable results. Since the connection was not possible and the required minimum pressure could not be achieved, the solution found was to simulate a continuous measurement using syringe pumps by injecting a sample of biogas taken from the cultures with a syringe.
To demonstrate that the quantifications were unreliable, tests were performed with biogas (with known composition). Syringes with different volumes (consequently different injection flow rates) were used to analyse the same biogas. The results showed that the amount detected of methane and carbon dioxide varies according to
volume of the syringe. It was found that for smaller sample volumes (0.5 mL), methane quantified is 8% less than for larger samples.
In future work it would be interesting, in order to overcome the problems with contamination of oxygen and enable the quantification of methane and carbon dioxide, to consider a continuous anaerobic system rather than batch. Following this idea, the study and identification of Monod equation parameters should the assessed in order to define the operational parameters for the pumps operate continuously with the correct loading rates to avoid wash-out.
6 REFERENCES
Ahring, B.K., 2003. Perspectives for Anaerobic Digestion, in: Ahring, B.K. (Ed.), Biomethanation I. Springer, pp. 2–29.
Angelidaki, I., Ellegaard, L., Ahring, B.K., 2003. Applications of the Anaerobic Digestion Process, in: Ahring, B.K. (Ed.), Biomethanation II, Advances in Biochemical Engineering/Biotechnology. Springer, Berlin, Heidelberg, pp. 13–45.
Archer, D.B., 1983. The microbiological basis of process control in methanogenic fermentation of soluble wastes. Enzyme Microb. Technol. 5, 162–170.
Ashby, K.D., Casey, T.A., Rasmussen, M.A., Petrich, J.W., 2001. Steady-state and time-resolved spectroscopy of F420 extracted from methanogen cells and its utility as a marker for fecal contamination. J. Agric. Food Chem. 49, 1123–1127.
Balch, W.E., Fox, G.E., Magrum, L.J., Woese, C.R., Wolfe, R.S., 1979. Methanogens: reevaluation of a unique biological group. Microbiol. Rev. 43, 260–296.
Betts, J., Baganz, F., 2006. Miniature bioreactors: current practices and future opportunities. Microb. Cell Fact. 5, 1–14.
Bryant, M.P., 1977. The microbiology of anaerobic degradation and methanogenesis with special reference to sewage, in: SCHLEGEL, H.G., BARNEA, J. (Eds.), Microbial Energy Conversion. Pergamon Press, pp. 107–117.
Bryant, M.P., 1979. Microbial Methane Production- Theoretical Aspects. J. Anim. Sci. 48, 193–201.
Cheeseman, P., Toms-Wood, A., Wolfe, R.S., 1972. Isolation and properties of a fluorescent compound, factor 420 , from Methanobacterium strain M.o.H. J. Bacteriol. 112, 527–31.
Chynoweth, D., Owens, J., Legrand, R., 2001. Renewable methane from anaerobic digestion of biomass. Renew. energy 22, 1–8.
Demirel, B., Scherer, P., 2008. The roles of acetotrophic and hydrogenotrophic methanogens during anaerobic conversion of biomass to methane: a review. Rev. Environ. Sci. Bio/Technology 7, 173–190.
Deublein, D., Steinhauser, A., 2011. Biogas from Waste and Renewable Resources: An Introduction. John Wiley & Sons.
Doddema, H.J., Vogels, G.D., 1978. Improved identification of methanogenic bacteria by fluorescence microscopy. Appl. Environ. Microbiol. 36, 752–4.
Doig, S., D, B., F, L., G, L., 2006. High throughput screening and process optimisation. Elferink, S., Lis, R. Van, Heilig, H., 1998. Detection and quantification of
microorganisms in anaerobic bioreactors. Biodegradation 9, 169–177. Ferry, J.G., 1992. Methane from acetate. J. Bacteriol. 174, 5489–5495.
Gunaseelan, V.N., 1997. Anaerobic digestion of biomass for methane production: a review. Biomass and bioenergy 13, 83–144.
Hao, B., Gong, W., Ferguson, T.K., James, C.M., Krzycki, J.A., Chan, M.K., 2002. A new UAG-encoded residue in the structure of a methanogen methyltransferase. Science 296, 1462–1466.
Hulshoff Pol, L.W., de Castro Lopes, S.I., Lettinga, G., Lens, P.N.L., 2004. Anaerobic sludge granulation. Water Res. 38, 1376–89.
Hungate, R.E., Macy, J., 1973. The Roll-Tube Method for Cultivation of Strict Anaerobes. Bull. Ecol. Res. Comm. 17, 123–125.
Kashyap, D., Dadhich, K., Sharma, S., 2003. Biomethanation under psychrophilic conditions: a review. Bioresour. Technol. 87, 147–153.
Kumar, S., Wittmann, C., Heinzle, E., 2004. Minibioreactors. Biotechnol. Lett. 26, 1– 10.
Leeuwen, M. van, 2011. Development of a bioreactor with integrated on-line sensing for batch and fed-batch cultivation on a 100 μL scale. Delft University of Technology.
Madigan, M.T., Martinko, J.M., Stahl, D.A., P.Clark, D., 2012. Microbial Evolution and Systematics, in: Brock Biology of Microorganisms. Benjamin-Cummings Publishing Company, pp. 450–470.
Mah, R.A., 1980. Isolation and characterization of Methanococcus mazei. Curr. Microbiol. 3, 321–326.
Mah, R.A., Ward, D.M., Baresi, L., Glass, T.L., Methane, B.O.F., 1977. Biogenesis of methane. Annu. Rev. Microbiol. 31, 309–41.
Miller, J.N., Miller, J.C., 2010. Statistics and chemometrics for analytical chemistry, 6th ed. Pearson.
Miyamoto, K., 1997. Methane Production, in: Food and Agriculture Organization of the United Nations (Ed.), Renewable Biological Systems for Alternative Sustainable Energy Production. Osaka, pp. 53–67.
Sieber, J.R., McInerney, M.J., Plugge, C.M., Schink, B., Gunsalus, R.P., 2010. Methanogenesis: Syntrophic Metabolism, in: Timmis, K.N. (Ed.), Handbook of Hydrocarbon and Lipid Microbiology. Springer, Berlin, Heidelberg, pp. 337–355. Srinivasan, G., James, C.M., Krzycki, J.A., 2002. Pyrrolysine encoded by UAG in
Archaea: charging of a UAG-decoding specialized tRNA. Science 296, 1459–
1462.
Visser, A., Beeksma, I., Zee, F., Stams, A.J.M., Lettinga, G., 1993. Anaerobic degradation of volatile fatty acids at different sulphate concentrations. Appl. Microbiol. Biotechnol. 40, 549–556.
Wolfe, R.S., McBride, B.C., 1971. New coenzyme of methyl transfer, coenzyme M. Biochemistry 10, 2317–2324.
Zeikus, J.G., Stafford, D.A., Wheatley, B.I., Hughes, D.E., 1980. Anaerobic Digestion, in: Anaerobic Digestion. Scientific Press, Cardiff, pp. 75–103.
Zinder, S.H., 1993. Physiological ecology of methanogens, in: Ferry, J.G. (Ed.), Methanogenesis. Springer US, Boston, MA, p. 128.