European
Parliament
elections report on
media and survey
data
(BE-DE-EL-IE-PT-SP)
post-election Study
Marina Costa Lobo
Lea Heyne
Tiago Silva
Roberto Pannico
Efstratios-Ioannis Kartalis
Nelson Santos
Table of Contents
1. Overview 3
PART ONE.
2. Technical report- media campaign analysis 4
3. The salience of the EU during the campaign for the EP elections 5
4. Comparing salience of the EU in January and May 2019 9
5. Overtime trend in salience of the EU in Apr-May 2019 11
6. A brief overview of content of EU articles in Apr-May 2019 12
PART TWO
7. Technical report- online survey 14
8. Quotas and survey design 16
9. The quality of the online panel data 22
10. Comparing the survey samples with sociodemographic benchmark- figures 23
11. Comparing the survey samples with sociodemographic benchmark - tables 27
12. Comparing attitudes across survey samples- figures 30
13. EU membership: Our country should leave the EU 33
14. EU institutional framework: Satisfaction with democracy 34
15. EU framework: Trust in parliament 35
16. EU institutional framework: EU should move forward to the united states of Europe
36
17. EU policies: Satisfied with EU policies 37
18. EU policies: Most important policy carried out by the EU? 38
19. EU policies: Institution responsible for national economic situation 39
20. EU policies: EU policies are determined by its citizens 40
21. EU policies: My country has a lot of influence on EU policies 41
Appendix 1- Media sections excluded from the analysis 42
1.
Overview
This report is part of MAPLE Project, ERC – European Research Council Grant, 682125, which aims to study the Politicisation of the EU before and after the Eurozone Crisis in Belgium, Germany, Greece, Ireland, Portugal and Spain.
In the preparation of the 2019 EP elections we were able to implement two studies- one that covered one month of online newspaper data during the election campaign, another an online survey that is representative of the population in the six countries covered in MAPLE.
In the report on the media, we offer a preliminary analysis of the salience that the EU had during the 2019 EP election in the online news media of Belgium, Germany, Greece, Ireland, Portugal and Spain.
In the online survey report, we offer an analysis of attitudes towards national and EU issues of representative samples of the population.
Thus, what follows is a summary of
1) the data collected, both in the media and among electors
2) descriptive findings for the salience of the EU during the campaign 3) descriptive findings concerning national and EU attitudes.
2.
Technical Report- Media Campaign Analysis
Two mainstream/quality newspapers of each country were selected and their online articles collected during the 30 days before the 2019 EP election day. The newspapers, were selected for being quality newspapers of (slightly) different political inclinations in each country.
TABLE 2.1- Newspapers included in the Analysis
Country Newspaper 1 Newspaper 2
Belgium De Standaard Le Soir
Germany SZ FAZ
Ireland Irish Independent Irish Times
Greece Kathimerini Ta Nea
Portugal Público Diario de Noticias
Spain El Pais El Mundo
In order to collect this data, an automated scraping application was built, using Python and the platform Heroku for building cloud applications, that downloaded every new article posted on the websites of each newspaper every 24 hours for the limited period we defined beforehand.
Starting from the home page and systematically excluding certain sections that are irrelevant to our research interest1, the application searched for every new
published article and collected its body (main text) and its title, as well as other relevant information like the author (if available), the section and whether it was featured in the home page of the website or not. All ethical guidelines were followed in this process.
In order to identify articles about the European Union (EU), a keyword list was elaborated (partly adapted, and further complemented, from an existing project’s keyword list) which can be seen in Appendix 2. The grepl function of R was then used to search for matches of our list’s patterns/expressions in the title, subtitle and body of the online articles. If one of those keywords appeared in any part of the article we considered it as an article mentioning the EU. This method has been previously validated/compared with two alternative methods (i.e. manual coding, topic modeling) and proved to be extremely consistent (being, nevertheless, the most inclusive method).
Additionally, if any of the keywords appeared in the title or subtitle, we considered the EU a central topic of that article. In this way, this section offers and discusses as well an alternative, and more exclusive, measure of EU salience in the news media.
The period of time of our analysis goes from 2019-04-24 to 2019-05-262.
Additionally, all duplicated observations (articles with the exact same title and
body) were also dropped from the dataset unless those articles were purposely republished in different dates.
3.
The Salience of the EU during the Campaign for the EP
elections
This section is divided, or structured, in four interrelated parts. The first one describes the data collected and presents the salience that the EU had in each newspaper and respective countries. The second part, by comparing that data with similar data collected in a different period of time (early 2019), investigates to what extent the salience that the EU dimension had in May 2019 derived mainly from the EP election and the respective campaign. The remaining two, smaller, parts further discuss this question. First by inspecting the time trends of EU salience and finally by examining the most frequently used words in the EU mentioned articles for each country.
Table 3. 1 - Newspapers and online media data - The salience of the EU during the 2019 EP elections Count ry Ne wspa per Frequ ency EU m ent io ned %EU m ent io ned A vera ge si ze of EU m ent io ned arti cl es (# o f wor ds ) EU Ce nt ra l %EU Ce nt ra l %Ce nt ra l/ Ment io ned %EU Ment io ned % EU Ce nt ra l %Ce nt ra l/ Ment io ned BE De Standaard 1837 124 6.8 506.3 18 1.0 14.5 5.7 1.5 28.4 Le Soir 2989 137 4.6 292.8 58 1.9 42.3 DE Frankfurter AZ 3403 624 18.3 421 271 8.0 43.4 18.9 7.1 37.9 Süddeutsche Z. 1353 263 19.4 612.7 85 6.3 32.3 GR Kathimerini 4553 1119 24.6 526.8 217 4.8 19.4 19.3 4.9 27.5 Ta Nea 4388 618 14.1 464.3 220 5.0 35.6
IR The Irish Ind. 3567 565 15.8 571.5 130 3.6 23.0
18.7 5.4 27.9 The Irish Times 2081 450 21.6 703.5 148 7.1 32.9
PT Público 3165 775 24.5 584.3 221 7.0 28.5 24.6 7.9 32.0 DN 1655 408 24.7 649 145 8.8 35.5 SP El Mundo 4837 612 12.7 733.8 140 2.9 22.9 15.2 3.5 23.2 El País 4898 869 17.7 830.4 204 4.2 23.5 Maple Total 38726 6564 16.9 574.7 1857 4.8 28.3 17.1 5.0 29.5 Mean values 17.1 5.0 29.5
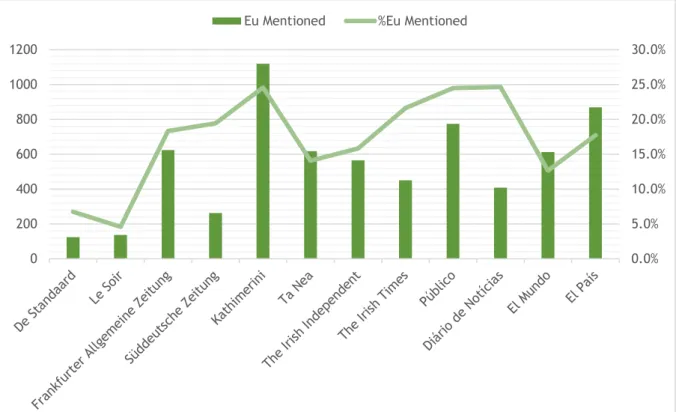
As Table 3.2 shows us, a total of 38,726 articles from the 12 different newspapers were collected and analysed.
The salience that the EU dimension had in the different newspapers varied considerably between countries and between newspapers. In the (roughly) four weeks that preceded the 2019 EP election, which unsurprisingly is, together with EU treaties and referendums, one of the periods when EU is highly visible in the news media, Portugal was the country where the EU dimension was most salient, with both newspapers having a very similar (around 24.6%) proportion of articles mentioning the EU.
Contrarily, as Figure 3.1. shows, the EU had the lowest salience in the two Belgium newspapers. While in the case of the De Standaard, the EU was only mentioned in 6.8% of the articles, in the case of Le Soir, that figure was even lower, with only 4.6% of the articles published in the website of that newspaper mentioning the EU. As we will also see, the salience of the EU in this country was, compared to the other countries, also very low in a different period of time (from 16/01/2019 to 14/02/2019), suggesting that the EU dimension is not simply salient in the media of this country, even amid one this institution’s most important events (EP elections).
In the case of Greece, there was a more noticeable difference between the two newspapers analysed, regarding the proportion of articles mentioning the EU. More concretely, while 24.6% of the articles of Kathimerini mentioned EU, the same happened in only 14.1% of Ta Nea articles. Compared to Kathimerini, not only Ta
Nea had, on average, less articles mentioning the EU, the size of those articles, on
average, was also smaller. In the case of the other five countries, differences between newspapers were less prominent.
Figure 3.1 – Number and proportion of articles mentioning EU in each newspaper.
0.0% 5.0% 10.0% 15.0% 20.0% 25.0% 30.0% 0 200 400 600 800 1000 1200
followed by Germany, were the two countries with the highest proportion of EU central articles. In the case of Portugal, almost 8% of the articles mentioned the EU either in the headline or sub-headline of the article. In the case of Germany, the average proportion of EU central articles was 7.1%. Germany was also the country with the highest ratio between EU central and EU mentioned articles. Almost 40% of the articles that mentioned the EU did it also in the headlines of the article. When it comes to newspapers, it was also the DN (Portugal) and FAZ (Germany) that had the highest proportion of EU central articles, 8.8% and 8% respectively. It is also interesting to see that in the case of Greece, the proportion of EU central articles is relatively the same in both newspapers.
Figure 3.2 - Number and proportion of articles with EU mentioned in articles’ headlines in each newspaper.
Unsurprisingly, Belgium was also the country with the lowest proportion of EU central articles. On average, only 1.5% of the articles published in the Belgium online media gave a central role to EU. It was however Spain that had, overall, the lowest ratio between articles with EU central and articles mentioning the EU. In the online media of this country only 23.2% of the articles mentioning the EU had one of the EU keywords in their titles, a proportion that was practically identical in both El
Mundo and El País.
0.0% 1.0% 2.0% 3.0% 4.0% 5.0% 6.0% 7.0% 8.0% 9.0% 10.0% 0 50 100 150 200 250 300
Figure 3.3 - Average proportion of EU mentioned and EU central articles per Country
Overall, as the previous figure indicates, there were considerable differences between countries regarding the proportion of articles that mentioned EU, as well as the proportion of articles that had EU as a central dimension during the four weeks before the 2019 EP election.
Therefore, despite the EP elections being a moment when we would expect high levels of EU visibility in the news media (regardless of them being treated or perceived as secondary elections), the levels of citizens’ exposure to the EU and the EP parliament elections actually varied considerable between countries, considering mainstream newspapers. 0% 5% 10% 15% 20% 25%
EU in the Media during 2019 EP elections
4.
Comparing Salience of the EU in January and May 2019
In order to understand to what extent our results stem mainly from the campaign for the 2019 EP elections, we also compare our results to identical data collected in a different period (from 16 of January to 14 of February, 2019) that complemented Maple’s first wave online survey. The results, as we can see in 4.1 and 4.2 show that the EP election seems to have boosted the salience of the EU in the media in only three of the countries analysed (Portugal, Greece and Spain). From these three countries, it was Ireland that had the highest EU salience during the first wave (28.1%), followed by Germany (18.7%) and, finally, Portugal (18.4%).The salience that the EU had in Spanish media, in case of both waves, was always lower than the average of the 12 newspapers. This suggests that despite some increase in its visibility during the EP elections, the EU was not very salient in Spain’s two main reference newspapers. In a way, these results are understandable considering the political turmoil’s that this country had been experiencing in this period at its ‘national’ level.
Figure 4.1. Average proportion of articles mentioning EU in wave 1 and wave 2.
The two countries where the salience of the EU increased the most during the second wave were Portugal and Greece, the two EU countries that experienced more intensely the Eurozone crisis and subsequent EU/IMF imposed austerity.
The results of the remaining three countries, though for different reasons, are interesting as well. In the case of Germany, the differences between the two waves are practically non-existent. During the first wave period, 18.7% of the German online media articles mentioned the EU. Nevertheless, differently from countries like Spain or Belgium (where in terms of EU salience between the two
0% 5% 10% 15% 20% 25% 30% 6. 4% 18 .7 % 16 .6 % 28 .1 % 18 .4 % 13 .2 % 16.9 % 5. 7% 18 .9 % 19 .3 % 18 .7 % 24 .6 % 15 .2 % 17 .1 % Wave 1 Wave 2
was comparatively high in both time periods suggesting that the EU has attained ‘news-value’ status among German journalists. In fact, interestingly, the proportion of German EU central articles was even lower during the EP electoral campaign. Belgium was one of the two countries (together with Ireland) where the proportion of EU mentioned articles was lower for the second wave. However, the proportion of EU articles in Belgium media was also extremely low during wave 1. This suggests that low EU salience in Belgium may not simply be a consequence of holding national and European elections at the same day.
Finally, the most peculiar case, when we compare the two waves, was Ireland. In this country, the EU was considerably more salient during the first wave. While in January/February about 28% of the Irish online articles mentioned the EU, in the four weeks before the 2019 EP election only 18.7% of the articles in the same two Irish newspapers mentioned the EU. While we cannot say that the EU was not salient in Ireland during the EP electoral campaign (being above the six country/12 newspapers’ average), that event did not contribute to an increase of the salience that the EU dimension had in the Irish online media.
5.
Overtime Trend in Salience of the EU in Apr-May 2019
Regarding the overtime trend in salience of the EU in the media, we can observe a difference between wave 1 and 2. In the case of wave 2, as we can see in Figure 5.1, the average daily proportion of articles mentioning the EU in the online media of the six countries increased the closer it got to the election day. It was in fact May 26th (the EP election day, except for Ireland) that had the highest salience of the EUin the media. With the exception of Germany and Belgium, this incremental trend can be observed, to some extent for each one of the countries (Figure 5.2).
Figure 5.1 – Average proportion of EU mentioned articles overtime (Wave 2)
Figure 5.2 - Proportion of EU mentioned articles overtime per country (Wave 2)
0% 5% 10% 15% 20% 25% 30% 35% 40% 0% 10% 20% 30% 40% 50% 60%
6.
A brief overview of Content of EU articles in Apr-May
2019
Finally, regarding the content of the articles that mentioned the EU, the table below shows the 30 most frequent words used in those articles. When it comes to this aspect, there weren’t major differences between the countries. Expectedly, the EP campaign contributed chiefly to the salience that the EU had in the media. The salience of words such as ‘party’, ‘may’ and ‘elections’ evidence that. In the case of Ireland and Belgium, ‘Brexit’ was also in the top 10 of most frequently used words suggesting that a significant proportion of the articles published in the media of these two countries dealt with developments in the process of UK leaving the EU. Finally, the salience of words such as ‘government’ and the country name suggest as well a ‘domestication’ of the EU dimension in the mainstream media.
Table 6.1 –List of the 30 most frequent words in news articles that mentioned the EU.
Belgium Germany Greece Ireland Portugal Spain 1 europese mehr ελλάδα ireland eleições españa
2 parlement prozent εε irish partido años
3 plus schon ευρώ brexit europeia elecciones
4 partij deutschland συριζα people governo gobierno
5 may europa νδ new sobre partido
6 europa seit κυβέρνηση european europeu europa
7 jaar partei ευρωεκλογές one portugal dos
8 brexit jahr εκλογές may anos europea
9 wel europäischen είπε year europeias país
10 volgens immer δύο cent ainda presidente
11 procent europawahl χώρα government europa millones
12 stemmen jahren πολιτική party parlamento política
13 zegt wurde τσίπρας last união europeo
14 européenne sagt κόμμα can público según
15 premier viele ευρώπη € país ahora
16 élections euro πρόεδρος years psd parte
17 verkiezingen gibt χρόνια time política puede
18 selon menschen νέα now presidente hace
19 pays unternehmen όταν two campanha tras
20 européennes deutschen τσίπρα minister fazer países
21 européen zwei ευρωπαϊκή business melhor solo
22 moeten etwa πολίτες just pessoas ciudadanos
23 ministre regierung πρωθυπουργός first dia unión
24 land vergangenen γιατί deal todos año
25 mensen spd υπάρχει many porque europeas
26 partijen europäische μαΐου dublin acordo vez
27 parti may ευρωπαϊκής get dois parlamento
28 union land χώρες independent costa después
29 être wahl ποσοστό elections partidos electoral
7.
Technical Report- Online Survey
In 2019, an online panel survey was carried out in two waves. The first wave took place in January 2019 and the second wave started just after the 2019 May European Parliament elections. Our partner for this online survey was Qualtrics.
In this report, only post-election data is presented, i.e. from wave 2. Our questionnaire sought to model the political context of political choices in each country, taking into account national and EU attitudes and political behaviour.
The target population was the general voting population aged >18 years old using the Census 2011 data. The sample size in each country was the following:
Table 7.1. Respondents in the pre and post-election Survey
BE DE IE PT SP GR Wave 1 n 3090 2568 1515 2055 2026 1507 Wave 2 n Of which: 1006 1008 1006 1016 1002 1008 Recontacts from w1 605 618 459 572 564 433 Fresh sample 401 390 547 444 438 575
For wave 2, the field work took place in the following period: Belgium - 31/5/2019 - 29/7/2019 Germany - 30/5/2019 - 26/7/2019 Ireland - 30/5/2019 - 8/8/2019 Portugal - 30/5/2019 - 7/8/2019 Spain - 30/5/2019 - 5/8/2019 Greece - 6/6/2019 - 9/8/2019.
The sample followed and fulfilled a socio demographic matrix which crossed three quotas: gender (male, female); age (18-34; 35-54; 55+); education (less than secondary; secondary; more than secondary). In the next section, we present the survey design in each country.
Quotas were set and nested following the socio-demographic distributions. As confirmed before launching we loosened the education quotas while in the field. This was done as the low education quotas were particularly tough.
The report elaborated here relates to the post-electoral wave of the two wave online panel. In wave one the response rate was the following:
Belgium - 52% Germany - 44% Ireland - 60% Portugal - 47% Spain - 47% Greece - 45%
In wave 2, we established a target for recontacts. Once this target was met, fresh sample was added to complete the target of 1000 respondents, while matching the original 2011 census matrix. The wave 2 sample is both part of a panel, and a stand-alone representative online survey.
8.
Quotas and the Online Survey Design
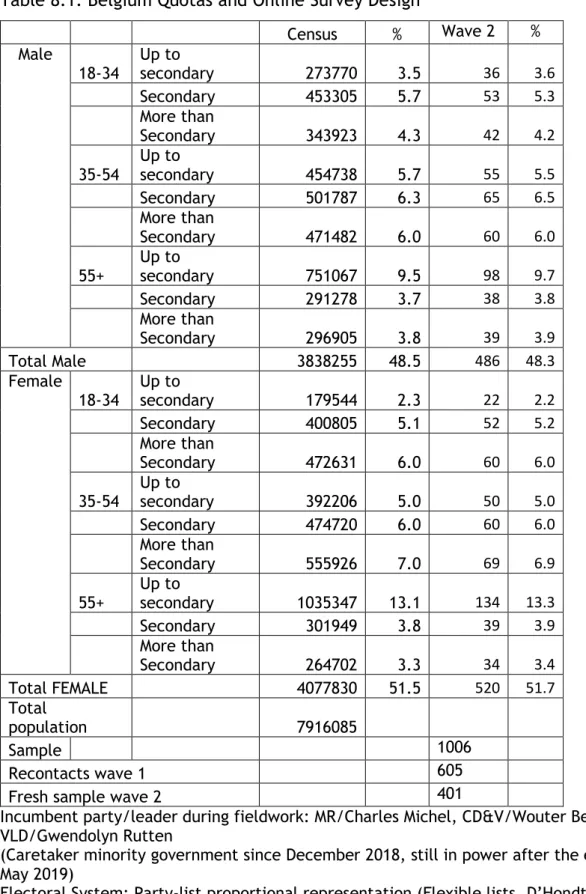
Table 8.1. Belgium Quotas and Online Survey DesignCensus % Wave 2 % Male 18-34 Up to secondary 273770 3.5 36 3.6 Secondary 453305 5.7 53 5.3 More than Secondary 343923 4.3 42 4.2 35-54 Up to secondary 454738 5.7 55 5.5 Secondary 501787 6.3 65 6.5 More than Secondary 471482 6.0 60 6.0 55+ Up to secondary 751067 9.5 98 9.7 Secondary 291278 3.7 38 3.8 More than Secondary 296905 3.8 39 3.9 Total Male 3838255 48.5 486 48.3 Female 18-34 Up to secondary 179544 2.3 22 2.2 Secondary 400805 5.1 52 5.2 More than Secondary 472631 6.0 60 6.0 35-54 Up to secondary 392206 5.0 50 5.0 Secondary 474720 6.0 60 6.0 More than Secondary 555926 7.0 69 6.9 55+ Up to secondary 1035347 13.1 134 13.3 Secondary 301949 3.8 39 3.9 More than Secondary 264702 3.3 34 3.4 Total FEMALE 4077830 51.5 520 51.7 Total population 7916085 Sample 1006 Recontacts wave 1 605
Fresh sample wave 2 401
Incumbent party/leader during fieldwork: MR/Charles Michel, CD&V/Wouter Beke, OPEN VLD/Gwendolyn Rutten
(Caretaker minority government since December 2018, still in power after the elections of May 2019)
Table 8.2. Germany Quotas and Online Survey Design Census % Wave 2 % Male 18-34 Up to secondary 1951430 2.9 28 2.8 Secondary 3955620 5.9 57 5.7 More than Secondary 2137740 3.2 31 3.1 35-55 Up to secondary 1438080 2.2 22 2.2 Secondary 5893800 8.9 91 9.0 More than Secondary 4813930 7.2 72 7.1 55+ Up to secondary 1707630 2.6 26 2.6 Secondary 6136850 9.2 95 9.4 More than Secondary 4077830 6.1 63 6.3 Total Male 32112910 48.2 485 48.1 Female 18-34 Up to secondary 1802230 2.7 26 2.6 Secondary 3418450 5.1 49 4.9 More than Secondary 2703730 4.1 39 3.9 35-55 Up to secondary 1843310 2.8 29 2.9 Secondary 5662170 8.5 88 8.7 More than Secondary 4477300 6.7 67 6.7 55+ Up to secondary 5169210 7.8 80 7.9 Secondary 6752680 10.1 104 10.3 More than Secondary 2620900 3.9 41 4.1 Total FEMALE 34449980 51.8 523 51.9 Total population 66562890 Sample 1008 Recontacts wave 1 618
Fresh sample wave 2 390
Incumbent party/leader during fieldwork: CDU/Angela Merkel, CSU/Markus Söder, SPD/Andrea Nahles
However, the CDU changed leader just before fieldwork and we included both, the
previous leader (Angela Merkel) and the new leader (Annegret Kramp-Karrenbauer) in Q37 Electoral System: Mixed-member proportional representation (Sainte-Laguë using regional fixed lists/First past the post)
Table 8.3. Ireland quotas and online survey design Census 2011 % Wave 2 % Male 18-34 Up to secondary 101055 3.1 29 2.9 Secondary 214623 6.6 67 6.7 More than Secondary 221888 6.9 68 6.8 35-54 Up to secondary 191556 5.9 61 6.1 Secondary 170189 5.3 54 5.4 More than Secondary 244704 7.6 77 7.7 55+ Up to secondary 255471 7.9 49 4.9 Secondary 92040 2.8 39 3.9 More than Secondary 93028 2.9 50 5.0 Total Male 1584554 49.1 494 49.1 Female 18-34 Up to secondary 67333 2.1 21 2.1 Secondary 219045 6.8 68 6.8 More than Secondary 270804 8.4 84 8.4 35-54 Up to secondary 144524 4.5 46 4.6 Secondary 211356 6.5 67 6.7 More than Secondary 254730 7.9 86 8.6 55+ Up to secondary 274550 8.5 39 3.9 Secondary 121053 3.7 37 3.7 More than Secondary 82159 2.5 64 6.4 Total Female 1645554 50.9 512 50.9 Total population 3230108 Sample 1006 Recontacts wave 1 459
Fresh sample wave 2 547
Incumbent party/leader during fieldwork: Fine Gael/Leo Varadkar Electoral System: Single transferable vote
Table 8.4. Greece quotas and online survey design Census % Wave 2 % Male 18-34 Up to secondary 290338 3.3 29 2.9 Secondary 583185 6.5 66 6.6 More than Secondary 362127 4.1 41 4.1 35-55 Up to secondary 499254 5.6 57 5.7 Secondary 578791 6.5 67 6.7 More than Secondary 468300 5.2 54 5.4 55+ Up to secondary 981906 11.0 112 11.1 Secondary 282714 3.2 31 3.1 More than Secondary 288260 3.2 33 3.3 Total Male 4334875 48.6 490 48.6 Female 18-34 Up to secondary 192698 2.2 21 2.1 Secondary 495561 5.6 56 5.6 More than Secondary 481853 5.4 56 5.6 35-55 Up to secondary 494270 5.5 56 5.6 Secondary 562368 6.3 63 6.3 More than Secondary 522427 5.9 57 5.7 55+ Up to secondary 1370766 15.4 64 6.4 Secondary 283144 3.2 64 6.4 More than Secondary 188199 2.1 81 8.0 Total FEMALE 4591286 51.4 518 51.4% Total population 8926161 Sample 1008 Recontacts wave 1 433
Fresh sample wave 2 575
Incumbent party/leader during fieldwork: Syriza/Alexis Tsipras
Electoral System: Semi-proportional representation with majority bonus system
(supposed to be changed to a Party-list proportional representation system in 2019, but not yet in place)
Table 8.5. Portugal quotas and online survey design Census % Wave 2 % Male 18-34 Up to secondary 566849 6.5 66 6.5 Secondary 335146 3.9 38 3.7 More than Secondary 212656 2.5 25 2.5 35-54 Up to secondary 1025566 11.8 122 12.0 Secondary 249954 2.9 30 3.0 More than Secondary 218986 2.5 26 2.6 55+ Up to secondary 1262863 14.6 132 13.0 Secondary 92609 1.1 20 2.0 More than Secondary 107493 1.2 21 2.1 Total Male 4072122 47.0 480 47.2 Female 18-34 Up to secondary 417425 4.8 48 4.7 Secondary 370257 4.3 43 4.2 More than Secondary 342016 4.0 39 3.8 35-54 Up to secondary 977844 11.3 116 11.4 Secondary 286138 3.3 34 3.4 More than Secondary 331947 3.8 38 3.7 55+ Up to secondary 1662035 19.2 110 10.8 Secondary 76911 0.9 41 4.0 More than Secondary 120545 1.4 67 6.6 Total FEMALE 4585118 53.0 536 52.8 Total population 8657240 Sample 1016 Recontacts wave 1 572
Fresh sample wave 2 444
Incumbent party/leader during fieldwork: PS/Antonio Costa
Table 8.6. Spain quotas and online survey design Census % Wave 2 % Male 18-34 Up to secondary 2254865 5.9 58 5.8 Secondary 1532030 4.0 35 3.5 More than Secondary 1514575 3.9 39 3.9 35-54 Up to secondary 3480845 9.1 93 9.3 Secondary 1680540 4.4 42 4.2 More than Secondary 2333220 6.1 62 6.2 55+ Up to secondary 4305605 11.2 114 11.4 Secondary 687625 1.8 18 1.8 More than Secondary 1007325 2.6 27 2.7 Total Male 18796630 48.9 488 48.7 Female 18-34 Up to secondary 1567065 4.1 42 4.2 Secondary 1515310 3.9 39 3.9 More than Secondary 2028885 5.3 52 5.2 35-54 Up to secondary 3131405 8.1 84 8.4 Secondary 1619515 4.2 39 3.9 More than Secondary 2514960 6.5 66 6.6 65+ Up to secondary 5997410 15.6 157 15.7 Secondary 628210 1.6 17 1.7 More than Secondary 681965 1.8 18 1.8 Total FEMALE 19684725 51.2 514 51.3 Total population 38458355 Sample 1002 Recontacts wave 1 564
Fresh sample wave 2 438
Incumbent party/leader during fieldwork: PSOE/Pedro Sanchez
9.
The Quality of the Online Panel Data
To assess the quality of the online data, a number of tests were performed. Namely, we compare MAPLE Wave 2, an online nonprobability survey, to the “gold standard”, face-to-face probability surveys. For this purpose, we chose the European Social Survey (ESS) Round 8 from 2016 because it is widely considered as the highest quality survey in Europe, as well as the Eurobarometer (EB) from 2019, because it has been fielded in exactly the same time period as MAPLE (Spring 2019), and it also covers Greece, which the ESS 2016 does not.
Results
When it comes to socioeconomic benchmarks, we can see that MAPLE data is not generally less representative than the face-to-face surveys: To the contrary, in all countries the MAPLE Wave 2 sample is closer to the benchmarks for gender, age and education than the ESS and especially the EB. While MAPLE data slightly misses the benchmarks for education in Portugal, Ireland and most strongly in Greece, the two face-to-face surveys are even less representative. Generally, the ESS and the EB have similar problems as MAPLE with oversampling high education and undersampling low education. They also tend to oversample old and undersample young people, a problem which MAPLE does not have - if anything, MAPLE oversamples young people. Here we see the differences between face-to-face surveys, reaching older people more easily, and online surveys, reaching younger people more easily.
The results concerning political attitudes are similar: While MAPLE data does sometimes diverge substantially from the estimates in the ESS and EB, they are often similar, too: Left-right placement, religiosity, satisfaction with democracy and the opinion on leaving the EU and on EU integration are very comparable in most countries. The opinions on EU membership and influence in the EU differ more substantially, but this is very likely due to different scales and wording in the surveys.
Overall, the results imply that there are no strong differences in the conclusions one would draw when using face-to-face as compared to online survey data, which speaks to the quality of MAPLE Wave 2. Especially given the fact that also the two face-face-surveys (ESS and EB) have some substantial shortcomings, and even differ from each other, the MAPLE online survey data fulfils the standards of representativeness in comparison to established sampling methods. In a first step, we compare the raw unweighted data of the three surveys to population benchmarks – gender, age, and education – to see how representative the samples are. Next, we compare weighted data and look at the distributions of several political attitude variables that are measured in all three surveys (or at least two of them), to see if they differ.
10.
Comparing the survey samples with sociodemographic
benchmarks- figures
Notes: % of difference between sample means and population benchmarks, with 95% confidence intervals. Benchmarks (Census 2011) are set to 0, positive differences mean oversampling, negative differences mean undersampling. Estimates are based on raw (unweighted) data.
Figure 10.1. Belgium- Comparing MAPLEW2 on Socio-Demographic Variables
(% of difference between sample means and population benchmarks, with 95% confidence interval)
Figure 10.2. Germany- Comparing MAPLEW2 on Socio-Demographic Variables
(% of difference between sample means and population benchmarks, with 95% confidence interval)
Figure 10.3. Greece- Comparing MAPLEW2 on Socio-Demographic Variables
(% of difference between sample means and population benchmarks, with 95% confidence interval)
Figure 10.4. Ireland- Comparing MAPLEW2 on Socio-Demographic Variables
(% of difference between sample means and population benchmarks, with 95% confidence interval)
Figure 10.5. Portugal- Comparing MAPLEW2 on Socio-Demographic Variables
(% of difference between sample means and population benchmarks, with 95% confidence interval)
Figure 10.6. Spain- Comparing MAPLEW2 on Socio-Demographic Variables
(% of difference between sample means and population benchmarks, with 95% confidence interval)
11.
Comparing survey samples with sociodemographic
benchmarks: tables
Notes: Means and 95% confidence intervals are reported, based on raw (unweighted) data. Estimates in bold have confidence intervals that do not include the benchmarks. Benchmarks are from the 2011 census. MSE=mean standard error. All numbers are percentages.
Table 11.1 – Belgium: comparing MAPLEW2, ESS and EB
Variable Response MAPLE W2 ESS EB Benchmark
Gender Female 0.517 0.501 0.512 0.515 (0.486;0.547) (0.476;0.526) (0.480;0.543) Age 18-34 0.263 0.258 0.216 0.268 (0.236;0.291) (0.236;0.279) (0.190;0.242) 35-54 0.357 0.354 0.301 0.360 (0.328;0.387) (0.330;0.378) (0.272;0.330) 55+ 0.380 0.388 0.483 0.372 (0.350;0.410) (0.364;0.413) (0.452,0.514) Education up to secondary 0.393 0.246 0.080 0.390 (0.362;0.423) (0.225;0.267) (0.063;0.097) secondary 0.305 0.312 0.375 0.306 (0.277;0.334) (0.289;0.335) (0.344;0.405) more than secondary 0.302 0.434 0.442 0.304 (0.274;0.331) (0.409;0.458) (0.411;0.473) Average difference 0.032 0.003 0.106 MSE 0.000 0.005 0.020
Table 11.2 – Germany, comparing MAPLEW2, ESS and EB
Variable Response MAPLE W2 ESS EB Benchmark
Gender Female 0.519 0.472 0.493 0.518 (0.488;0.549) (0.453;0.491) (0.468;0.518) Age 18-34 0.228 0.218 0.173 0.240 (0.202;0.254) (0.202;0.234) (0.154;0.192) 35-54 0.366 0.342 0.276 0.362 (0.336;0.395) (0.324;0.362) (0.254;0.299) 55+ 0.406 0.440 0.551 0.398 (0.375;0.436) (0.421;0.459) (0.526;0.576) Education up to secondary 0.209 0.072 0.173 0.209 (0.184;0.234) (0.062;0.082) (0.154;0.192) secondary 0.480 0.435 0.502 0.478 (0.449;0.511) (0.416;0.454) (0.477;0.527) more than secondary 0.311 0.488 0.285 0.313 (0.281;0.339) (0.469;0.508) (0.263;0.308) Average difference 0.004 0.069 0.060
Table 11.3 – Greece, comparing MAPLEW2 and EB
Variable Response MAPLE W2 EB Benchmark
Gender Female 0.514 0.492 0.514 (0.482;0.544) (0.461;0.524) Age 18-34 0.267 0.163 0.270 (0.239;0.294) (0.14;0.186) 35-54 0.351 0.379 0.350 (0.321;0.380) (0.348;0.409) 55+ 0.382 0.458 0.380 (0.351;0.411) (0.427;0.489) Education up to secondary 0.336 0.260 0.429 (0.307;0.365) (0.232;0.287) secondary 0.344 0.340 0.312 (0.314;0.373) (0.311;0.37) more than secondary 0.319 0.352 0.259 (0.290;0.348) (0.323;0.382) Average difference 0.027 0.075 MSE 0.002 0.008
Table 11.4 – Ireland, comparing MAPLEW2, ESS and EB
Variable Response MAPLE ESS EB Benchmark
Gender Female 0.509 0.508 0.532 0.509 (0.478;0.539) (0.489;0.528) (0.502;0.562) Age 18-34 0.335 0.186 0.213 0.339 (0.305;0.364) (0.17;0.201 (0.189;0.237) 35-54 0.389 0.361 0.404 0.377 (0.358;0.418) (0.342;0.38 (0.374;0.433) 55+ 0.276 0.454 0.383 0.284 (0.248;0.304) (0.434;0.473 (0.354;0.412) Education up to secondary 0.244 0.316 0.169 0.320 (0.216;0.27) (0.298;0.335 (0.146;0.191) secondary 0.330 0.202 0.384 0.318 (0.300;0.359) (0.186;0.218 (0.355;0.413) more than secondary 0.426 0.478 0.381 0.361 (0.395;0.457) (0.458;0.497 (0.352;0.41) Average difference 0.025 0.082 0.073
Table 11.5 – Portugal, comparing MAPLEW2, ESS and EB
Variable Response MAPLE ESS EB Benchmark
Gender Female 0.528 0.577 0.559 0.530 (0.496;0.558) (0.55;0.605) (0.527;0.59) Age 18-34 0.255 0.185 0.187 0.259 (0.228;0.281) (0.163;0.207) (0.162;0.211) 35-54 0.360 0.319 0.339 0.357 (0.330;0.389) (0.292;0.345) (0.31;0.369) 55+ 0.385 0.496 0.474 0.384 (0.354,0.414) (0.468;0.524) (0.443;0.505) Education up to secondary 0.585 0.526 0.423 0.683 (0.554;0.614) (0.498;0.554) (0.392;0.454) secondary 0.203 0.200 0.311 0.163 (0.177;0.227) (0.177;0.222) (0.282;0.34) more than secondary 0.213 0.266 0.188 0.154 (0.187;0.237) (0.241;0.291) (0.163;0.212) Average difference 0.030 0.083 0.093
MSE 0.002 0.009 0.015
Table 11.6 – Spain, comparing MAPLEW2, ESS and EB
Variable Response MAPLE ESS EB Benchmark
Gender Female 0.513 0.502 0.547 0.512 (0.481;0.543) (0.479;0.525) (0.516;0.579) Age 18-34 0.264 0.200 0.210 0.241 (0.237;0.291) (0.182;0.219) (0.184;0.236) 35-54 0.385 0.381 0.334 0.384 (0.355;0.415) (0.359;0.403) (0.304;0.364) 55+ 0.350 0.419 0.456 0.345 (0.320;0.379) (0.396;0.441) (0.424;0.487) Education up to secondary 0.547 0.517 0.343 0.539 (0.516;0.577) (0.494;0.54) (0.313;0.373) secondary 0.190 0.149 0.291 0.199 (0.165;0.213) (0.133;0.165) (0.263;0.32) more than secondary 0.263 0.332 0.273 0.239
(0.236;0.290) (0.31;0.354) (0.244;0.301) Average difference 0.010 0.042 0.078 MSE 0.0002 0.003 0.009
12.
Comparing attitudes across survey samples: figures
Notes: Normalized sample means and 95% confidence intervals are reported, data is weighted with socio-demographic weights.Figure 12.1. Belgium- Comparing MAPLEW2 on Political Attitudes Variables
(Normalized sample means and 95% confidence intervals, data is weighted with socio-demographic weights)
Figure 12.2. Germany- Comparing MAPLEW2 on Political Attitudes Variables
(Normalized sample means and 95% confidence intervals, data is weighted with socio-demographic weights)
Figure 12.3. Greece- Comparing MAPLEW2 on Political Attitudes Variables
(Normalized sample means and 95% confidence intervals, data is weighted with socio-demographic weights)
Figure 12.4. Ireland- Comparing MAPLEW2 on Political Attitudes Variables
(Normalized sample means and 95% confidence intervals, data is weighted with socio-demographic weights)
Figure 12.5. Portugal- Comparing MAPLEW2 on Political Attitudes Variables
(Normalized sample means and 95% confidence intervals, data is weighted with socio-demographic weights)
Figure 12.6. Spain- Comparing MAPLEW2 on Political Attitudes Variables
(Normalized sample means and 95% confidence intervals, data is weighted with socio-demographic weights)
The last section of this report presents some results of the descriptive variables, as they relate to the key questions posed by MAPLE. The project focuses on the way in which the EU has been politicized in different countries and how these different frames are linked to different political attitudes and electoral behaviour. In order to study the way in which European may have become more relevant to domestic politics, it is crucial to start from the premise of the EU’s multidimensionality. The EU can be conceptualized in terms of constitutive issues – on the scope of policy, membership, and institutional design that Europe has been taking over the years. The EU has the potential to become more politicized to the extent that it combines several of these dimensions.
Our analysis of attitudes towards the EU seeks to tap these different dimensions of attitudes towards the EU, by considering in this report attitudes towards membership, institutional design and scope of policy. In what follows we briefly present some indicators which refer to each of the dimensions identified above.
13.
EU membership: Our Country Should leave the EU
According to our survey, on average, citizens tend to disagree that their country should leave the EU. Irish, Portuguese, Germans and Spanish are those most in disagreement with exiting the EU. Indeed, 63% of Irish citizens are against leaving the EU, followed by 62% of Portuguese. The country with lowest level of disagreement is Belgium. Therefore, this indicator concerning “membership” issues indicates large support for membership in the countries’ surveyed.
2.5 2.3 2.5 2.1 2.2 2.3 1.0 2.0 3.0 4.0 5.0
Belgium Germany Greece Ireland Portugal Spain
Strongly Agree Somewhat agree Neither agree nor disagree Somewhat disagree Strongly disagree
Source: MAPLE ONLINE SURVEY May-August 2019
"Our Country should leave the European Union" (Average per country)
14.
EU Institutional Framework: Satisfaction with
Democracy
Concerning satisfaction with democracy, we present in the graph above the average levels of satisfaction with European as well as national democracy. In all countries, the average satisfaction with the EU and national democracy relatively low. Indeed, the lowest level of satisfaction with democracy in the EU is Belgium, with only 20% say they are satisfied with democracy in the EU, whereas 40% of Irish respondents answered in the same way.
All other countries fall in between these two averages, which denotes relatively low levels of satisfaction in the countries surveyed. It is noteworthy that satisfaction with EU democracy is higher than national democracy, on average, in Greece, Portugal and Spain.
2.5 2.6 2.7 2.9 2.6 2.5 3.0 2.9 2.8 3.1 2.8 2.7 1.0 2.0 3.0 4.0 5.0
Belgium Germany Greece Ireland Portugal Spain
Extremely satisfied Somewhat satisfied Neither satisfied nor dissatisfied Somewhat dissatisfied Extremely dissatisfied
Source: MAPLE ONLINE SURVEY May-August 2019
"Satisfied with democracy" (Average per country)
15.
EU Framework: Trust in Parliament
Still on the issue of institutional framework, we consider trust in the European Parliament. Just after the 2019 European Parliament elections, we find that on average, trust in the EP is higher, on average, than in the respective national parliaments in Greece, Ireland, Portugal and Spain. Yet, like with satisfaction with democracy, levels of trust tend to be low both at the EP and national level. The highest level of trust occurs in Ireland (40% placing themselves between 6 and 10 on the scale above), with Greeks the least trustful (only 28% similarly placed on the scale above).
3.9 4.0 4.1 4.3 3.7 4.5 4.3 4.3 3.2 4.0 3.9 3.8 0.0 1.0 2.0 3.0 4.0 5.0 6.0 7.0 8.0 9.0 10.0
Belgium Germany Greece Ireland Portugal Spain
Complete trust
No trust at all
Source: MAPLE ONLINE SURVEY May-August 2019
"Trust in Parliament" (Average per country)
16.
EU Institutional Framework: EU Should move forward
to the United States of Europe
When confronted with two alternative scenarios, one positing a future united states of Europe, another the dissolution of the EU, all countries’ respondents tend on average to place themselves on the “more integration” side of the spectrum. Spain and Germany are the countries where on average, most respondents agree with moving forward to a scenario of an “United States of Europe”, 57% and 54% respectively. 5.2 5.6 5.4 5.0 5.4 5.8 0.0 1.0 2.0 3.0 4.0 5.0 6.0 7.0 8.0 9.0 10.0
Belgium Germany Greece Ireland Portugal Spain
The EU should move towards the United States of Europe The UE should be dissolved
Source: MAPLE ONLINE SURVEY May-August 2019
"EU should move forward to United States of Europe" (Average per country)
17.
EU Policies: Satisfied with EU Policies
We turn now to the analysis of attitudes towards EU policies. We find that on average, citizens’ level of satisfaction with policies is relatively low. A substantial number of citizens place themselves in the middle category. Those who actually state that they are satisfied (either somewhat or extremely satisfied) range from only 11% in Greece to 33% in Ireland.
2.4 2.6 2.4 2.9 2.7 2.6 1.0 2.0 3.0 4.0 5.0
Belgium Germany Greece Ireland Portugal Spain
Extremely satisfied Somewhat satisfied Neither satisfied nor dissatisfied Somewhat dissatisfied Extremely dissatisfied
Source: MAPLE ONLINE SURVEY May-August 2019
"Satisfied with EU policies" (Average per country)
18.
EU Policies: Most Important Policy Carried out by the
EU?
The graph above makes clear that the citizens differ in which is the most important policy carried out by the EU. In Belgium and Germany, the most important policy is migration. In Greece, Portugal and Spain, it is economic and monetary union, whereas in Ireland it is the free movement of citizens. In the case of Germany and Belgium, despite the higher prominence of Migration issues, economic and monetary union was, nonetheless, perceived as the second most salient issue.
26% 34% 20% 17% 19% 23% 0% 5% 10% 15% 20% 25% 30% 35% 40%
Source: MAPLE ONLINE SURVEY May-August 2019
In your opinion, which is the most important policy currently carried out by the European Union? (% for top answer)
Belgium / Migration Policy Germany / Migration Policy
Greece / Economic and monetary union Ireland / Free movement of citizens Portugal / Economic and monetary union Spain / Economic and monetary union
19.
EU Policies: Institution Responsible for national
economic situation
Given the increasing supranationalisation of economic and monetary policy since the launch of the euro, the survey enquired about perceptions of responsibility of different institutions for the national economic situations. We can see that in all cases, the national government is considered more responsible than the European Union. Germany and Greece stand out as the two countries where citizens consider the EU, on average, is more responsible. Indeed, in both countries 60% of citizens consider the EU responsible, to some degree, for domestic economic policy.
3.3 3.9 3.6 3.7 3.2 3.4 3.4 4.3 4.3 4.0 4.1 4.1 1.0 2.0 3.0 4.0 5.0
Belgium Germany Greece Ireland Portugal Spain
Extremely responsible Very responsible Fairly responsible Not very responsible Not responsible at all
Source: MAPLE ONLINE SURVEY May-August 2019
"Institution responsible for national economic situation" (Average per country)
20.
EU Policies: EU Policies are determined by its citizens
When asked to place themselves on a scale of “1” to “5”, where one means that EU policies are largely determined by non-elected bureaucrats, and “5” that they are decided by representatives of the citizens, on average, citizens place themselves closer to the “non-elected” bureaucrats pole. The percentage of respondents that place themselves on the “non-elected bureaucrats” side ranges from 32%, in the case of Spain, to 44% in Greece. Greece is the country in our sample where the largest minority tend to agree that policies are largely determined by non-elected bureaucrats. 2.5 2.5 2.4 2.6 2.6 2.7 1.0 2.0 3.0 4.0 5.0
Belgium Germany Greece Ireland Portugal Spain
EU policies are largely determined by representatives of the citizens EU policies are largely determined by non-elected bureaucrats
Source: MAPLE ONLINE SURVEY May-August 2019
"EU policies are determined by representatives of the citizens" (Average per country)
21.
EU Policies: My country has a lot of influence on EU
policies?
Lastly, and still on the topic of EU policies, citizens were asked to state the degree of influence thei country had on EU policies. They had to place themselves on a scale of “1” to “5”, where “1” meant that “my country has no influence at all on EU policies”, and “5” meant that “my country has a lot of influence on EU policies”. We can see interesting differences between countries. Namely, Germans on average are more likely to believe their country has influence in EU policies, whereas Greeks on average tend to believe the opposite. All other countries are on average closer to Greece than Germany in this respect. Indeed, 57% of Greeks placed themselves either on values “1” or “2” of the scale above, whereas in Germany, only 14% of respondents chose those same values on the scale.
2.4 3.3 2.3 2.7 2.5 2.7 1.0 2.0 3.0 4.0 5.0
Belgium Germany Greece Ireland Portugal Spain
My country has a lot of influence on EU policies My country has no influence at all on EU policies
Source: MAPLE ONLINE SURVEY May-August 2019
"My country has a lot of influence on EU policies" (Average per country)
Appendix 1- Media Sections which were excluded from the analysis
Belgium:De Standaard – Cultuur, Sport, Life&Style, Beroemd&Bizar, meer (except for "Columns") Le Soir – Sports, Culture
Germany:
SZ – Sport, München, Bayern, Kultur, Digital, Karriere, Reise, Auto, Stil, mehr FAZ – SPORT, STIL, RHEIN-MAIN, WISSEN, REISE, KARRIERE
Greece:
Ta Nea – sports, lifearts, health, woman, kid, autonea, skitsa, infographics, media
Kathimerini – aytokinhsh, k-blogs, gastrónomos, ta3idia, multimédia, vídeo, photo,
periodiko-k, politismos, culture, disney-magazines, me-tin-k, womans-must, a8lhtismos
Ireland:
The Irish Independent – SPORT, LIFE, STYLE, ENTERTAINMENT, TRAVEL, VIDEO,
PODCASTS
The Irish Times – SPORT, BUSINESS, LIFE & STYLE, CULTURE, MORE Portugal:
Publico – LOCAL, CULTURA, DESPORTO, CIÊNCIA, TECNOLOGIA DN – Cidades, Cultura, Desportos, Ócio, Life, Edição do dia
Spain:
El Pais – CIENCIA, TECNOLOGÍA, CULTURA, GENTE, DEPORTES, TELEVISIÓN,
VÍDEO
Appendix 2- List of Words used to Code for EU Salience
Words
Eurozone European Union European Parliament European Council European CommissionCouncil of the European Union European Central Bank
European Investment Bank European Stability Mechanism European Financial Stability Facility
European Financial Stabilisation Mechanism European Constitution
Court of Justice of the European Union European Court of Justice
European Court of Auditors
The European External Action Service European Economic and Social Committee The European Investment Fund
European Ombudsman
European Data Protection Supervisor
Economic and Monetary Union of the European Union European common (European)(Policy|Policies) (European) (Policy|Policies) European Elections EP elections EU elections European Integration Troika FRONTEX Constitutional Treatry Treaty of Lisbon Lisbon Treaty Eurogroup Common Market
European Economic Community Single Market
MAPLE is funded by the European Research Council (ERC) under the European Union’s Horizon 2020 research and innovation programme (Grant Agreement nº682125) and is hosted at the Institute for Social Sciences (ICS), University of Lisbon