Universidade do Minho
Escola de EngenhariaRui Alexandre Afonso Pereira
This work is funded by the ERDF through the Programme COMPETE and by the Portuguese Government through FCT - Foundation for Science and Technology, within projects: 0124-FEDER-010048, 0124-FEDER-020532, FCOMP-01-0124-FEDER-022701, and grant ref. BI2-2012 PTDC/EIA-CCO/108613/2008.
Universidade do Minho
Dissertação de Mestrado Escola de Engenharia
Departamento de Informática
Rui Alexandre Afonso Pereira
Querying for Model-Driven Spreadsheets
Mestrado em Engenharia Informática Trabalho realizado sob orientação de Professor Doutor João Saraiva! Professor Doutor Orlando Belo
Acknowledgements
To begin, I want to thank both of my supervisors, Prof. Jo˜ao Saraiva and Prof. Orlando Belo, due to their knowledge, dedication, experience, professionalism and ability to easily communicate with me, led me on an amazing path during this thesis, which helped me greatly. And especially to Prof. Jo˜ao Saraiva for motivating me tremendously and pushing me further than I expected I could go, giving me great opportunities to take advantage of.
I would also like to further thank J´acome Cunha, who was like another supervisor to me, always being available when I needed him, helping me very much during this thesis, even if he had no obligation to, and putting up with me annoying him constantly. I would also like to thank Jo˜ao Paulo Fernandes for the helpful and insightful comments during the first stage of my thesis.
To my laboratory buddies, Claudio, Jorge, Tiago, and both Pedros, who put up with my antics on a regular basis and kept me in check, and also for the great and unforgettable moments passed in Romania.
To my friends, from the first year of university up until now, who put up with me, and always helped and supported me along the way. All the good and unforgettable moments, to the idiotic things we pulled on each other, ultimately not allowing me to go insane this year! I would also like to give a special mention to Bernardo, Paulo, and Rui, who followed me closely during the completion of my thesis, giving me good pointers and helpful comments. And finally, I would like to thank my parents for their endless support in all my decisions in life, and for opening the doors to allow me to get where I am now. Even with the countless struggles and problems, you always believed in me, and believed in where I could get in life. Thank you so much.
Abstract
Querying for Model-Driven Spreadsheets
Spreadsheets are used for a diverse number of objectives, that range from simple
applica-tions to complete information systems. In all of these cases, they are frequently used as data repositories that can grow tremendously in size, and as the amount of the data grows, the
frustration and challenge to withdraw information out of them also grows.
This Thesis project focuses on the problem of spreadsheet querying. Specifically, the
objective is to meticulously and carefully study competing query languages, and propos-ing our very own expressive and composable query language to be used in spreadsheets,
where intuitive queries can be defined. This approach builds on a model-driven spreadsheet development environment, and queries are expressed referencing ClassSheet model entities
instead of the actual data. Furthermore, this language shall be integrated into the MDSheet framework, taking into account evolution mechanisms, auto-generation of models for query
Resumo
Interroga¸c˜ao de Folhas de C´alculo Dirigidas por Modelos
As folhas de c´alculo s˜ao utilizadas para diversos fins, desde aplica¸c˜oes simples at´e
sis-temas de informa¸c˜ao completos. Entre todos estes casos, s˜ao frequentemente utilizadas para armazenar grandes volumes de dados, sendo que, `a medida que o reposit´orio cresce, a
frusta¸c˜ao e o desafio de recolher informa¸c˜ao tamb´em aumenta. O projeto desta disserta¸c˜ao foca-se no problema da consulta e interroga¸c˜ao de folhas de c´alculo. Especificamente, o
objetivo ´e estudar de forma cuidada e meticulosa diversas linguagens de interroga¸c˜ao exist-entes, e propˆor a nossa pr´opria linguagem para ser utilizada em folhas de c´alculo, que se
caracteriza por ser uma linguagem expressiva, que possibilita a composi¸c˜ao de interroga¸c˜oes e a defini¸c˜ao das mesmas de forma intuitiva.
A abordagem a utilizar passa pela utiliza¸c˜ao de folhas de c´alculo dirigidas por modelos, sendo as interroga¸c˜oes expressas atrav´es de entidades do modelo ClassSheet em vez de dados
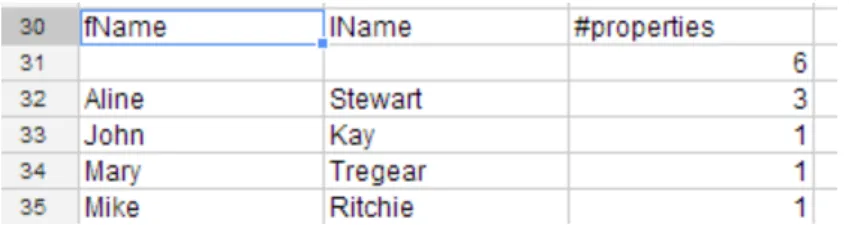
em concreto. Al´em disto, a linguagem desenvolvida ser´a integrada no framework MDSheet, considerando diversos mecanismos de evolu¸c˜ao, gera¸c˜ao autom´atica de modelos para os
res-ultados de uma interroga¸c˜ao, e ser´a baseada na fun¸c˜ao QUERY desenvolvida pela Google para a interroga¸c˜ao de folhas de c´alculo.
Contents
Contents
1 Introduction 1
1.1 Motivation . . . 1
1.2 Research Questions . . . 2
1.3 Structure of the Thesis . . . 2
2 Spreadsheet Engineering 5 2.1 Spreadsheets and Queries . . . 7
2.1.1 MS-Query Tool . . . 7
2.1.2 Google QUERY Function . . . 11
3 Model-Driven Spreadsheet Engineering 15 3.1 Models in Spreadsheets . . . 16
3.2 Model-Driven Spreadsheet Evolution . . . 17
3.3 MDSheet . . . 18
3.3.1 Embedding and Bidirectionality . . . 18
3.3.2 Architecture . . . 20
4 Querying Model-Driven Spreadsheets 23 4.1 Querying Model-Driven Spreadsheets: An Example . . . 23
5 MDQL: Design and Implementation 31 5.1 Model-Driven Query Language . . . 31
5.2 Denormalization of Spreadsheet Data . . . 34
5.2.1 Denormalization of Spreadsheet Data: Querying Problems . . . 35
5.3 Translation to Google Query . . . 39
5.4 Google Spreadsheets . . . 40
5.5 ClassSheet Inference . . . 41
5.6 Integration with MDSheet and OpenOffice . . . 41
Contents
7 Empirical Evaluation 47
8 Conclusion 51
8.1 Research Questions Answered . . . 51 8.2 Results . . . 53
Contents
Acronyms
GQF Google QUERY Function
MDE Model-Driven Engineering
MDQL Model-Driven Query Language
OLAP Online Analytical Processing
RDBMS Relational Database Management System
SQL Structured Query Language
List of Figures
List of Figures
1 ViTSL editor . . . 6
2 Invoking MS-Query . . . 7
3 MS-Query Column window . . . 8
4 MS-Query Filter Data window . . . 8
5 MS-Query Sort Order Window . . . 9
6 Property Renting Example . . . 10
7 Property Renting Example (Denormalized) . . . 11
8 Google QUERY function used in the Property Renting Example (Denormalized) 12 9 Google QUERY function results from the Property Renting Example (Denor-malized) . . . 13
10 Spreadsheet data for a Budget example . . . 15
11 ClassSheet model for a Budget example . . . 16
12 Spreadsheet model and example in conformity . . . 17
13 Budget Model after adding a new column . . . 18
14 Budget Model after removing a row . . . 18
15 Model on the first worksheet of a spreadsheet . . . 19
16 Data on the second worksheet of a spreadsheet . . . 19
17 Bidirectional evolution diagram . . . 20
18 MDSheet Architecture . . . 20
19 MDSheet Button Interface . . . 21
20 ClassSheet Model for a flight spreadsheet . . . 23
21 Flight spreadsheet data . . . 24
22 Flight spreadsheet data in denormalized state . . . 26
23 ClassSheet Model for a flight spreadsheet after Airline name attribute inserted 27 24 Flight spreadsheet data after Airline name attribute inserted . . . 28
25 Flight spreadsheet data in denormalized state after Airline name attribute inserted . . . 28
List of Figures
27 Modified spreadsheet flight example to show some possible query problems . 36
28 Model automatically inferred from the spreadsheet data shown in Table 2 . . 41 29 JNI connecting C/C++ with Java . . . 42
30 A model-driven spreadsheet representing orders, clients and products . . . . 43 31 The architecture of QuerySheet . . . 44
32 The model-driven spreadsheet produced after executing the first query . . . 45 33 The spreadsheet (data) result after executing the second query . . . 45
34 A model-driven spreadsheet representing institutions, products, and distribu-tions, used in the empirical evaluation . . . 47
List of Tables
List of Tables
1 Results for Query1 . . . 25
2 Results for Query2 . . . 25
3 Modified spreadsheet denormalized . . . 36
Listings
Listings
1 Model-driven query for Query1 . . . 25
2 Model-driven query for Query2 . . . 25
3 Google QUERY function for Query1 . . . 27
4 Google QUERY function for Query2 . . . 27
5 Rewritten Google QUERY function for Query1 . . . 29
6 Rewritten Google QUERY function for Query2 . . . 29
7 Part of the model-driven query language syntax . . . 33
8 How many hours has each Airline flown? . . . 37
9 How many hours have all the planes flown? . . . 37
10 How many hours has each Airline flown? . . . 39
1 INTRODUCTION
1 Introduction
1.1 Motivation
Nowadays, spreadsheets can be considered the most popular programming system around, particularly in the field of business applications. With their availability on any
comput-ing device (PC, smart-phone, etc.) and in the cloud, visual simplicity, low learncomput-ing curve for new users, and flexibility when it comes to what can be written in a spreadsheet, the
amount of users per year increases drastically. Although spreadsheets begin as a simple, single-user software artifact, they may evolve into a large and complex data-centric software
[Chambers and Scaffidi, 2010].
But while estimates of tens of millions of business workers create hundreds of millions of
spreadsheets per year [Engels and Erwig, 2005], advances in this domain fall off compared to advances made in other programming languages. Also with the exception of a few, not much
software engineering work has been made on spreadsheets. For example, Ireson-Paine cre-ated an object-oriented textual language to specify spreadsheet models, dubbed Model
Mas-ter [Ireson-Paine, 1997]. Following Ireson-Paine’s work, came ViTSL [Abraham et al., 2005],
which eventually set the foundation for the creation of ClassSheets [Engels and Erwig, 2005],
a high-level object-oriented model for spreadsheets. Even with this work, since spreadsheets are used in many cases as a way to store information, much like the traditional databases
sys-tems such as Oracle Database1, MySQL2, and SQL Server3, manipulating a large amount of data in a traditional matrix structure becomes an arduous task. This issue arises in
spread-sheets, unlike the traditional database systems, due to one huge flaw: the absence of a data query language.
Attempts have been made to try to replicate traditional querying systems, such as MS-Query (Microsoft) and the QUERY function (Google), but in doing so, many restrictions
regarding how data must be stored and organized are imposed. Also, much like a database administrator or analyst would look at the relational model of a database to construct
quer-1Oracle Database: http://www.oracle.com/index.html 2MySQL: http://www.mysql.com/
1 INTRODUCTION
ies, and not the data itself, we too would benefit from a model reflecting our spreadsheet
data to easily construct our spreadsheet queries. Additionally with the growing usage of Model-Driven spreadsheets, which have been proven to improve productivity with
empir-ical studies [Beckwith et al., 2011a], also lacking ways to query the data, querying in this environment is becoming much sought after.
1.2 Research Questions
Three important questions arose during my Thesis work, relative to the design and implementation of a Model-Driven Query Language, and users’ productivity using it:
1. Would it be possible to create a query language for use on spreadsheet models which can
be translated into Google’s QUERY function language?
2. If using Google’s QUERY function, what extra work and implementation must be done to
correctly query a model-driven spreadsheet?
3. How efficient and productive is querying Model-Driven spreadsheets, when compared to
directly querying spreadsheet data (e.g. MS-Query or Google’s QUERY function)?
By the time I conclude my Thesis, I plan to easily answer all of these questions, acknow-ledging that to answer the last question, an empirical study must be executed.
1.3 Structure of the Thesis
This Thesis is organized as follows:
Section 2 - Spreadsheet Engineering - contains the State of the Art, with information
on previous spreadsheet engineering work and two tools created to query spreadsheets.
Section 3 - Model-Driven Spreadsheet Engineering - contains examples of spreadsheet
models along with the description of ClassSheet models. This section also presents spreadsheet evolution techniques using ClassSheet models.
1 INTRODUCTION
Section 4 - Querying Model-Driven Spreadsheets - presents how we envision a simple
SQL-like query language where users can easily construct queries right in their spread-sheet environment using ClassSheet models. This is explained using an example of a
possible real-life scenario.
Section 5 - MDQL: Design and Implementation - contains information regarding the
design and implementation of the Query Language, and the process from creating the language, to retrieval of data from the Google QUERY function.
Section 6 - QuerySheet - describes and showcases the prototype tool developed, dubbed QuerySheet, which implements all the techniques presented in Section 5
Section 8 - Conclusion - concludes this Thesis with comments on the work done, results, and future work, along with answers to our Research Questions.
2 SPREADSHEET ENGINEERING
2 Spreadsheet Engineering
Spreadsheets can be considered the most popular programming environment around, widely used by non-professional programmers, particularly in the field of business
applica-tions. This can be due to the immense flexibility, learnability, portability, and simplicity for the end-users, allowing them to easily jump right into this powerful tool.
But this liberty and elbowroom, however, does come with the high price of indu-cing end-users to accidentally and unknowingly fill their spreadsheets with errors, which
could lead up to thousands of dollars in damage such as the Colorado Student Loan Pro-gram incident, where a type error caused an operating fund to be understated by $36,131 [US Department of Education, 2003]. Various studies also show that up to 90% of spread-sheets contain errors [Panko, 2008]. Huge company losses and social problems caused by
erroneous spreadsheets are documented in the Spreadsheets Horror Stories web-page4. To overcome these constant problems in spreadsheets, the spreadsheet community
de-cided to apply Model-Driven Engineering methodologies to spreadsheets. Model-Driven Engineering is a development methodology in Software Development that uses and exploits
domain models, or abstract representations of a piece of software [Schmidt, 2006]. By using this methodology, engineers can impose constraints and detect and prevent errors in the
early stages of software development by performing model checking.
Even then, spreadsheet modeling had already been proposed by various researchers, such
as the early work by Ireson-Paine who, as early as 1997, introduced a compiler and object-oriented textual language to specify spreadsheets called Model Master [Ireson-Paine, 1997].
Later in 2005, Abraham, Erwig, Kollmansberger, and Seifert familiarized us with a visual specification language, quite similar to spreadsheets called ViTSL [Abraham et al., 2005],
as shown in 1 (taken from [Abraham et al., 2005]).
Soon after, Engels and Erwig introduced ClassSheets as a high-level and object-oriented
formalism to specify the business logic of spreadsheets [Bals et al., 2007]; allowing end-users to express object structures within their actual spreadsheets, using Unified Modeling
Language, or UML, fundamentals. This gave end-users the possibility of characterizing
2 SPREADSHEET ENGINEERING
Figure 1: ViTSL editor
their spreadsheets, giving the latter names, column labels, value constraints, and expansion direction (i.e. horizontally or vertically). Indeed, empirical studies show that
ClassSheet-driven spreadsheet development does improve the productivity of spreadsheet programming [Beckwith et al., 2011b] [Mendes, 2012]. Without models such as these, an end-user’s
exper-ience can be negatively affected when facing the challenges of understanding their require-ments as well as making decisions about design, and other activities [Ko et al., 2011] which
can be done in spreadsheets.
For these reasons and others (including further research based on ClassSheets such as
MDSheet [Cunha et al., 2012d]), I will be using ClassSheets for the work done during my Thesis, taking advantage of the specification of object structures in spreadsheets.
To further take advantage of models/diagrams, research has been made to automatic-ally infer ClassSheet models or other class diagrams from spreadsheets [Cunha et al., 2010]
[Hermans et al., 2010], allowing the end-users to easily obtain model representations for their spreadsheets. Eventually, Cunha et al. began to work on allowing one to edit a spreadsheet
instance based on the relational model inferred [Cunha et al., 2012e] [Cunha et al., 2009], as-sisting the user in editing the spreadsheet, offering features such as auto-completion, guarded
deletion and controlled insertion, to help avoid redundancy, loss, or corruption of data dur-ing the edit actions.
But even up till later works such as Hermans et al.’s Gyro [Hermans et al., 2010], and Cunha’s HaExcel framework derived from his work [Cunha, 2011], there was no
2 SPREADSHEET ENGINEERING
Query Language for Model-Driven Spreadsheets, originating the foundation and reason of
my Thesis.
2.1 Spreadsheets and Queries
There have been attempts to query standard spreadsheets, using some form of SQL, or
Structured Query Language, a special-purpose language for accessing and managing data in relational database management systems (RDBMS). While SQL is specifically for RDBMS,
the general idea behind it can be applied to spreadsheets in a tabular format, allowing the user to specify what attributes he/she would like to know, and apply his or her filters to
the same query he/she would like to invoke. The following section will present two of the principal tools used to try to mimic the general idea of SQL for RDBMS, but this time for
spreadsheets, each with their own benefits and disadvantages.
2.1.1 MS-Query Tool
One of these principal tools is Microsoft’s Query tool, or MS-Query. MS-Query is a database query interfaced used by Microsoft Word and Excel, a utility which imports
data-bases, text files, OLAP cubes and other spreadsheet representations (such as csv) into Excel. Figure 2 shows how one would invoke MS-Query from Excel.
2 SPREADSHEET ENGINEERING
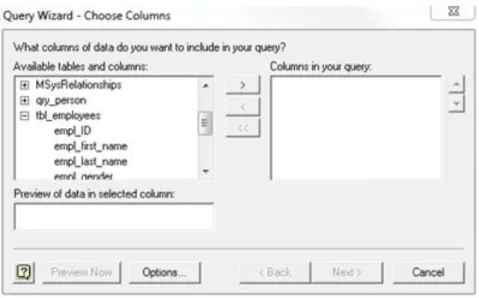
After selecting the data source, a query builder wizard appears to begin constructing
a query, starting with the table and column selection as shown in the following image. As one may notice, MS-Query uses a visual query building approach, which helps users not
experienced in constructing/writing SQL statements.
Figure 3: MS-Query Column window
After selecting the table and columns (Figure 3), the user is presented a filter data
window, where he/she can include filters for each of the columns previously selected, or in other words, construct the WHERE clause in SQL, shown in Figure 4.
2 SPREADSHEET ENGINEERING
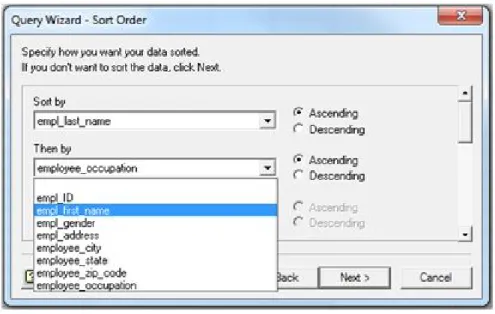
Figure 5: MS-Query Sort Order Window
To finish the query building, you may choose, if needed, the Sort Order of the query
(Figure 5), and after if you wish to return the data to an Excel spreadsheet or view the data
in MS-Query.
While MS-Query is mostly used to analyze OLAP cubes, represent a database or
data-base table in Excel, or show the results of a SQL query done on a datadata-base, it can be used to query data from another spreadsheet, placing the data into an intermediate database table
to be able to apply the query, and represent the findings, but with some restrictions. To be able to query your spreadsheet data, the data itself must be in a table format, with
the headers having the column names. In most cases, users tend to use their spreadsheet for more than one entity in a single worksheet, not joining all the information into one single
2 SPREADSHEET ENGINEERING
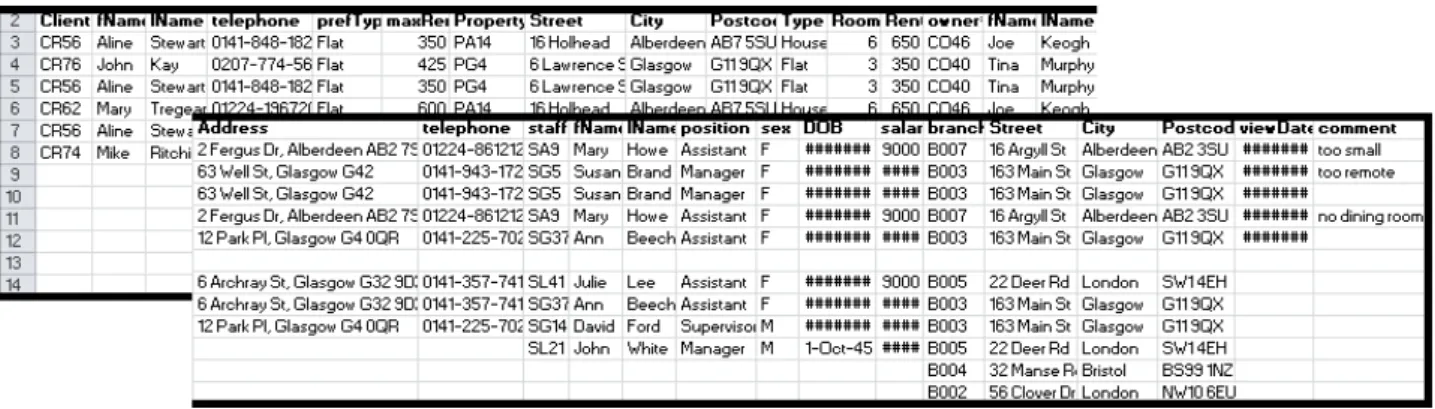
Figure 6: Property Renting Example
We can see how the data is not in one single table, nor are the headers represented in a single row (Figure 6).
Also, the worksheet contains various entities, each with their own attributes and rela-tionships between each other. Notice how the Staff entity contains a branch# code, which
relates it to the Branch entity, making the data normalized in a sense, prohibiting the complete freedom to represent the spreadsheet data how a user wishes.
2 SPREADSHEET ENGINEERING
Figure 7: Property Renting Example (Denormalized)
Figure 7 shows the necessary representation of our data, from the spreadsheet example
in Figure 6, in a completely denormalized state, and having the headers of each attribute explicitly represented in a single row, so we may be able to query the data using the
MS-Query tool.
As you may notice, the representation of the data in this way is much harder for someone
to read, manage, and analyze, and with a real-life spreadsheet data source, the number of columns might reach the hundreds.
Along with the previous mentioned problems, a user may also not expand his information horizontally, but only vertically, to conform to the table format needed to query, allowing
even much less freedom to represent their data.
2.1.2 Google QUERY Function
The other tool is Google’s QUERY function which allows users, using a SQL-like syntax,
to perform a query over an array of values, for example their Google Docs spreadsheets, where the function is built-in.
2 SPREADSHEET ENGINEERING
It is a two part query, consisting of a Range input, to state the range of cells for example
A1:B6. The second part consists of the actual Query String, using the subset of the SQL language, using column letters instead of column names. The QUERY’s input also assumes
the first zero or more rows as headers, and each column of the input can only hold values of the following types:
Boolean - Boolean literals either True or False
Number - Numeric literals specified in decimal notation
String - String literals enclosed in either single or double quotes
Date - Using keyword date followed by a string (ex: date ”2013-05-02”)
Datetime - A date and a time, using keyword datetime followed by a string (ex:date time ’2013-05-02 11:31:34.123’)
Timeofday - Using keyword timeofday followed by a string in literal fromat HH:mm:ss (ex: timeofday ’11:31:45’)
Figure 8: Google QUERY function used in the Property Renting Example (Denormalized)
The user, using the Google QUERY function, shown in Figure 8, can actually write his query in the same worksheet as his data. This allows on-the-spot results (Figure 9), with no
pre-configurations needed. The query engine is also very potent, as with any Google made query engine.
While being a powerful query function created by Google, it still has its flaws. The QUERY function shares the same problems as MS-Query in regards to the data representation. Much
like MS-Query, to run the Query function, the data needs to be represented with a single header row, without relationships between entities, in other words, also denormalized (as
2 SPREADSHEET ENGINEERING
Figure 9: Google QUERY function results from the Property Renting Example (Denormalized)
QUERY function has another flaw, the actual SQL-like query. Instead of writing the query using column names, one must use the column letters (as shown in Figure 8) to write his
or her query. Even with the small sized example we have been using, column letters and not names can get confusing, counter-intuitive, and almost impossible to understand what
the query is supposed to do, without having the data sheet alongside you. Even then, if we introduced a spreadsheet with over one-hundred columns, we would need to spend quite
some significant time. Moreover, Google queries do not fully and truly support evolution since they do not adapt/evolve when the spreadsheet data evolves. That is to say, by adding
a column to the spreadsheet we may turn a query invalid or incorrect because data changed places in the spreadsheet.
Even though each has their own advantages, such as the query builder wizard of MS-Query, or the extremely fast Google query engine for the QUERY function, improvements
can be made, mainly in making the actual SQL-like language the QUERY function uses more user-friendly and understandable, and allowing users to express their spreadsheet data
with much more freedom, without having to conform to the format needed by these two spreadsheet query alternatives.
So while attempts of querying standard spreadsheets have been made, there hasn’t been work done on querying data specifically for Model-Driven spreadsheets, an environment
proven to facilitate and improve productivity for users. Having such a functionality added to a Model-Driven environment would further improve it, allowing users to finally, easily,
3 MODEL-DRIVEN SPREADSHEET ENGINEERING
3 Model-Driven Spreadsheet Engineering
Model-Driven Engineering (MDE) is a solution to the handling of complex and evolving software system [B´ezivin, 2005], something which could and has been applied to
spread-sheets, making model-driven spreadsheets possible. As mentioned in the previous section (Section 2), there has been work done on creating a bridge between real-world representations
and spreadsheet data, in other words, spreadsheet models. The following subsections will further explain models in spreadsheets, more specifically ClassSheets, along with how
evol-ution affects these models, and introduce a model-driven spreadsheet environment, named MDSheet [Cunha et al., 2012d] [Mendes, 2012], which was used during this thesis.
Figure 10: Spreadsheet data for a Budget example
Above in Figure 10 we have a spreadsheet used to store information about the budget
of a company. This spreadsheet contains information about the Category of budget use (such as Travel or Accommodation) and the Year. The relationship between these two gives
information on the Quantity, the Cost and the Total Costs. Spreadsheets use layouts to structure its data, making it easier to understand and perform computations on it. In this
case, each new year adds three new columns in the spreadsheet. This, the spreadsheet data grows horizontally. New types of expenses in Category can also be added, by adding new
rows to the spreadsheet data, growing the spreadsheet vertically. This spreadsheet also has information on the sum of total costs per Year and per Category. Also, for each new Year
or Category, the formulas for the Total values need to be updated, or manually written. This spreadsheet will be used as a running example for the following subsections to describe
3 MODEL-DRIVEN SPREADSHEET ENGINEERING
3.1 Models in Spreadsheets
Overtime, our example spreadsheet can grow tremendously, becoming much more
plex than what is currently shown. As a result of spreadsheets being able to evolve into com-plex software systems, Engels and Erwig introduced ClassSheets [Engels and Erwig, 2005]
as a way to express business logic spreadsheet data as a model formalism. ClassSheets are a high-level and object-oriented formalism using the notion of classes and attributes. This
formalism offers a model-driven software development approach to spreadsheets.
There-fore, we can define the business logic of the spreadsheet in a concise and abstract formalism. This results in users being able to understand, evolve and maintain complex spreadsheets by
just analyzing the (ClassSheet) models, avoiding the need to look at large and complex data.
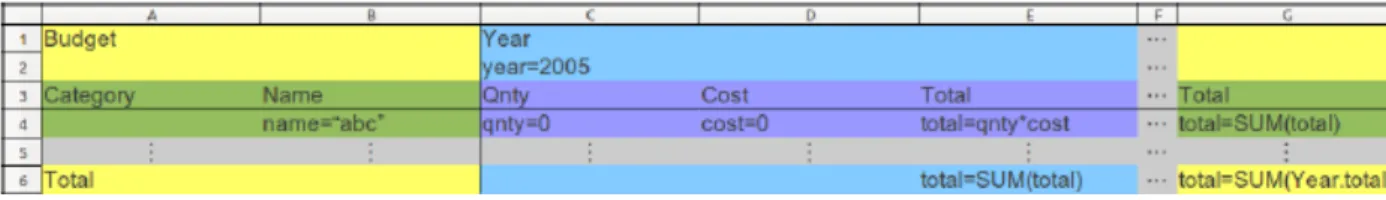
Figure 11: ClassSheet model for a Budget example
To showcase ClassSheets, we have a ClassSheet model for the Budget example shown in
Figure 10. In this ClassSheet model (Figure 11 (taken from [Mendes, 2012])), a Budget has a Category and Year class, expanding vertically and horizontally, respectively. The
joining of these gives us a Quantity, a Cost and Total of a Category in a given Year, each with its own default value. The Total in column G gives us the total of each Category
3 MODEL-DRIVEN SPREADSHEET ENGINEERING
Figure 12: Spreadsheet model and example in conformity
This ClassSheet model specifies the business logic of the budget spreadsheet data. In
model-driven engineering we would say that the spreadsheet data (Figure 10) conforms to the model (Figure 11), as shown in Figure 12.
3.2 Model-Driven Spreadsheet Evolution
Software evolution [Mens and Demeyer, 2008] is a term which defines the process of
changing an existing software system or program, due to needs, rules, and other factors, is updated, or in other words evolves, to continue to be useful in its environment. Factors such
as new requirements which emerged while using the software, business environment changes, bugs and errors, new and better performing computers and equipment, or even simply just
wanting something changed for no reason.
Spreadsheets over time tend to evolve and change too, just like software programs and
systems. Users may need to add new columns they previously did not have due to new laws, new business requirements, new information, or because the previous spreadsheet was
incorrectly constructed. Not only can it evolve due to new columns, but new data, or rows, can be inserted, columns removed, or even the whole spreadsheet can be changed to represent
the information previously contained, in a different way.
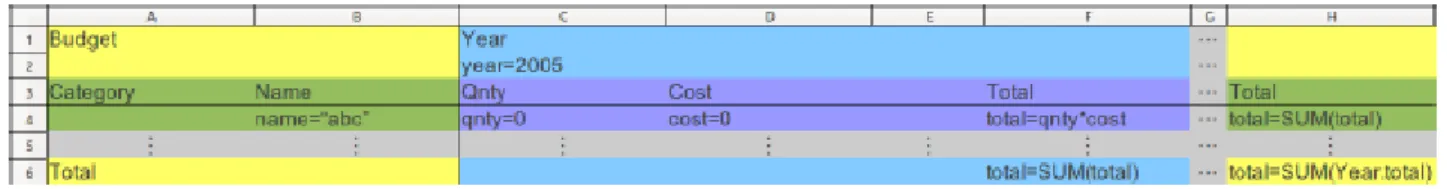
For example, using the original model from Figure 11, we can add a new column after
column D resulting in Figure 13 (taken from [Mendes, 2012]). We may also decide to remove a row, in this case row 2, from the original model, giving us Figure 14 (taken from
3 MODEL-DRIVEN SPREADSHEET ENGINEERING
Figure 13: Budget Model after adding a new column
Figure 14: Budget Model after removing a row
Many more operations can be made on the model to allow it to evolve to the user’s
spe-cifications and need, conforming the data to the model. The same can be done to the data, which in turn would affect the model due to bidirectional transformation [Cunha et al., 2012c].
3.3 MDSheet
MDSheet [Cunha et al., 2012d] is a framework and model-driven spreadsheet environ-ment, developed by Cunha et al., which permits the previous two model-driven spreadsheet
engineering points (models and evolution of spreadsheets), while also allowing embedding of model and instance, model inference and bidirectional transformations between models and
instances, all with a simple OpenOffice plugin.
3.3.1 Embedding and Bidirectionality
MDSheet builds upon a technique to allow embedding of spreadsheet models and
in-stances in the same working spreadsheet and environment [Cunha et al., 2011], as shown in Figure 15 and Figure 16 for the model and data worksheet respectively. This embedding
also allows model-driven spreadsheet evolution (as explained in Section 3.2) in the same environment, allowing a user to modify the model in one worksheet, the instance is updated
prom-3 MODEL-DRIVEN SPREADSHEET ENGINEERING
ising results and suggest productivity gains are possible using this model-driven spreadsheet
development environment [Cunha et al., 2013a].
Figure 15: Model on the first worksheet of a spreadsheet
Figure 16: Data on the second worksheet of a spreadsheet
This embedding supports evolution by allowing model changes to be reflected upon the instances, but the reverse is also possible because of a bidirectional transformation system
which MDSheet has, allowing the instance to be changed and the model reflects those changes using the theoretical foundations from [Cunha et al., 2012c]. This bidirectionality extends
the previous features, now allowing end-users to change either model or instance, all in the same spreadsheet (due to embedding).
3 MODEL-DRIVEN SPREADSHEET ENGINEERING
Figure 17: Bidirectional evolution diagram
These model transformations are related to a sequence of transformations on the data, which ensures that a valid model transformation is equal to a valid data transformation
and guarantees that evolved data instance maintains conformity with the model. To allow the opposite to happen, a similar technique is used, as shown in Figure 17 (taken from
[Mendes, 2012]), once again guaranteeing consistency between model and instance.
3.3.2 Architecture
When MDSheet was being designed, modularity was kept in mind, to not only be able to work on various systems, but also allow new features and functionality to be extended in
this system.
3 MODEL-DRIVEN SPREADSHEET ENGINEERING
three main components: the User Interface, the Integration Code, and the Transformation
System.
Figure 19: MDSheet Button Interface
The User Interface component represents the graphical representation, in the form of
buttons in OpenOffice, of the ClassSheet operations which a user can do, such as creating new ClassSheet classes, adding new columns/rows to the classes, and other operations, as
we can see in Figure 19. Along with the buttons, are the windows where users can specify the expansion direction of the classes, and the naming of the class.
One of the most important components of the MDSheet architecture is the Integration Code. It is here where the connection between the OpenOffice components (of BASIC,
C/C++) and the Haskell framework (where the core of this system is implemented in) is made. In this level, the Foreign Function Interface is used to close the gap between Haskell
and C/C++ code, making possible the conversion of Haskell data structures to C/C++’s data structures.
The third component is the Transformation System, which consists of the functions used to manipulate ClassSheet models and spreadsheet data, including the functions to perform
the operations already mentioned (adding a new ClassSheet model, adding new attributes to a model, etc), along with the bidirectional transformation system explained in the previous
Subsection 3.2, and shown with Figure 17.
The modularity of the MDSheet framework allowed me to integrate my thesis work,
which allowed me to take advantage of ClassSheet model specifications, and the OpenOffice graphical interface.
4 QUERYING MODEL-DRIVEN SPREADSHEETS
4 Querying Model-Driven Spreadsheets
What I envision is a simple SQL-like query language where users can easily construct queries right in their spreadsheet environment, without the need of complicated
configur-ations, or extra programs other than a simple add-on. This approach would build upon a Model-Driven spreadsheet development environment, where the queries would be expressed
referencing entities in ClassSheet models instead of the actual data, allowing the user to not have to worry about the arrangement of the spreadsheet’s data, but only what information is
present. This would allow spreadsheet evolution to occur on the data or the arrangement of entities within a spreadsheet model, without invalidating previously constructed queries, as
long as the entities continue to exist in the model. To exemplify what I envision, a practical example of a real-life scenario will be presented.
4.1 Querying Model-Driven Spreadsheets: An Example
Figure 20: ClassSheet Model for a flight spreadsheet
Figure 20 is an example of a ClassSheet model for a fictional flight spreadsheet. As the reader can see, the Flight class is composed of both a Pilot and a Plane class, each with
its own identification code, or ID, while expanding vertically and horizontally respectively. The joining of the Pilot and Plane classes gives us four distinct attributes: Depart,
4 QUERYING MODEL-DRIVEN SPREADSHEETS
Figure 21: Flight spreadsheet data
Above (Figure 21) is a flight spreadsheet in conformance with our previously mentioned ClassSheet from Figure 20, which we will be using as our example. This data spreadsheet
represents flight data for four Planes and eighteen Pilots.
Now let us imagine a flight manager, John, who needs to know which Pilots and Planes
made their way to Lisbon Airport, and since he is in good spirit, wants to know how many hours each of those Pilots has flown, to possibly give them a raise.
So John needs to answer the following questions:
Query1: Which Pilots and Planes have had their destination as LIS?
Query2: How many hours has each of those Pilots flown?
With only needing to look at the ClassSheet Model, if he does not remember or know
the structure of the spreadsheet data, John would be able to write following simple SQL-like query:
4 QUERYING MODEL-DRIVEN SPREADSHEETS
Listing 1: Model-driven query for Query1
SELECT P l a n e s .* , P i l o t s . *
FROM F l i g h t s
WHERE D e s t i n a t i o n = ’ LIS ’
Listing 2: Model-driven query for Query2
SELECT P i l o t s .* , sum( Hours )
FROM F l i g h t s
WHERE D e s t i n a t i o n = ’ LIS ’ GROUP BY P i l o t s .*
LABEL sum( Hours ) ’ T o t a l Hours ’
And have the following results:
Table 1: Results for Query1
Planes.ID Pilots.ID 1001 2004 1001 2008 1001 2012 1002 2001 1002 2005 1002 2009 1002 2013 2051 2012
Table 2: Results for Query2
Pilots.ID Total Hours
2001 2 2004 0 2005 1 2008 0 2009 2 2012 8 2013 2
4 QUERYING MODEL-DRIVEN SPREADSHEETS
Now if he were to use an alternative approach, such as the Google Query Function
(GQF) to answer his questions, the task would be much more difficult. First off, the spread-sheet data would have to be in a denormalized state, so either the manager manually re-writes
his spreadsheet data temporarily, or he re-writes the spreadsheet permanently, possibly mak-ing the data much harder to read, manage, update, and analyze for him and any other user,
just to be able to run the GQF.
Figure 22: Flight spreadsheet data in denormalized state
So after John re-writes his data to the required state, as seen in Figure 22, he can finally
begin writing his questions in an SQL-like query. But here’s the catch, the query writing isn’t as simple as stating what Attributes he wants to use, or what models he wishes to
question, he needs to state what area in his spreadsheet has the data, and which Columns, not Attributes, he will use.
4 QUERYING MODEL-DRIVEN SPREADSHEETS
The previous two questions the manager wanted answered, Query1 and Query2, would
be written in the following way:
Listing 3: Google QUERY function for Query1
=q u e r y( A1 : F53 ;”SELECT A, B WHERE D = ’ LIS ’ ”)
Listing 4: Google QUERY function for Query2
=q u e r y( A1 : F53 ;”SELECT B , SUM(F) WHERE D = ’ LIS ’ GROUP BY B LABEL SUM(F) ’ T o t a l Hours ’ ”)
As shown, the first part of the function needs the spreadsheet data area, in our manager’s
case, A1:F53, which is all of his data, including the headers. The second part of the function needs the actual query, and as you may notice, it uses column letters to specify the attributes,
not their names.
These results are identical to the results previously returned from Query1 and Query2,
as they should be.
Figure 23: ClassSheet Model for a flight spreadsheet after Airline name attribute inserted
But John just realized he forgot to add the Planes’ Airline name! John promptly goes on to update the spreadsheets to reflect this. Using a model-driven environment, John just
needs to add the new attribute to the ClassSheet model, as shown in Figure 23, where he added to column D/row 2 the Airline attribute. And as expected, the spreadsheet data in
conformance also updates accordingly and all John needs to do is write the Airline names (Figure 24), no worries and no problems occur due to this evolution, fast and simple.
4 QUERYING MODEL-DRIVEN SPREADSHEETS
Figure 24: Flight spreadsheet data after Airline name attribute inserted
The two queries are untouched, and correctly function as John would hope. But what
if he used the GQF instead? How would he go about on making the spreadsheet change to reflect the Airline names?
Figure 25: Flight spreadsheet data in denormalized state after Airline name attribute inserted
First, he would have to go to the denormalized data from Figure 22 and add the new column, and since he wants to group closely together the information about the Planes, so
reading and writing the spreadsheet data won’t become even more confusing, he decides to add the column between column A and column B, and then fill in the cells with the names,
4 QUERYING MODEL-DRIVEN SPREADSHEETS
reflecting the new change as shown in Figure 25.
But John isn’t done yet, after a few days he noticed that his two Google queries were not working correctly! Possibly causing errors and monetary losses. He noticed that not
only is the Range incorrect, since he added a new column, but the queries are also not the same ones as he previously wrote. The data range changed from A1:F53 to A1:G53, and in
this case, each column letter has to be shifted over one letter after column A. Eventually John figured out the solution and re-wrote the two queries as follows:
Listing 5: Rewritten Google QUERY function for Query1
=q u e r y( A1 : G53 ;”SELECT A, C WHERE E = ’ LIS ’ ”)
Listing 6: Rewritten Google QUERY function for Query2
=q u e r y( A1 : G53 ;”SELECT C, SUM(G) WHERE E = ’ LIS ’ GROUP BY C LABEL SUM(G) ’ T o t a l Hours ’ ”)
The problem with the Google queries was that since the query string and range input is
based completely off of the positioning of the data in the spreadsheet rather than referencing entities and attributes in a spreadsheet, when any new column or row is added, the range
input needs to be updated, and quite possibly the query strings too.
Now, our example spreadsheet was pretty simple in terms of the amount of data, only
having six columns, and fifty-two rows. But imagine the spreadsheets used by business workers and companies, with thousands and thousands of rows, and hundreds of columns.
Our poor manager would end up getting lost while writing the query, “Was it column BD or BL that had the salary? Or was it AA?”, or even while analyzing and updating the
spreadsheet in the restrictive denormalized state, and just imagining the trouble the user would go through just to add new information to the spreadsheet while having to update
the queries manually is enough to deter many from using the GQF.
So as one can see, our approach hopes to make querying spreadsheets more:
Humanized - Now we can represent attributes and data areas (models) using human designated names, instead of column letters.
4 QUERYING MODEL-DRIVEN SPREADSHEETS
Understandable - Now we can actually understand and easily read the queries, knowing exactly what they do
Robust - Unless attributes in the query are removed or renamed, the queries can still correctly function even with spreadsheet data/model evolution
Productive - No need to manually think through what spreadsheet area our data is in, or what column letter is a given attribute.
So while GQF does have its benefits such as using a Google made query engine to query the results, which anyone would have trouble trying to compete with, the end-user has a
much more difficult time to get to the point where he/she can effortlessly view his/her results and manage his/her data.
5 MDQL: DESIGN AND IMPLEMENTATION
5 MDQL: Design and Implementation
In this section we explain how the model-driven query language system we have created works. Figure 26 presents how the system functions. This system is implemented on top of
MDSheet [Cunha et al., 2012d].
conforms to denormalization normalization & model inference conforms to translation
Figure 26: The Model-Driven query system
This means that all the mechanisms to handle models and instances are already created and ready to use. This is the starting point: in the left part of the figure we show a
spreadsheet instance and its corresponding model. The second required part is the query over the model/instance. This will be explained in detail in the next Subsection 5.1. The
spreadsheet instance is then denormalized, as we will explain in Subsection 5.2, and the query over the model is translated into a Google query, as explained in Subsection 5.3. The Google
query and the denormalized data are sent to Google and the result received is shown in the bottom-right part of the figure, described in Subsection 5.4. Finally, a new model is inferred
so the result can be used as input to a new query, as explained in Subsection 5.5. This last step is necessary since we want the queries to be composable. This chapter concludes with
a brief explanation of the integration done into MDSheet and OpenOffice.
5.1 Model-Driven Query Language
The Model-Driven Query Language (MDQL) is very similar to the standard SQL
5 MDQL: DESIGN AND IMPLEMENTATION
the MDQL, we used advanced langauge engineering techniques from [L¨ammel et al., 2006],
and wrote the grammar/parser using ANTLR5, a computer-based language recognition
parser generator that uses LL(*) parsing, taking as input a grammar that specifies a
lan-guage and generates as output source code for a recognizer for that lanlan-guage (in this case Java), while also allowing the generation of lexers, parsers, tree parsers, and combined
lexer-parsers.
We then chose to use Tom6, a stable software environment for defining transformations,
manipulating tree structures and providing pattern matching to inspect objects and retrieve values. Additionally, since we used Tom along with Java, we were provided a generator of
efficient object oriented tree based data-structures, named Gom, and a strategy language that could be used to control transformations, which helped us greatly when translating our
query language to Google’s.
With these tools, I was able to use advanced compiler techniques such as:
generalized top-down parser (ANTLR) [Parr and Quong, 1995] generalized abstract trees (Tom) [Moreau et al., 2003]
generalized tree traversals in the form of strategic programming [Visser and Saraiva, 2004] Both the MDQL grammar and tree based data-structures (Gom) can be found in Appendix A and B respectively. Its syntax is shown in Listing 7. As we can see, instead of selecting
column letters in the SELECT clause, the user can select the ClassSheet attributes he/she wishes to query, while also allowing him/her to further specify, as to avoid any naming
conflicts which may occur, alternative ways of naming the attribute such as:
stating its name - (Destination)
stating the attribute along with its classes’ name (Pilots.ID)
stating both classes ((Pilots,Planes).Destination or (Planes,Pilots).Destination) stating all the attributes in a given class (Planes.*)
5 MDQL: DESIGN AND IMPLEMENTATION
Listing 7: Part of the model-driven query language syntax
S E L E C T [ D I S T I N C T ] (* | attr1, ... , Agg ( attrX) , ...)
[ FROM C l a s s S h e e t 1 , [ JOIN C l a s s S h e e t 2 ] , ...] [ W H E R E c o n d i t i o n s ]
[ G R O U P BY attr1, ...]
[ O R D E R BY attr1 [ ASC | DESC ] , ...]
[ L I M I T n u m R o w ] [ L A B E L attr1 ’ n e w _ a t t r1’, ...] [ WITH H I S T O G R A M ] attr ::= a t t r i b u t e | C l a s s .* | ( Class1 , C l a s s 2 ).* | C l a s s . a t t r i b u t e | ( Class1 , C l a s s 2 ). a t t r i b u t e
The MDQL also has a FROM clause, very reminiscent of the standard SQL FROM clause where the user chooses what tables he/she wishes to query, which allows the user
to choose which ClassSheet model(s) to use for the query, in cases where more than one ClassSheet is present in a worksheet. Also note that as in SQL we allow JOIN operations
between two ClassSheets, nonexistent in the GQF. We also have the LIMIT clause to limit the amount of results returned by a given number, and LABEL to rename attributes to a
given name, both originating from GQF clauses. The WHERE, GROUP BY, and ORDER BY clause works the same as in SQL, applying filters such as where an attribute is equal to
a given name (ex. Pilot.Name = ’Bob’), grouping values to apply an aggregation function, and ordering by a given attribute either ascendant (ASC) or descendant (DESC), all three
respectively. Finally, the DISTINCT clause was also implemented, also nonexistent in the GQF, to remove duplicated results which may occur, and WITH HISTOGRAM is used to
state if the user wishes the results produce a histogram chart to visually show the results. Since this language is very similar to SQL, it allows users who already know basic SQL
5 MDQL: DESIGN AND IMPLEMENTATION
allowing us to adapt the most used query language instead of creating one, while also allowing
queries to be more elegant, concise, robust and understandable for spreadsheets, along with being easy to learn since the SQL-language is often described as ”English-like” because many
of its statements read like English [Melton, 1998].
5.2 Denormalization of Spreadsheet Data
As previously mentioned several times, to be able to use the GQF, the data must be
in a single matrix format, with the headers present in the first row. In consequence of this restriction, for a user to be able to write all the queries possible with his data, every bit of
data from the spreadsheet has to be written in this single matrix structure. To do so, the data has to be in a redundant state, combining the data from multiple ClassSheet classes
together, reminiscent of a JOIN between tables in databases, duplicating the data in such a way that every bit of information, represented in the data, is able to be read. In other
words, we have to denormalize our spreadsheet data [Shin and Sanders, 2006].
To correctly do this, we must first obtain all the necessary and critical information from
the ClassSheet models, and their attributes/data. To begin, we obtain this information from the MDSheet framework (atleast in this context), such as which ClassSheet classes exist,
their names, their expansion direction (horizontally, vertically, both, or none at all) and most importantly the attributes in each class. So, if we look back on Figure 21 (which now
will be our running example for this sub-section) we would have:
Class = Planes ; Expansion = Horizontal ; Attributes = {Id} Class = Pilots ; Expansion = Vertical ; Attributes = {Id}
Class = Planes Pilots ; Expansion = Both ; Attributes = {departure, destination, date, hours}
Now that the classes and their attributes are organized together, the actual data for
each attribute can now be obtained. Using a function in MDSheet which has an input of a class and attribute name, and returns the data values for that attribute, we can now also
5 MDQL: DESIGN AND IMPLEMENTATION
add the data to each attribute in the classes. So for example, doing so for only the first
attribute in each class (shown above) we would have the following data sets:
Class = Planes ; Attribute[id] = {1001, 1002, 2050, 2051}
Class = Pilots ; Attribute[id] = {2001, 2002, 2003, ..., 2112, 2113, 2114}
Class = Planes Pilots ; Attribute[departure] = {FRA, OPO, CDG, OPO, FRA, OPO, ..., EWR, LAS, LAX, LAX}
What is not known to the user, is that each piece of attribute data also has information
regarding what Horizontal and Vertical (expanding) instance it belongs to. To illustrate what this means, take for example the data from cells B5;C5;D5;E5 (Figure 20), each
one would have their horizontal instance (Planes) as 0 and vertical instance (Pilots) as 0, this means they have a relationship with the first (counting from 0 onward) instance of the
Plane and Pilot, ID = 1001 and ID = 2001 respectively. Another example, if we look at cells J12;K12;L12;M12, they would have their horizontal instance as 2 and vertical instance
as 7 respectively, signifying a relationship with (Planes) ID = 2050 and (Pilots) ID = 2008. This information regarding the instances they belong to is extremely important, since this
can be used to correctly and carefully group the information from other classes in their rightful spot, almost as if these were the foreign keys in a database, guaranteeing consistent
information.
Finally, we join the classes together, and form the matrix like structure, having all the
attributes in the first row, and below each attribute the correct data. This way, each row rep-resents one piece of information from the original spreadsheet data, now in its denormalized
state.
5.2.1 Denormalization of Spreadsheet Data: Querying Problems
As stated before, we denormalize the data into a single table, but what was not stated
is that the problems caused by denormalized data querying, such as derived data and
denor-malized attribute aggregation are automatically dealt with. In fact, these are well-known and
5 MDQL: DESIGN AND IMPLEMENTATION
possible problems, a modified and smaller sample flight spreadsheet will be used, as shown
in Figure 27.
Figure 27: Modified spreadsheet flight example to show some possible query problems
Using Figure 20 for our base ClassSheet model, we changed the Pilot ID attribute to a Name attribute, added Airline (name) and Total Hours to the Planes class, and removed
all but Departure city and Hours flown from the Planes Pilots class. Table 3 shows how Figure 27 would be denormalized, giving us 6 column attributes, and 10 rows of information.
Table 3: Modified spreadsheet denormalized
ID Airline Total Hours Name Departure Hours
1001 TAP 7 John A. FRA 2
1001 TAP 7 Jake B. OPO 3
1001 TAP 7 Bob M. CDG 2 1002 AA 5 John A. CDG 2 1002 AA 5 Jake B. FRA 1 1002 AA 5 Bob M. CIA 2 1003 US 15 Jake B. LIS 8 1003 US 15 Bob M. LIS 7
1004 TAP 13 John A. MIA 6
1004 TAP 13 Bob M. EWR 7
One of the problems which may occur would be that of querying one of the single
expanding classes (non bi-direction where Expansion = Both), such as Pilots or Planes with this example, and using an aggregation. This is due to there being repeated information
when the data is denormalized, the same problem would occur in the database realm if one were to join two tables, and query only one with an aggregation. To exemplify, lets say we
5 MDQL: DESIGN AND IMPLEMENTATION
How many hours has each Airline flown? How many hours have all the planes flown?
These two queries could be answered respectively with:
Listing 8: How many hours has each Airline flown?
SELECT A i r l i n e , sum( ’ t o t a l h o u r s ’) FROM F l i g h t s GROUP BY A i r l i n e
Listing 9: How many hours have all the planes flown?
SELECT sum(’ t o t a l h o u r s ’) FROM F l i g h t s
The correct responses should be:
Airline sum(total hours)
TAP 20
AA 5
US 15
sum(total hours) 40
But what would be returned is:
Airline sum(total hours)
TAP 47
AA 15
US 30
sum(total hours) 92
This is because the information is repeated, and when we run the aggregation on the Total Hours column, it just does its job and doesn’t consider redundant or repeated
5 MDQL: DESIGN AND IMPLEMENTATION
Table 4: Modified spreadsheet denormalized with column controllers
ID Airline Total
Hours
Name Departure Hours Planes.CC
1001 TAP 7 John A. FRA 2 1
1001 TAP 7 Jake B. OPO 3 0
1001 TAP 7 Bob M. CDG 2 0 1002 AA 5 John A. CDG 2 1 1002 AA 5 Jake B. FRA 1 0 1002 AA 5 Bob M. CIA 2 0 1003 US 2 Jake B. LIS 8 1 1003 US 2 Bob M. LIS 7 0
1004 TAP 17 John A. MIA 6 1
1004 TAP 17 Bob M. EWR 7 0
new column is added for the class in question, designated as a column controller attribute,
where the attribute for each row is either 1 or 0. If the first instance of a class is detected, the attribute is placed as 1, else it is 0. To exemplify this, take a look at Table 4.
With this, we can now isolate the values, and by just automatically adding to the user’s query ”WHERE Planes.CC = 1”, we can correctly obtain the desired results.
Another problem which may occur with querying denormalized data, in this context of a model-driven environment, is with derived data. By this I mean any attribute which is
calculated or derived from other data, in other words a spreadsheet formula. Using the same example, if we look closely, Total Hours can also be written with a spreadsheet formula
on the business level, or ClassSheet model, instead of being a simple value. If we took that as our example, total hours could be written as =sum(hours) in the ClassSheet model.
What this may bring, is a small level of ambiguity when writing a query aggregating that data, which is completely avoidable with correct query building and basic understanding of
the model written. But just for explanation purposes, lets imagine the user wants to know:
How many hours each Pilot has flown?
How many hours were flown out of each city? The correct way to write these two queries would be:
5 MDQL: DESIGN AND IMPLEMENTATION
Listing 10: How many hours has each Airline flown?
SELECT name , sum( h o u r s ) FROM F l i g h t s GROUP BY name
Listing 11: How many hours have all the planes flown?
SELECT d e p a r t u r e , sum( h o u r s ) FROM F l i g h t s GROUP BY d e p a r t u r e
But what may happen is instead of using hours the user may use total hours since he/she believes it may be the same, considering how one is derived and dependent on the
other. What happens when this case is detected, the query will be allowed to be executed, because there may be cases in which such a query is correct, and return a warning to the
user stating it might not be exactly what he is trying to question. Initially, I did want to implement some sort of intelligent deduction to the queries, by this I mean allowing
the parser to notice this particular problem and automatically change sum(total hours) to sum(hours) after analyzing the attribute and noticing how it depends on the hours
attribute. But the moment the formula depends on more than one attribute, or is much more complicated, such a system would become considerably harder to develop, and in the
end, it would constrain the user (since it would force the attribute change) and limit what he can or cannot query.
5.3 Translation to Google Query
The main reason we chose not to develop a new querying engine, but re-utilize the QUERY function’s querying engine, is because we do not want to try to compete with
Google in terms of performance and speed where Google has shown dominance in when developing querying engines. To properly run the GQF, our model-driven queries must
adhere to the Visualization API Query Language [Google, 2013a], specified by Google. So, for our model-driven queries to function correctly, a translator was made to transform the
model-driven queries written by a user to their exact equivalents for the GQF. To do so, we used the Gom tree based data-structures provided by Tom, and took advantage of the
5 MDQL: DESIGN AND IMPLEMENTATION
the query respectively.
The translator automatically calculates the range from the ClassSheet models selected, in the FROM clause for example, by using a lookup function to find what is the new range
of data after the denormalization process. It also substitutes the attribute names to their corresponding column letters in the denormalized data, without the user having to do so.
After parsing the user’s query, and verifying that each attribute chosen by the user exists, and has absolutely no conflicts, such as any ambiguous attribute names due to the attribute
name repeating in more than one ClassSheet (which may be solved by adding the class name beforehand as shown in 5.1), we apply another lookup function on each attribute,
and calculate the column letter corresponding to each attribute.
Now having both the denormalized data and translated model-driven query ready, we
can send the spreadsheet data to Google Spreadsheets, run the GQF and afterwards retrieve the results for the user to view in an OpenOffice worksheet.
5.4 Google Spreadsheets
To be able to send the spreadsheet data to Google Spreadsheets and run the GQF, I turned to the Google Spreadsheets API version 3.0 [Google, 2013b], an API which enables
developers to be able to create applications that can read, write and modify the data in Google Spreadsheets. It allows us to manage the worksheets in a Google spreadsheet, manage
cells in a worksheet by position, and also allows us to create spreadsheets, worksheets, insert and delete data, and retrieve a single worksheet or a spreadsheet, along with authorizing
requests and authentication.
So before we acquire the query results, we begin by creating a temporary worksheet
which will be filled with the denormalized data, followed by creating a second temporary worksheet where the query function string is sent to. The second the query function is
inserted into a cell, it calculates the results, and now that second worksheet contains the query results. Finally, the results are retrieved, the temporary worksheets wiped and an
5 MDQL: DESIGN AND IMPLEMENTATION
5.5 ClassSheet Inference
Originally, we did not envision nor plan on having the queried results return to the
user with an associated model and the data conformed to it. But during the months that followed, we decided it would be beneficial to not only the user to continue working with
the ClassSheet models, since the original data would be in the form of a ClassSheet model, but it would also allow us to make the queries composable, that is, to allow the output of
a model-driven query as the input of another model-driven query. Without a model for the
output of the GQF’s result, this would not be possible.
Previous work in this field introduced a technique to automatically infer a ClassSheet
model from spreadsheet data [Cunha et al., 2010]. Thus, applying this technique on the results obtained from the GQF, we can now infer the correct ClassSheet model and have it
alongside the queried results. For example, applying the inference technique to the results from Query 2 presented in Table 2, we would obtain the ClassSheet model shown in Figure 28,
and now present the user the results alongside its model.
Figure 28: Model automatically inferred from the spreadsheet data shown in Table 2
5.6 Integration with MDSheet and OpenOffice
Along with the core work which was presented in the beginning of this chapter, further
work was also done to link and integrate it to the MDSheet framework and OpenOffice. The MDSheet framework uses more than one programming language, mainly C++ for
its core, BASIC for the OpenOffice macros and interface, and Haskell for manipulating the spreadsheet data and ClassSheet models. Considering how the ClassSheet’s data and
information regarding the classes was needed such as the name, expansion direction, which attributes and classes it contained and the instances the data belonged to, some extra Haskell
5 MDQL: DESIGN AND IMPLEMENTATION
for the denormalization process to be correctly done.
Along with Haskell, since I was integrating the work into MDSheet, a chunk of C++ code was needed to be written, mainly to use the functions and operations from the rest of the
framework, to call upon the Haskell functions, to obtain the query from OpenOffice and the ClassSheet information from Haskell to send off to be parsed/translated, and denormalized
respectively. But since Java was used for the core of my work, I would need to somehow bridge C++ code with Java code. To do so, I used the Java Native Interface, or JNI 7.
Figure 29: JNI connecting C/C++ with Java
JNI [Oracle, 2013] is a programming interface for writing Java native methods and em-bedding the Java Virtual Machine (JVM) into native applications such as C or C++. Using
JNI now made it possible to convert the C++ primitive types into Java classes and types, to invoke Java methods and to convert Java classes and types back into C++ primitives.
To finalize, some BASIC code was written in OpenOffice to create a button to launch a window for the user to write his/her query along with Execute and Cancel buttons, and the
6 QUERYSHEET
6 QuerySheet
The model-driven query language and the techniques proposed in the previous section (5) and in [Cunha et al., 2013b] were the building blocks used to join it all into one single
tool, integrated in MDSheet and OpenOffice, named QuerySheet [Belo et al., 2013].
To demonstrate QuerySheet, we will be using the ClassSheet model shown on the left in
Figure 30 to describe the business model, and as expected its data, is in conformance with the model.
Suppose that we would like to know the following:
How much have we profited from each client?
How much have we profited from USA clients (with its histogram)?
Figure 30: A model-driven spreadsheet representing orders, clients and products
In QuerySheet, we can express the query based on the ClassSheet model. The tool
provides a New Query button, which opens a text box to allow the user to define a query. As we can see in Figure 30 on the top right, we have the query for our first question, and
6 QUERYSHEET
structure. Moreover, we now use the ClassSheet entities to identify the attributes to be
queried.
When executing the query, QuerySheet passes through all the phases explained in
Sec-tion 5 and shown in Figure 26, while also generating the result as a ClassSheet-driven spreadsheet. As a matter of fact, two new worksheets are added to the original spreadsheet:
one containing the spreadsheet data that results from the query (DataQuery1), and the other contains the ClassSheet model (ModelQuery1), shown in Figure 32. This whole process is
depicted in Figure 31. denormalization normalization & model inference conforms to Spreadsheet Data
Figure 31: The architecture of QuerySheet
Now, since we generate a new model for the results, we may write composable queries. We can take advantage of this, and write our second query based on the first query’s results!
Once again we click on the New Query button and write our second query, shown in the top right of Figure 32.
6 QUERYSHEET
Figure 32: The model-driven spreadsheet produced after executing the first query
Yet again, once executed, QuerySheet passes through all the phases and generates
an-other ClassSheet-driven spreadsheet, one containing the spreadsheet data with a histogram (DataQuery2), and the other containing the ClassSheet model (ModelQuery2). The results
are shown in Figure 33.