Bus passenger counts using Wi-Fi signals: some
cau onary findings
Diego Benites Paradeda1, Werner Kraus Junior2, Rodrigo Castelan Carlson3
1Post-graduate Program in Automa on and Systems Engineering, UFSC, Brasil, [email protected] 2Post-graduate Program in Automa on and Systems Engineering, UFSC, Brasil, [email protected] 3Post-graduate Program in Automa on and Systems Engineering, UFSC, Brasil, [email protected]
Recebido:
3 de maio de 2019
Aceito para publicação:
16 de outubro de 2019
Publicado:
12 de novembro de 2019
Editor de área:
Bruno Vieira Bertoncini
ABSTRACT
The viability of bus ridership surveys based on the detec on of Wi-Fi MAC addresses of portable devices is analyzed. Mo va on for the study arises from the apparent contra-dic on between success cases reported in the literature and empirical findings from field experiments we have carried out. Requirements for proper passenger iden fica on in transit systems are used as the basis for evalua ng the capabili es of commonly avail-able detec on hardware and so:ware. More specifically, elapsed me intervals be-tween detec ons of the same device are taken as the requirement for determina on of the state of the device and, hence, the iden fica on of the holder as a passenger. For instance, when performing boarding and aligh ng surveys with detec on equipment placed onboard, it is necessary that mul ple detec ons take place from right a:er pas-senger boarding and before he/she gets off, thus enabling accurate es ma on of the trip origin and des na on. Experimental results in controlled and uncontrolled trials in-dicate that off-the-shelf components used with available open source so:ware may not grant successful detec on. For instance, we have found mes of up to 40 s for the first detec on of 86% of nearby devices and an average of 80 s for a second detec on of devices in the controlled experiment. For the uncontrolled experiment of rides on buses, significant differences between manual counts and detected devices were found. As a result of these empirical observa ons, careful assessment of the exis ng detec on schemes used in ridership surveys is recommended.
RESUMO
Analisa-se a viabilidade de pesquisas sobre usuários de ônibus com base na detecção de endereços MAC WiFi de disposi vos portáteis. A mo vação para o estudo decorre da aparente contradição entre casos de sucesso publicados na literatura e resultados de experimentos de campo que realizamos. Requisitos para iden ficação adequada de pas-sageiros de ônibus são usados como base para avaliar as capacidades do hardware e so:ware de detecção comumente disponíveis. Mais especificamente, os intervalos de tempo decorridos entre as detecções do mesmo disposi vo são tomados como requi-sito para a determinação do estado do portador do disposi vo e, portanto, a iden fica-ção deste como passageiro. Por exemplo, ao realizar pesquisas de embarque e desem-barque com equipamentos de detecção instalados a bordo, é necessário que várias de-tecções ocorram logo após o embarque do passageiro e antes do desembarque, permi-ndo assim uma es ma va precisa da origem e des no da viagem. Resultados experi-mentais em ensaios controlados e não controlados indicam que os componentes dispo-níveis no mercado com so:ware de código aberto podem não fornecer detecções bem-sucedidas. No experimento controlado, encontramos tempos de 40 s para a primeira detecção de 86% dos disposi vos e uma média de 80 s para a segunda detecção de disposi vos. Para o experimento não controlado de viagens em ônibus com carrega-mento médio, foram encontradas diferenças significa vas entre as contagens manuais e os disposi vos detectados. Como resultado dessas observações empíricas, reco-menda-se uma avaliação cuidadosa dos esquemas de detecção existentes usados nas pesquisas de número de passageiros.
Keywords:
Bus ridership surveys, Wi-Fi user detec on, Transit OD es ma on.
Palavras-chaves:
Pesquisas sobe-e-desce, Detecção por Wi-Fi,
Matriz OD de transporte público. DOI:10.14295/transportes.v27i3.2039
1. INTRODUCTION
The idea of using Wi-Fi signals to detect portable devices carried by riders in public transit holds the promise of affordable methods for estimating a variety of ridership information (El-Tawab et al., 2016; Håkegård et al., 2018). Similar with Bluetooth and other near-range commu-nication technologies, Wi-Fi uses ID strings (known as MAC addresses) that uniquely identify a device (IEEE, 2007). Coupled with schemes for assuring that the detected MAC refers to a given device on a certain bus, information about origin-destination of trips, including connected trips, and bus loading between stops may be obtained. Thus, using off-the-shelf Wi-Fi devices and specialized software which is readily available with open-source licenses, it could be possible to exploit the bene4its of MAC detection for the sake of ef4icient, data-rich public transportation management and operation.
Detailed passenger volume data on public transport lines can be obtained by boarding and alighting counts at each bus stop along the route. The usual way to perform this type of counting is to place researchers at each bus stop or boarded on a bus (O'Flaherty, 1996), a method still used. Such method is costly and error prone, motivating the search for automatic passenger counting and identi4ication methods.
The widespread use of portable devices with Wi-Fi interfaces is the main reason to consider automatic counting schemes based on detection of MAC addresses. In Brazil, for instance, there are around 230 million smartphones in use by the population (Meirelles, 2019); Balboni (2018) cites that 86% of people use Fi outside their homes in the country. The predominance of Wi-Fi connection usage is mainly due to the free access in many places and the lower power con-sumption of Wi-Fi compared to the alternative 3G/4G internet access. Hence, smartphones pro-vide a potential means for personal location estimation, including inside a bus.
The research reported in this paper assesses the performance of Wi-Fi detection in the public transit environment. The objective is to validate the technology for automatic surveys of transit ridership. Requirements for proper passenger identi4ication in transit systems are the basis for evaluating the detection system. More speci4ically, elapsed time intervals between detections of the same device are taken as the requirement for determination of the state of the device and, hence, the identi4ication of its holder as a passenger. For instance, when performing boarding and alighting surveys with detection equipment placed onboard, it is necessary that multiple detections take place from right after passenger boarding and before it gets off for accurate es-timation of the trip origin and destination.
Using detection intervals for evaluation, this paper reports experiments with a variety of smartphone devices that indicate that signaling by the Wi-Fi interfaces may not be frequent enough for proper detection of a passenger state. For instance, we have found times of up to 40 s for the 4irst detection of 86% of nearby devices and an average of 80 s for a second detection of devices in controlled experiments (with all detectable devices known in advance), which are insuf4icient for accurate estimation considering that bus stops are typically spaced at every 400 m or less. For uncontrolled experiments of rides on buses, signi4icant differences between man-ual counts and detected devices were found. These 4indings suggest that previous results re-ported in the literature may have been optimistic about the information available for aggregated data processing used in identi4ication procedures. Our results may explain why such detection systems are not available in practice.
The presentation is organized as follows. Section 2 presents an overview of related research; in Section 3, detection of mobile devices by means of their medium access radiofrequencies and protocols is presented, together with the Wi-Fi detection system developed for this study. Sec-tion 4 presents the controlled experiment, followed by the uncontrolled experiments in SecSec-tion 5. Concluding remarks are presented in Section 6.
2. RELATED WORKS
There are a few works in the literature dealing with Fi signaling for ridership surveys. A Wi-Fi data detection system was used by El-Tawab et al. (2016) to determine the waiting time of passengers at two bus stops using previously known mobile devices. The results showed that it was possible to obtain an estimate of the waiting time. Although they did not present how the devices were tested, the study discusses false positives that can lead to wrong estimates.
Dunlap et al. (2016) combined Bluetooth, Wi-Fi and GPS in a long-period data collection method. Standard 4iltering techniques were used in processing the collected data. Although the results presented seem fair, there was no calibration done in the study in order to allow relating the estimates with the real operational data. As the authors concluded, their method illustrated the capabilities of detection of mobile device traces for public transit surveys but did not claim accuracy levels are adequate.
Through statistical methods, Håkegård et al. (2018) have achieved reasonably good results in the estimation of passenger boarding and alighting. They used three types of algorithms based on time to detection and signal power. Parameters of the probability distribution func-tions were estimated by means of automatic passenger counting (APC) data provided by the bus company. The conclusion was that for large datasets comprising long observation times (weeks to months), the algorithms were able to estimate OD trips with reasonable accuracy. However, the work does not address the issue of short-term surveys, neither the issue of detec-tion of Wi-Fi devices. This may be due to the dif4iculty in detecting devices with Wi-Fi enabled (resulting in false negatives) and also with the detection of false positives that are actually out-side the bus. As discussed in this article, these points are related to the timing of successive MAC signaling, which we found necessary to approach with caution.
Nunes (2018) presented a method of classifying bus loadings in six categories (from empty to packed-full) using Wi-Fi detection. Statistical classi4ication with χ²-test and a geographic analysis method based on itinerary maps were used for data processing. Results indicate the ability to estimate the category in most cases. The author points out that there are problems when the occupation in the transport suddenly changes, which occurs frequently at bus stops. More accurate categorization and estimation of OD pairs was not attempted.
Using machine learning techniques, Roriz Jr. and Medrano (2018) estimated boarding and alighting along the route of a bus line. They 4irst performed 4ield experiments only with known devices to have a control group. After that, an experiment was performed with unknown de-vices. With the collected data, the training of these data was performed using Support Vector Machine (SVM) to perform the classi4ication according to boarding and alighting classes. Alt-hough the authors assert that it was possible to estimate 83.3% of the boardings and 88.7% of the alightings, the results re4lect the processing of data aggregated for one complete trip. Dis-aggregated data per bus stop presented in the article reveal that under- and overestimation at each stop tend to compensate along the route. Thus, the aggregated results seem more due to chance rather than accurate tracking of boarding/alighting.
Paradeda et al., (2018) presented preliminary results and analysis of two types of experi-ments for the detection of portable devices using Wi-Fi. Controlled experiexperi-ments performed with a control group indicated that 86% of the users were detected in less than 40 seconds. An un-controlled experiment on a bus stop comparing manual counts of boarding and alighting on buses with estimates obtained through Wi-Fi detection was also performed. The results were deemed satisfactory. However, similar with previous works by other authors, the analysis was based on aggregated data that may lead to overestimation of the quality of the obtained results. In summary, works in the literature suggest that the deployment of Wi-Fi detection as a means for obtaining transit ridership data is met with fair success. Contradicting these works, our ex-perimental results provide cautionary conclusions about using the technology for transit sur-veys. First, we present controlled experiments with all the devices in the detection area known in advance for determination of the success rate of device detection. Second, three rounds of experiments inside of buses were conducted, comparing the manual boarding and alighting counts with detected Wi-Fi data. In the controlled experiments, it was observed that all devices except one were detected at least once, with less success for a second detection. In the second scenario, automatic counts based on an ad-hoc processing algorithm have shown marked dif-ferences from data obtained by manual counts. The results showed that the conclusions re-ported in the literature about the viability of automatic passenger counting systems based on Wi-Fi data may not be warranted.
3. DETECTION OF MOBILE DEVICES FROM WI-FI SIGNALS
3.1. Detec8on technology op8ons
The 4irst option to obtain trip data from mobile phones is through the telephone operator’s sig-nal. Zhang et al. (2010), Bekhor et al. (2013), Alexander et al. (2015), Çolak et al. (2015), Jiang
et al. (2017), and Lind et al. (2017) determined user trajectories through data detected from information provided by the operators. Typical data consisted of the time a device was regis-tered on an antenna, the connection time, the time that a message was received, and the time that internet by 3G or 4G was accessed. An advantage of this approach is that, typically, this mode of operation of a mobile device is always enabled and does not require user intervention. On the other hand, such data is not stored by default in all countries and if it is stored, it is not public. Moreover, only the approximate position of the user can be obtained based on the power of the signal detected by the antenna at the base radio station (BRS).
In Brazil, information about mobile phone detection by an antenna is stored only if a connec-tion is established with the respective BRS. In other countries, regulatory requirements demand that every detection is recorded, thus providing a richer dataset about a device trajectory across a multi-BRS itinerary. The Brazilian case imposes limitations for accurate tracking. For example, data detected during the 2016 Olympic Games in Rio de Janeiro relied on connection data to obtain estimates of travel demand during the event (Çolak et al., 2015). The problem with con-nections is that not always a device engages in communication activity while at a point in the user itinerary. Compounded with the private ownership of the data, this shortcoming prevents the widespread adoption of BRS data for transit surveys.
The more practical alternative of using Bluetooth (BT) and Wi-Fi technologies depend on user activation of these interfaces. While this could be viewed as a shortcoming, the increased use of BT and Wi-Fi technologies means that they are always enabled by most users; it is more
so with the advance in battery technology so that the user is not penalized with energy short-ages by leaving the wireless interfaces turned on all the time.
Abedi et al. (2013) collected data via both BT and Wi-Fi. They conducted tests to determine the speed of detection of the two technologies and determined that with Wi-Fi it is possible to detect a user eight seconds faster than with BT. The time difference may seem small, but when it comes to a large mass of data, this difference is signi4icant.
The choice of the data detection method should be based on the ease, speed and con4idence in obtaining the required information. Preferably, it should not require user intervention and should not affect the user experience in terms of battery consumption. The speed with which the data is detected is greater with Wi-Fi, which for real-time applications is extremely im-portant.
3.2. Detec8on device
Wi-Fi devices, when trying to associate with an access point through 2.4 GHz and 5 GHz net-works using the 802.11 protocol (IEEE, 2007), perform an exchange of packets that leaves 4in-gerprints. The process of capturing these 4ingerprints is called snif4ing. This exchange of packets occurs even though there is no connection between the devices (Turner, 1988).
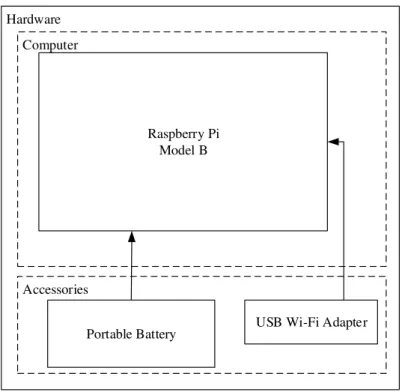
A Network Traf4ic Monitor (NTM) was developed for the detection of Wi-Fi devices. This type of device is often called a sniffer. The architecture of the equipment is illustrated in Figure 1 and its components are described next.
Raspberry Pi Model B: The Raspberry Pi 3 device is a very small computer with the same
set-tings as a medium-sized computer. A Class 10 MicroSD card of 32 GB was used for the storage of collected data.
USB Wi-Fi Adapter: The Ralink RT5372 Wireless Chipset Adapter was used as the Wi-Fi
adapter for its low cost and operation in monitor mode (Günther et al., 2014), allowing to cap-ture the exchange of information between Wi-Fi devices without connection to a network. This adapter model also allows the adjustment of the power of the signal range and, thus, control over the capture radius.
Portable Battery: essentially a portable charger power bank with a capacity of 10400 mAh,
providing enough power for some 13 hours of operation of the NTM.
The software architecture is based only on open source software. To perform data detection, Aicrack-ng and Airodump-ng were used (Cunche, 2014). To further encourage the use of Wi-Fi at the bus stop, an Access Point was created with Airbase-ng (Wang et al., 2016), so that users could connect to a network. All data were stored on the MicroSD card and uploaded to the cloud at the same time so that the data could be analyzed in real time.
The detection device was con4igured with a power of 1 mW, corresponding to a capture radius of approximately 12 m. This radius is deemed enough since the interest was in placing the NTM on a bus stop or onboard to detect nearby devices.
4. CONTROLLED EXPERIMENTS
The controlled experiments aimed at assessing the possibility of using Wi-Fi for the detection of devices and their use both in automatic onboard passenger counting, as well as in boarding and alighting surveys. More speci4ically, the controlled experiment was expected to assist in 4inding if all known mobile devices within the detection range are detected, how much time is
required for their detection and how often the detection occurs so that tracking of the same device is possible.
4.1. Experiments setup
The site of the experiments was chosen suf4iciently far from sources of Wi-Fi signaling so that it was possible to know in advance the MAC address of all the Wi-Fi devices involved. For this purpose, a soccer 4ield was chosen due to its location, 60 m distant from nearby traf4ic of people and vehicles, enough for the purposes of this study. Relevant data of the mobile devices of the participants, such as the MAC address, manufacturer and model, were registered prior to the experiments.
Figure 1. Hardware components of the NTM Wi-Fi device
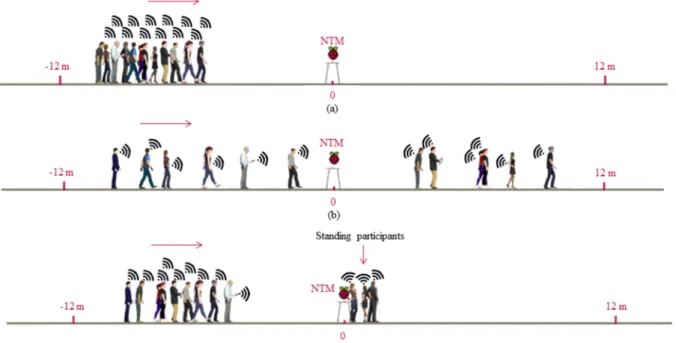
Twelve volunteers participated in the experiment carrying a mobile device with enabled Wi-Fi interfaces. The NTM was positioned between two markers spaced from each other by 24 m, making up the range of the detection area of the NTM. The role of the participants was to walk between the two markers and record their positions along the way through an application run-ning on their devices. In this way, accurate position information was available about the instants when they entered and exited the detection area of the NTM. Figure 2 illustrates the con4igura-tion of the three experiments, each being executed four times.
The 4irst experiment (Figure 2(a)) consisted of the simultaneous displacement of all partici-pants from one end of the experiment area to the other passing close together by the NTM. The objective was to verify the behavior of the NTM when a group of people crosses simultaneously the detection area.
In the second experiment (Figure 2(b)), the participants moved at different intervals from one end to the other of the detection area passing by the NTM. The aim was to compare the detection of a sparse group with the preceding experiment of detections of a compact group.
Hardware Computer
Raspberry Pi Model B
Accessories
USB Wi-Fi Adapter Portable Battery
The third experiment (Figure 2(c)) intended to reproduce the behavior at a bus stop. Four participants were instructed to stop in front of the detector while others kept walking. Standing users stayed for around 90 s and then proceeded to exit the detection area.
Figure 2. Setup and execution of the controlled experiments: (a) experiment 1 - displacement of the participants as a
group from one end of the experiment area to the other passing the NTM; (b) experiment 2 - participants moving at different intervals from one end to the other of the experiment area passing the NTM; (c) experiment 3 - group of participants standing near the NTM while another group moves from one end to the other of the experiment area passing the NTM
Table 1: Time intervals for successive detections of the same device and percentages of cumulative detections from all
runs of all experiments
Time interval (s) Cumulative detection rate (%)
40 86 50 89 60 93 70 95 80 96 90 97
4.2. Data Processing
Data processing is based on the cross-checking of information between the data detected by the NTM and the data provided by the participants through the application. This process is done in 4ive steps:
1. Removal of corrupted data;
2. Cross-checking between data obtained in the participants’ application and the NTM data;
3. Identi4ication of the 4irst detection of a participant’s device, considering the time rec-orded when the participant entered the detection area and the time of the 4irst detection by the NTM;
4. Identi4ication of the last detection of a participant’s device, considering the time rec-orded when the participant left the detection area and the time of the last detection by the NTM;
5. Identi4ication of intermediary detections of a participant’s device, considering the time recorded when the participant entered and exited the detection area, and the times of intermediate detections.
4.3. Discussion of the results
4.3.1. Aggregated view of detection data
When viewed in aggregate form, detection data reveals a fair degree of success by the method, along the lines presented by Paradeda et al. (2018). Table 1 indicates that in the 4irst 40 s of data collection, around 86% of devices would have been detected in at least one of the experi-ments; intervals for subsequent detections are also included in this detection rate. Since this interval is consistent with travel times between two bus stops, a high level of con4idence could be associated with the system by looking at this result.
(a)
(b)
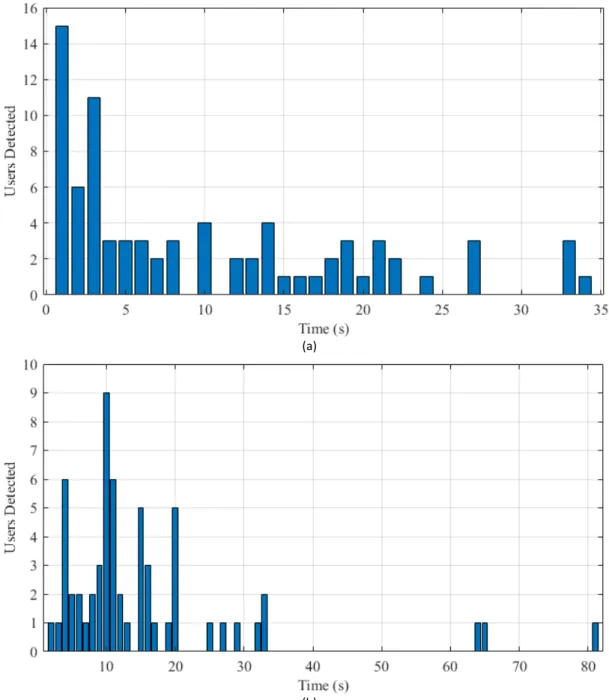
Figure 3. Histograms of (a) first-detection times and (b) second-detection times grouped in classes of one second
Graphical depiction of aggregate data provides a better understanding of the detection capa-bilities. Figure 3(a) shows the histogram of 4irst-detection times grouped in classes of 1 s inter-vals for the aggregation of data from every run of all experiments. In this case, all detections occur within a 35 s interval. But as will be discussed later, not all devices are detected on every run.
Second detection data is shown in Figure 3(b). Again, there is room for optimism when ob-serving that most of these detections occur within a 35 s interval. As in the previous case, how-ever, not all devices are detected twice in the same run, which otherwise would con4irm that the system is capable of tracking devices by means of multiple detections along an itinerary.
4.3.2. Disaggregation of detection data
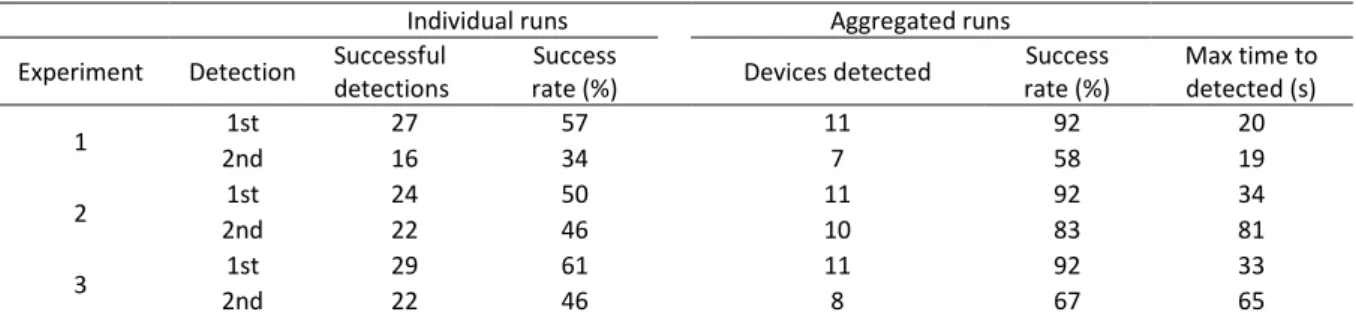
In order to assess the intrinsic characteristics of the data set, disaggregation of data for every run of the experiments is shown in Table 2. Overall, the success rate of 4irst detections was around 50% of the participating devices; that is, instead of the expected 48 detections, only about half of them actually occurred.
In terms of detected devices in all four runs, the picture is better since, eventually, most de-vices ended up being caught by the system in some run. The success rate is of 92% for 4irst detections and around 70% on average for second detections, despite the relatively high failure in detections on every run.
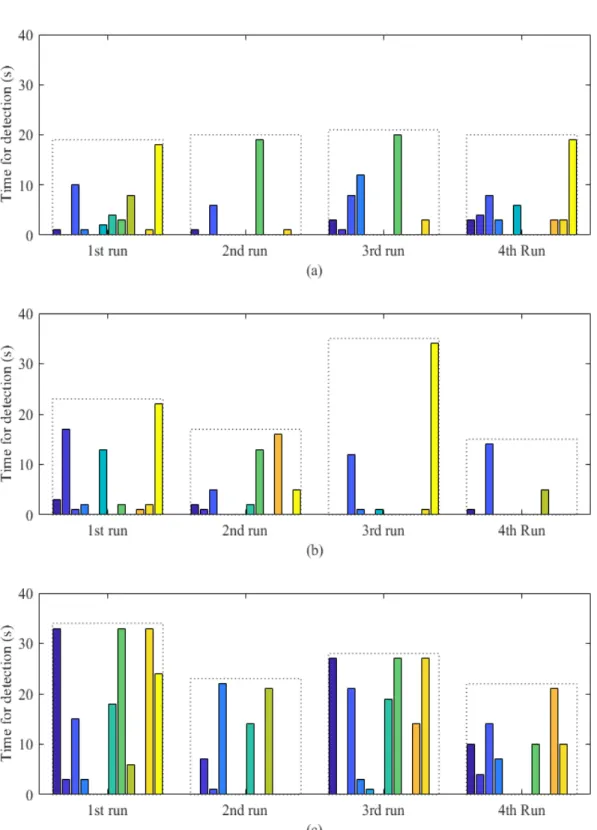
Further insight into the behavior of the detection system is provided by graphical depiction of the data disaggregated by every run. In this sense, Figure 4 presents the results for 4irst de-tections. The nature of the experiments is manifested in differences in overall times for detec-tion and detecdetec-tion occurrences.
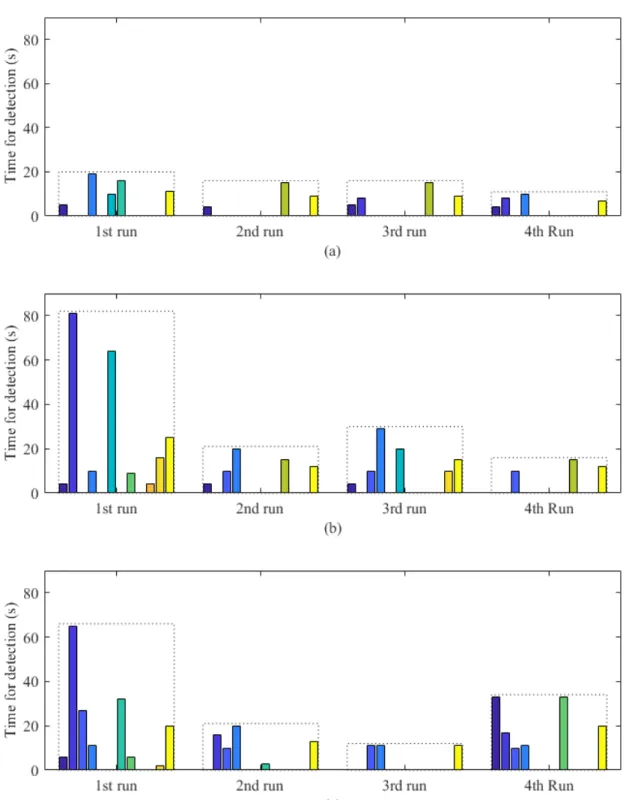
Additionally, Figure 5 shows the plots related to the second detection of devices. The plots show that it is more often the case that not all users had a second detection compared to the 4irst detection case. This is due to the connection search time of each device, being different for each device in the experiment. Moreover, when the second detection does occur, it may take relatively long to happen, as can be observed in all plots. Differences in the patterns of the plots in Figures 4 and 5 correspond to the nature of each experiment described in Section 4.1.
Table 2: Results of the four runs of every experiment; expected total detections is 48 per experiment (12 devices,
4 runs)
Individual runs Aggregated runs
Experiment Detection Successful detections
Success
rate (%) Devices detected
Success rate (%) Max time to detected (s) 1 1st 27 57 11 92 20 2nd 16 34 7 58 19 2 1st 24 50 11 92 34 2nd 22 46 10 83 81 3 1st 29 61 11 92 33 2nd 22 46 8 67 65
Overall, the results presented above suggest that the detections of a mobile device through Wi-Fi is erratic, without guarantee that every detectable device will be so in every run of the experiments. Second detection, important for the sake of tracking a device, takes longer and with less success rate than 4irst detection in all experiments.
Figure 4. Time for first detection per device in the controlled experiments (0 s means the device has not been detected):
Figure 5. Time for second detection per device in the controlled experiments (0 s means the device has not been
5. UNCONTROLLED EXPERIMENT
Another experiment was conducted on an uncontrolled environment by the placement of NTMs on bus stops and buses of a real bus route.
5.1. Experimental setup
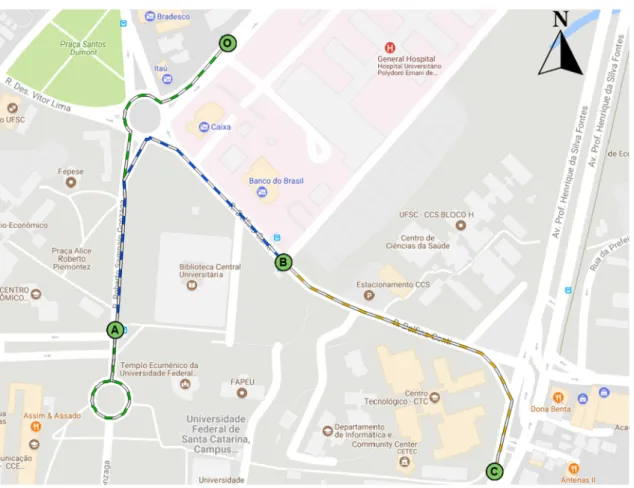
A section of a bus route in the vicinity of the Federal University of Santa Catarina was chosen for this experiment (Figure 6). A frequent bus line serving the university was chosen. The route section comprises four bus stops identi4ied in the 4igure as O, A, B and C. The route was divided in three segments marked by the bus stops, i.e., OA (548 m), AB (370 m), and BC (330 m). Three NTMs were installed at bus stops A, B and C and a fourth one was carried inside the bus. Three runs for data collection with buses travelling from O to C were performed. The GPS data of these trips were obtained from the operator of the transport system.
Figure 6. Bus route, bus stops and route segments
5.2. Experiment execu8on
Three volunteers participated in the experiment. In each of the three runs, each participant boarded at bus stop O carrying a mobile device with a known MAC address, thereby forming a control group. One of the participants was also carrying an NTM. This participant stayed in the central part of the bus and was also responsible for counting passengers alighting through the central door. The second participant counted passengers alighting through the rear door, and the third participant counted passengers boarding through the front door.
Boarding and alighting counts were made at each bus stop as well as the number of passengers onboard within bus stops. Upon arriving at bus stop C, the last one, the participants also left the bus and prepared for the next run.
5.3. Data Processing
Data processing consisted of analyzing the data obtained by applying the necessary 4ilters to qualify the information. This process was done in 4ive steps.
1. Removal of data that was corrupted or that had problems for reading the information; 2. Counting of the number of times a given device was detected, discarding those with only
one detection;
3. Identi4ication of the average signal power of a given device that should be within -79 dB to -1 dB;
4. Classi4ication of the segment(s) in which the passenger device was detected;
5. Obtaining the time of detection of a passenger device and the bus distance from the bus stop (from GPS data).
A passenger device was considered valid if and only if it was detect within 20 s of the depar-ture of the bus from the bus stop or if the bus is within a distance of 10 m of the bus stop. After this processing, passenger devices are characterized in two ways, boarding or alighting.
5.4. Classifica8on of passenger devices that are possibly boarding
A passenger device was considered boarding if and only if the device was detected by the exter-nal detector for the 4irst time before the bus reached the bus stop, the average power of the signal detected of a device at the bus stop was between -40 dB and -79 dB, the number of suc-cessive detections was greater than three, and the MAC was detected by the boarded NTM at least once along the route path.
5.5. Classifica8on of passenger devices that are possibly aligh8ng
A passenger device was considered alighting if and only if the device was detected during the route path, the device was detected the 4irst time by the NTM at the bus stop at the time of the bus arrival, the average power of the detected signal was between -70 dB and -79 dB, the num-ber of successive detections was between two and three and the MAC was not detected by the boarded NTM for the rest of the route path. Additionally, the interval between the 4irst and the second detection had to be less than 18 s for the case of two detections.
5.6. Results
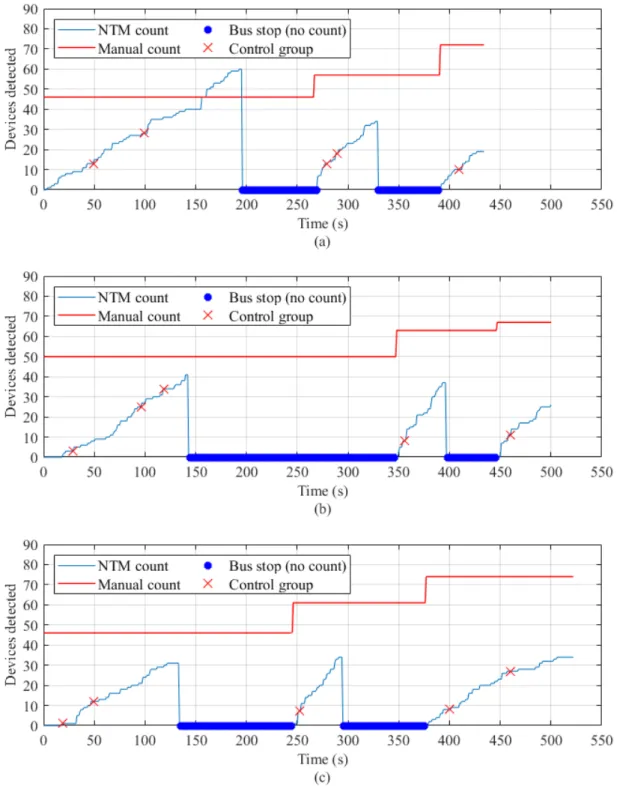
After the data processing, two results were obtained. The 4irst is based on the accumulated de-tections along the route compared with the manual counting of users on board (Figure 7). In the 4irst run (Figure 7(a)), it is possible to identify that there is a higher number of onboard users detected in the segment OA (from 0 to ~190 s) if compared to the manual count. This result presents the case of false positives, that is, more users were detected than they should have been detected. This problem does not occur in the segments AB (from ~270 to ~330 s) and BC (from ~390 to ~430 s). In fact, the number of detections is much smaller than the man-ual count, possibly because of the short travel times between bus stops and the long time needed for detections (see Section 4). In the other two runs illustrated by Figures 7(b) and (c), the counts are underestimated for all segments.
Other reasons for the low detection rate and the potential false negatives, i.e., devices that should be detected but were not, are users with Wi-Fi devices turned off or devices not search-ing for a network. Improvements in the method used for processsearch-ing the data may increase the detection rate.
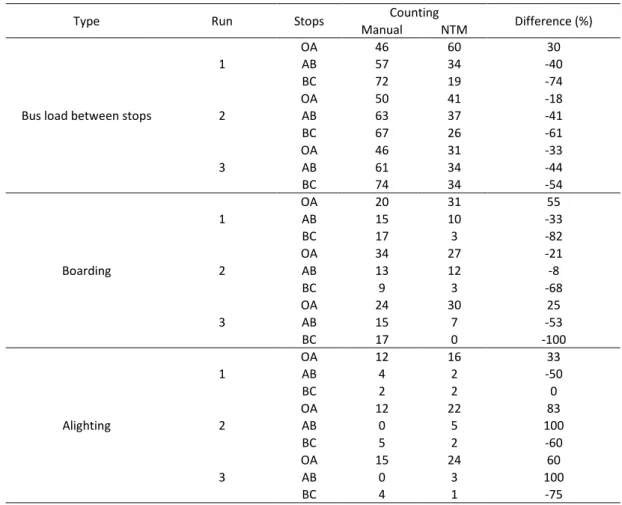
By analyzing the aggregate results in each of the runs, we can observe in Table 7 that the false positives seem to disappear. This gives the impression that the automatic count is always
smaller than the manual count, whereas this is not true for segment OA in the 4irst run. This type of result analysis, i.e., with aggregated data, is observed in several similar articles. However, analyzing disaggregate data may lead to a better understanding of the behavior of the detection system. As can be seen in Table 3 the estimated counts and the manual counts show signi4icant disparity.
Figure 7. Passenger devices accumulated during bus path in the uncontrolled experiment: (a) Run 1, (b) Run 2, and
Table 3: NTM on board estimates × on board manual counts; NTM boarding estimates × manual boarding counts; and
NTM alighting estimates × manual alighting counts
Type Run Stops Counting Difference (%)
Manual NTM
Bus load between stops
1 OA 46 60 30 AB 57 34 -40 BC 72 19 -74 2 OA 50 41 -18 AB 63 37 -41 BC 67 26 -61 3 OA 46 31 -33 AB 61 34 -44 BC 74 34 -54 Boarding 1 OA 20 31 55 AB 15 10 -33 BC 17 3 -82 2 OA 34 27 -21 AB 13 12 -8 BC 9 3 -68 3 OA 24 30 25 AB 15 7 -53 BC 17 0 -100 Alighting 1 OA 12 16 33 AB 4 2 -50 BC 2 2 0 2 OA 12 22 83 AB 0 5 100 BC 5 2 -60 3 OA 15 24 60 AB 0 3 100 BC 4 1 -75
6. CONCLUSION
Research using the detection of Wi-Fi devices for the estimation of passenger count and OD estimation in bus routes have shown mixed results. However, most of these works are based on the analysis of aggregated data that may overestimate the quality of the results, particularly in the studies reporting promising results. We have found that when the results are analyzed in aggregate form, the estimates of boarding and alighting passengers are of around 85% to 90% of the manual count, suggesting satisfactory estimates. When looking at the disaggregated data, the estimate errors are quite high. The errors are due to over- and underestimation of nearby devices. This result partially explains why the aggregate results may seem satisfactory in re-search reported in the literature, i.e., because of a compensation effect of over and underesti-mation.
There are applications for which the observed performance may be satisfactory. For instance, con4irming the OD of passengers of an interstate train involves less strict requirements of time intervals for detection. Yet, the usefulness of such OD estimation is less relevant since ticketing already provides most of the information. For urban transit, supplementing the detections with other types of information (e.g., GPS data from the devices) is needed for improved surveying results.
Limitations of the applied method, such as the parameters used for the times between detec-tions, for the number of detecdetec-tions, and the thresholds of measured signal power from devices can be subject to revision in order to test the sensitivity of the detection method. Still, covering all parameter space is infeasible so partial studies are always be the norm.
Further work in this topic has been under way dealing with identifying Wi-Fi signaling events at their source (i.e., the devices) in combination with the detection system. The goal is to make sure that every MAC signaling event is properly detected, assuring consistency of the detection system. Preliminary results in this direction con4irm the high level of detection performance.
ACKNOWLEDGEMENTS
The authors acknowledge the support of the National Council for Scienti4ic and Technological Development (CNPq).
REFERENCES
Abedi, N.; A. Bhaskar and E. Chung (2013) Bluetooth and Wi-Fi MAC address based crowd data collection and monitoring: bene4its, challenges and enhancement. 36th Australasian Transport Research Forum. Queensland University of Technol-ogy, Brisbane.
Alexander, L.; S. Jiang; M. Murga and M. C. González (2015) Origin–destination trips by purpose and time of day inferred from mobile phone data. Transportation Research Part C: Emerging Technologies, v. 58, p. 240– 250. DOI:
10.1016/j.trc.2015.02.018
Balboni, Mariana. Pesquisa sobre o uso das tecnologias da informação e da comunicação no Brasil: TIC domicı́lios 2018. São Paulo: Comitê Gestor da Internet Brasil, 2018.
Bekhor, S.; Y. Cohen and C. Solomon (2013) Evaluating long-distance travel patterns in Israel by tracking cellular phone posi-tions. Journal of Advanced Transportation, v. 47, n. 4, p. 435–446. DOI: 10.1002/atr.170
Çolak, S.; L. P. Alexander; B. G. Alvim; S. R. Mehndiratta and M. C. González (2015) Analyzing cell phone location data for urban travel: current methods, limitations, and opportunities. Transportation Research Record: Journal of the Transportation Research Board, v. 2526, p. 126–135. DOI: 10.3141/2526-14
Cunche, M. (2014) I know your MAC Address: Targeted tracking of individual using Wi-Fi. Journal of Computer Virology and Hacking Techniques, v. 10, n. 4, p. 219–227. DOI: 10.1007/s11416-013-0196-1
Dunlap, M.; Z. Li; K. Henrickson and Y. Wang (2016) Estimation of origin and destination information from Bluetooth and Wi-Fi sensing for transit. Transportation Research Record: Journal of the Transportation Research Board, v. 2595, p. 11–17. DOI: 10.3141/2595-02
El-Tawab, S.; R. Oram; M. Garcia; C. Johns and B. B. Park (2016) Poster: Monitoring transit systems using low cost WiFi tech-nology. 2016 IEEE Vehicular Networking Conference. DOI: 10.1109/VNC.2016.7835951
Günther, S. M.; M. Leclaire; J. Michaelis and G. Carle (2014) Analysis of injection capabilities and media access of IEEE 802.11 hardware in monitor mode. 2014 IEEE Network Operations and Management Symposium, p. 1–9. DOI:
10.1109/NOMS.2014.6838262
Håkegård, J. E.; T. A. Myrvoll and T. R. Skoglund (2018) Statistical modelling for estimation of OD matrices for public transport using Wi-Fi and APC data. 21st International Conference on Intelligent Transportation Systems. DOI:
10.1109/ITSC.2018.8570009
IEEE (2007) IEEE standard for information technology-telecommunications and information exchange between systems-local and metropolitan area networks-speci4ic requirements part 11: Wireless LAN medium access control (MAC) and physical layer (PHY) speci4ications. IEEE Std 802.11. Institute of Electrical and Electronics Engineers, p. 1005–1010. DOI:
10.1109/IEEESTD.2007.373646
Jiang, S.; J. Ferreira and M. C. Gonzalez (2017) Activity-based human mobility patterns inferred from mobile phone data: a case study of Singapore. IEEE Transactions on Big Data, v. 3, n. 2, p. 208–219. DOI: 10.1109/TBDATA.2016.2631141 Lind, A.; A. Hadachi and O. Batrashev (2017) A new approach for mobile positioning using the CDR data of cellular networks.
5th IEEE International Conference on Models and Technologies for Intelligent Transportation Systems, p. 315–320. DOI: 10.1109/MTITS.2017.8005687
Meirelles, F. S. (2019). 30ª Pesquisa Anual do Uso de TI nas Empresas, FGVcia: Centro e Tecnologia de Informação Aplicada da EAESP.
Nunes, E. H. M. (2018) “Estimativa da ocupação utilizando sensoriamento Wi-Fi de telefones móveis: Uma aplicação no trans-porte público urbano de passageiros por ônibus”. Departamento de Transtrans-portes, Escola Politécnica da Universidade de São Paulo, Brazil. DOI: 10.11606/D.3.2019.tde-18072019-112008
O'Flaherty, C. A. (1996) Transport planning and traf4ic engineering. Elsevier
Paradeda, D. B.; W. K. Junior and R. C. Carlson (2018) Estimativa de embarque e desembarque de passageiros por detecção de sinal de Wi-Fi de dispositivos Móveis. XXXII Congresso de Pesquisa e Ensino em Transportes, p. 1048–1059.
Roriz Jr., M. P. and R. A. Medrano (2018) UAI-FI: Um método baseado em aprendizado de máquina para contagem automática de passageiros utilizando sinais de Wi-Fi. XXXII Congresso de Pesquisa e Ensino em Transportes, p. 1048–1059.
Turner, J. S. (1988) Design of a broadcast packet switching network. IEEE Transactions on Communications, v. 36, n. 6, p. 734– 743. DOI: 10.1109/26.2794
Wang, S.-L.; J. Wang; C. Feng and Z.-P. Pan (2016) Wireless network penetration testing and security auditing. 3rd Annual In-ternational Conference on Information Technology and Applications. DOI: 10.1051/itmconf/20160703001
Zhang, Y.; X. Qin; S. Dong and B. Ran (2010) Daily O-D matrix estimation using cellular probe data. Transportation Research Board 89th Annual Meeting. Washington DC, United States. DOI: 10.1016/j.trpro.2018.10.013