Coffee Science, e151671, 2020
Doi: https://doi.org/10.25186/.v15i.1671
Optimization of robusta green coffee fermentation using response
surface methodology
Tedjo Narko1 , Marlia Singgih Wibowo1 , Sophi Damayanti1 , Indra Wibowo2 , Mochammad Arbi Hadiyat3 1Department of Pharmacochemistry, School of Pharmacy, Bandung Institute of Technology, Bandung, Indonesia.
2Department of Biology, School of Life Sciences and Technology, Bandung Institute of Technology, Bandung, Indonesia 3Department of Industrial Engineering, Surabaya University, Surabaya, Indonesia.
Contact authors: [email protected], [email protected], [email protected], [email protected], [email protected] Received in November 11, 2019 and approved in July 29, 2020
ABSTRACT
Kombucha coffee is a fermented coffee bean, which is extracted using a combination of bacteria and yeast. Kombucha coffee can be obtained by optimizing the three variables, namely sugar concentration, incubation temperature and duration of fermentation using a response surface methodology (RSM). This study aimed to produce kombucha coffee with a low concentration of caffeine and a high concentration of chlorogenic acid by optimizing three influential variables in the fermentation. The analysis of caffeine and chlorogenic acid contained in the kombucha coffee was carried out by using High Performance Liquid Chromatography (HPLC) and then the analysis of optimization was carried out by using Response Surface Methodology (RSM). The results of RSM show that the optimum condition was obtained at sugar concentration of 6.77% (b/v), incubation temperature of 25 °C and incubation for 18 days. The results were similar to HPLC analysis. Finally, the fermentation using RSM on kombucha coffee required an additional variable which is the amount of kombucha culture inoculums, as well as the variables of sugar concentration, incubation temperature, and duration of fermentation.
Key words: Kombucha coffee; caffeine; chlorogenic acid.
1 INTRODUCTION
Indonesia is the fourth largest coffee producer in the world after Brazil, Vietnam, and Colombia (Szenthe, 2019). A city in Indonesia that produces coffee is Garut, located in West Java. Two kinds of coffee that are commonly found in Indonesia are Arabica and Robusta coffee. Robusta coffee has a higher chemical content than Arabica coffee which contains 2.4-2.5 g/100 g of caffeine and 3.3-3.8 g/100g of chlorogenic acid (Farah, 2012). Coffee usually undergoes a roasting process to provide the coffee flavor. The roasting process can reduce the amount of chlorogenic acid that contributes to the final acidity, astringency, and bitterness of the coffee (Farah et al., 2006). Therefore, green coffee beans have a higher level of chlorogenic acid than ordinary coffee (roasted coffee beans).
Green coffee is coffee beans from the unroasted coffee fruit. Green coffee contains caffeine, trigonelline, carbohydrates, fats, amino acids, organic acids, phenolic minerals, and chlorogenic acid. The largest content in green coffee beans is caffeine and chlorogenic acid. Caffeine is a non-specific antagonist for adenosine receptors, which are widely distributed in the cortex (Ryan; Hatfield; Hofstetter, 2002; Chu, 2012). Caffeine works as a stimulant by blocking the adenosine receptors to inhibit the neurotransmitters (Ramachandran, 2002). Chlorogenic acid is the ester form of several cinnamic acids (cafeic acid, ferulic acid, and p-kumarat acid) with quinic acid available in a free form (Mursu et al., 2005). It is an antioxidant in the form of polyphenol compound that prevents cell mutation (Schieber; Saldana, 2009).
Several human clinical trials have been conducted to test the effectiveness and safety of chlorogenic acid in green coffee to reduce body weight and body mass in adults (Revuelta-Iniesta; Al-Dujaili, 2014; Cornelis, 2015). The optimum concentration of caffeine and chlorogenic acid can be employed by the addition of kombucha.
Kombucha is a fermented beverage that is produced from tea with the addition of kombucha culture (Jayabalan et al., 2008). This nutritious drink is widely consumed for therapeutic since thousands of years ago, especially in China and Korea. Kombucha is made from sweet tea and fermented with bacterial colonies and yeast. Kombucha is believed to be able to maintain the body by detoxifying, increasing stamina, improving the function of the small intestine, losing weight, and reducing cholesterol, acne, anxiety, arthritis, atherosclerosis, colitis, depression, diabetes, eczema, and tonsillitis (Childs; Childs, 2013). Kombucha is a symbiosis between bacteria and yeast, commonly called SCOBY. Acetobacter xylinum is a bacterium that is often found in the Kombucha culture, while some other species of yeast that have been isolated from Kombucha are Saccharomyces sp., Torulopsis famat, Pichia membranae, and Candida sp. Several factors may cause variation in the composition of kombuscha, including geographical condition, climate, culture, and the diversity of local species of bacteria and yeast (Teoh; Heard; Cox, 2004).
There are several parameters in fermentation that play an important role in to succeed in the bioprocess industry besides the microorganism used, such as the increasing of inoculum
concentration, urea concentration, and fermentation time. Several studies have investigated the effect of the addition of Zymomonas mobilis inoculums, urea concentrations in various fermentation mediums and the duration of fermentation were carried out (Nofemele et al., 2012). Meanwhile, there is a method that can be developed to optimize the fermentation process, called RSM (Ambati; Ayyanna, 2001; Lotfy; Ghanem; Elhelow, 2007).
RSM is a combination of mathematical and statistical techniques used for modeling and analyzing problems in a form of response influenced by several variables. The goal is to optimize the reaction by optimizing the variable levels to achieve the best systematic performance. This method can be used for research with a large number of factors with three and five levels of treatment. The use of this RSM can display a 3-dimensional graph using statistical software. RSM can be used to determine the optimal point of multifactor experiments (Myers; Montgomery; Anderson-Cook, 2009).
Regarding modeling, RSM uses the basis of mathematical equations that are developed at an experimental level so that the relationship with experimental data can only be analyzed through statistical models. The advantage of using RSM is to determine the optimum results where there is a need to shift the level of factors studied in the direction of an optimal response. The process is referred to as the steepest ascent/descent (Myers; Montgomery; Anderson-Cook, 2009). The RSM method was chosen because it’s able to explore the correlation between many factors to get the most optimal conditions for production in a bioprocess and to predict the response (Chang; Lee; Pan, 2006)
In this study, RSM was used to optimize the fermentation of Robusta green coffee beans through kombucha culture. There are three variables in the fermentation of kombucha coffee which will be examined including the concentration of sugar, incubation temperature, and duration of fermentation.
2 MATERIAL AND METHODS
For the current research, the materials used were Robusta green coffee beans from Garut, West Java, Indonesia (Determination of plants by SITH ITB No. 2833/I1.CO2.2./ PL/2017), starter kombucha (Indokombucha), sugar, methanol, acetic acid and distilled water (Merck). The analysis of caffeine and chlorogenic acid used a membrane filter of 0.45 μm. The instruments used were: high-performance liquid chromatography (HPLC) C-18 with a column length of 150 mm and a diameter of 4.6 mm and UV detector, and the Minitab software v.17.
2.1 Preparation of coffee
The Robusta coffee bean was processed first before the fermentation process carried out. After harvested, 2 kg of
coffee bean was experienced a wet process by putting it into pulper machine to remove the skin. Then it was soaked for several days and washed. It was dried in the sun or by using a dryer. It was placed into huller machine or pounded to remove the horn skin and then sorted.
2.2 Fermentation process
The fermentation process of kombucha coffee followed the research conducted by Jayabalan et. al (2008) with modification. It used Acetobacter xylinum and Saccharomyces cerevisiae which included several steps. About 0.375 g of simplicia powder (the beans which have been dried and ground) of Robusta green coffee was added into 300 mL distilled water. It was added with sugar in various concentrations of 5; 7.5; and 10 % (%w/v) and stirred. The mixture was cooled and filtered. The filtrate was added with 30 mL kombucha vinegar (the ratio of filtrate and vinegar was 10:1). The mixture was homogenized and placed into a sterile glass jar. About 20 g (108
CFU/mL) starter kombucha (purchased from Indokombucha) was inoculated into each jar. The jar was covered with sterile porous cloth and stored in the incubator. It should be not to shake or move. The temperature was also varied of 25, 31, and 37 °C and the incubation time was varied of 6, 12, 18 hours.
The harvest time of the products was carried out due to the incubation time of each sample. The vinegar of kombucha coffee was separated from the culture of kombucha which was formed on the surface. The vinegar then centrifuged with 6000 rpm for 40 min to precipitate the culture fibers. The filtrate then placed into the sterile glass bottle and tightly closed.
2.3 Quantitative analysis of caffeine and chlorogenic acid
Ten mL of samples of kombucha coffee was filtered using a 0.45 µM membrane filter. As much as 20 μL of the samples were analyzed by HPLC using a C-18 column. As for the caffeine analysis, the mobile phase used was methanol:water (7:3) with a flow rate of 1.0 mL/minute using a UV detector at λ = 273 nm. The mobile phase used for chlorogenic acid content was methanol:double-distilled water with 1% acetic acid (40:60), a flow rate of 1.0 mL/minute using a UV detector at λ = 329 nm.
2.4 RSM modeling using Minitab
This study used a central composite experimental design (CCD) to find the optimum combination of sugar concentration, incubation temperature, and fermentation time to produce the optimum caffeine and chlorogenic acid. Data obtained was based on a statistical design which analyzed by using the Minitab v.17 program and an analysis of variance (ANOVA) to test the significance. Three-dimensional curves were used to test the validity of the variable’s effect on the results obtained. The coefficients on the empirical model were
estimated using a multi-directional regression analysis, where the fitness of the empirical model with experimental data could be determined from the coefficient of determination (R2). Regression equations obtained after regression analysis were used to find the most optimal response conditions. In general, the general RSM regression Equation 1 was:
Based on the results of data processing with CCD, an optimal point will be searched through experiments involving several factors. The experiment was designed to get the response area which included three optimal points of three variables: sugar concentration, incubation temperature, and incubation time. Thus, the optimal point obtained is not a “local optimum” but can reach or at least approach the “global optimum” position of the response variable. Based on the data in Table 2, the results of RSM data processing were obtained using three research variables, the sugar concentration, incubation temperature and fermentation time which resulted in 14 sample combinations of three variables. These 14 combination samples will be tested to obtain the optimum results on caffeine and chlorogenic acid content of fermented Robusta green coffee beans using a kombucha culture.
3 RESULTS AND DISCUSSION 3.1 Caffeine and chlorogenic acid analysis
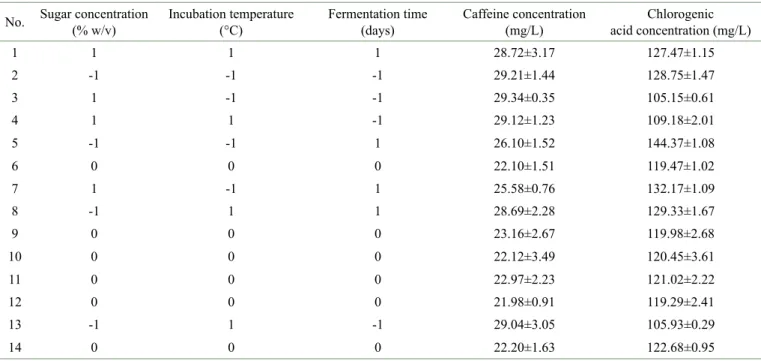
Based on the data in Table 3, the results showed that the lowest caffeine content was 21.98 mg/L obtained at a condition of 7.5% sugar concentration, an incubation temperature of 31 °C, and a fermentation time of 12 days. While the highest caffeine concentration was 29.34 mg/L obtained at a condition of 10% sugar concentration, an incubation temperature of 25 °C, and a fermentation time of 6 days. Table 4 shows that the lowest chlorogenic acid level was 105.15 mg/L obtained at a condition of 10% sugar concentration, an incubation temperature of 25 °C, and an incubation time of 6 days. While the highest chlorogenic acid concentration was 144.37 mg/L which was obtained at a condition of sugar concentration of 5%, an incubation temperature of 25 °C, and an incubation time of 18 days.
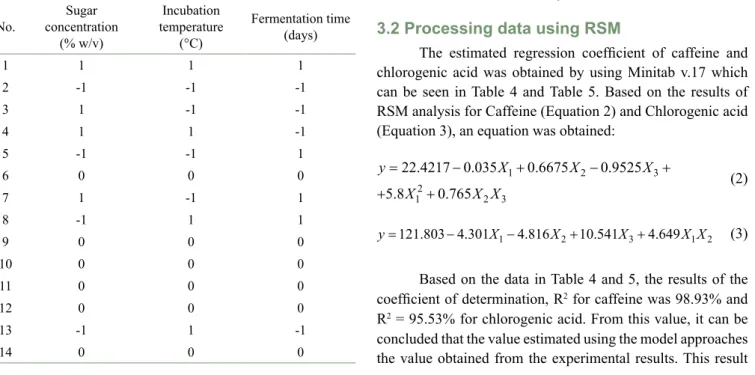
3.2 Processing data using RSM
The estimated regression coefficient of caffeine and chlorogenic acid was obtained by using Minitab v.17 which can be seen in Table 4 and Table 5. Based on the results of RSM analysis for Caffeine (Equation 2) and Chlorogenic acid (Equation 3), an equation was obtained:
(1) 2 2 0 1 1 2 2 3 3 4 1 5 2 2 6 3 7 1 2 8 1 3 9 2 3 Y X X X X X X X X X X X X
Where Y = estimated results, β0 = intercept coefficient, β1X1 + β2X2 + β3X3 = linear component, β4X12 + β
5X22 +β6X32 = quadratic component, β7X1X2 + β8X1X3 + β9X2X3 = interaction component, while the independent variables were sugar concentration (X1), temperature incubation (X2) and fermentation time (X3).
The coded value of this study can be seen in Table 1. Table 1 shows the coded values of the three parameters used in this study. The lowest coded value was -1, the middle value was 0, and the highest value was 1. The results of the RSM modeling using the central composite experimental design (CCD) can be seen in Table 2.
Table 1: The codification of the research variables.
Factors Original value Coded values Low mid high low mid high Sugar concentration (% w/v) 5 7.5 10 -1 0 1
Incubation temperature (°C) 25 31 37 -1 0 1 Fermentation time (days) 6 12 18 -1 0 1 Table 2: The number of samples obtained from RSM by using a program of Minitab v.17.
No. concentration Sugar (% w/v) Incubation temperature (°C) Fermentation time (days) 1 1 1 1 2 -1 -1 -1 3 1 -1 -1 4 1 1 -1 5 -1 -1 1 6 0 0 0 7 1 -1 1 8 -1 1 1 9 0 0 0 10 0 0 0 11 0 0 0 12 0 0 0 13 -1 1 -1 14 0 0 0 (2) (3) 1 2 3 2 1 2 3 22.4217 0.035 0.6675 0.9525 5.8 0.765 y X X X X X X 1 2 3 1 2 121.803 4.301 4.816 10.541 4.649 y X X X X X
Based on the data in Table 4 and 5, the results of the coefficient of determination, R2 for caffeine was 98.93% and
R2 = 95.53% for chlorogenic acid. From this value, it can be
concluded that the value estimated using the model approaches the value obtained from the experimental results. This result
Table 3: Caffeine and chlorogenic acid content from Robusta green coffee fermentation using a kombucha culture by using HPLC on 14 combination samples obtained from the study design using Minitab v.17.
No. Sugar concentration(% w/v) Incubation temperature(°C) Fermentation time(days) Caffeine concentration (mg/L) acid concentration (mg/L)Chlorogenic
1 1 1 1 28.72±3.17 127.47±1.15 2 -1 -1 -1 29.21±1.44 128.75±1.47 3 1 -1 -1 29.34±0.35 105.15±0.61 4 1 1 -1 29.12±1.23 109.18±2.01 5 -1 -1 1 26.10±1.52 144.37±1.08 6 0 0 0 22.10±1.51 119.47±1.02 7 1 -1 1 25.58±0.76 132.17±1.09 8 -1 1 1 28.69±2.28 129.33±1.67 9 0 0 0 23.16±2.67 119.98±2.68 10 0 0 0 22.12±3.49 120.45±3.61 11 0 0 0 22.97±2.23 121.02±2.22 12 0 0 0 21.98±0.91 119.29±2.41 13 -1 1 -1 29.04±3.05 105.93±0.29 14 0 0 0 22.20±1.63 122.68±0.95
Table 4: Estimated regression coefficients for caffeine.
Term Coef SE Coef T P
Constant 22.4217 0.1721 130.269 0.000 X1-Sugar -0.0350 0.1491 -0.235 0.820 X2-Temperature 0.6675 0.1491 4.478 0.002 X3-Time -0.9525 0.1491 -6.390 0.000 X1-Sugar*X1-Sugar 5.8033 0.2277 25.488 0.000 X2-Temp*X3-Time 0.7650 0.1491 5.132 0.001 S = 0.421602 PRESS = 2.82743 R-Sq = 98.93% R-Sq(pred) = 97.86% R-Sq(adj) = 98.25% Table 5: Estimated regression coefficients for chlorogenic acid.
Term Coef SE Coef T P
Constant 121.803 0.7198 169.223 0.000 X1-Sugar -4.301 0.9522 -4.517 0.001 X2-Temperature -4.816 0.9522 -5.058 0.001 X3-Time 10.541 0.9522 11.071 0.000 X1-Sugar*X2-Temp 4.649 0.9522 4.882 0.001 S = 2.69315 PRESS = 277.026 R-Sq = 95.53% R-Sq(pred) = 81.03% R-Sq(adj) = 93.54%
shows that the value of R2 = 98.93% for caffeine and R2 =
95.53% for chlorogenic acid from the total value of variation is represented by the results of the test.
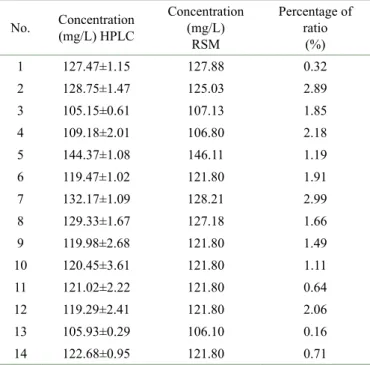
A comparison table of the results of the analysis of caffeine and chlorogenic acid content using HPLC compared with the results of calculations using the RSM equation can be seen in Tables 6 and 7.
The data in Tables 6 and 7 revealed that the comparison of the caffeine analysis using HPLC or RSM equation shows a percentage ranging from 0.17% - 3.19%, while the chlorogenic acid test results obtained ranged from 0.32% - 2.99%. These results indicate that the two methods give similar results of caffeine and chlorogenic acid content.
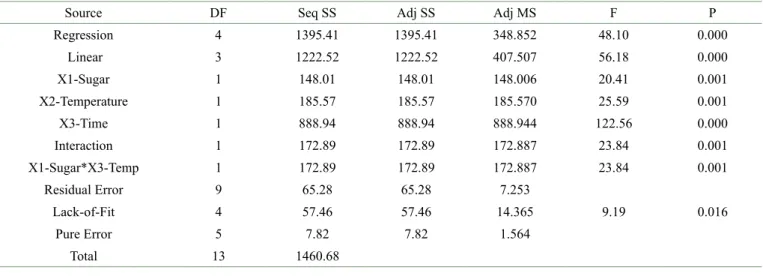
3.3 ANOVA test
According to the ANOVA test result in Tables 8 and 9, the P regression value of caffeine and chlorogenic acid was 0.000, indicating that the three variables, sugar concentration, incubation temperature and incubation time have significant (P <0.01) affect the caffeine and chlorogenic acid concentrations.
Table 6: Comparison of caffeine content based on HPLC analysis with RSM calculations.
No. Concentration(mg/L) HPLC Concentration (mg/L) RSM Percentage of ratio (%) 1 28.72±3.17 28.67 0.17 2 29.21±1.44 29.31 0.34 3 29.34±0.35 29.24 0.34 4 29.12±1.23 29.04 0.28 5 26.10±1.52 25.87 0.88 6 22.10±1.51 22.42 1.43 7 25.58±0.76 25.80 0.85 8 28.69±2.28 28.74 0.17 9 23.16±2.67 22.42 3.19 10 22.12±3.49 22.42 1.34 11 22.97±2.23 22.42 2.39 12 21.98±0.91 22.42 1.96 13 29.04±3.05 29.11 0.24 14 22.20±1.63 22.42 0.98
Table 7: Comparison of chlorogenic acid content based on HPLC analysis with RSM calculations.
No. Concentration(mg/L) HPLC Concentration (mg/L) RSM Percentage of ratio (%) 1 127.47±1.15 127.88 0.32 2 128.75±1.47 125.03 2.89 3 105.15±0.61 107.13 1.85 4 109.18±2.01 106.80 2.18 5 144.37±1.08 146.11 1.19 6 119.47±1.02 121.80 1.91 7 132.17±1.09 128.21 2.99 8 129.33±1.67 127.18 1.66 9 119.98±2.68 121.80 1.49 10 120.45±3.61 121.80 1.11 11 121.02±2.22 121.80 0.64 12 119.29±2.41 121.80 2.06 13 105.93±0.29 106.10 0.16 14 122.68±0.95 121.80 0.71
3.4 Optimization of the fermentation of kombucha coffee
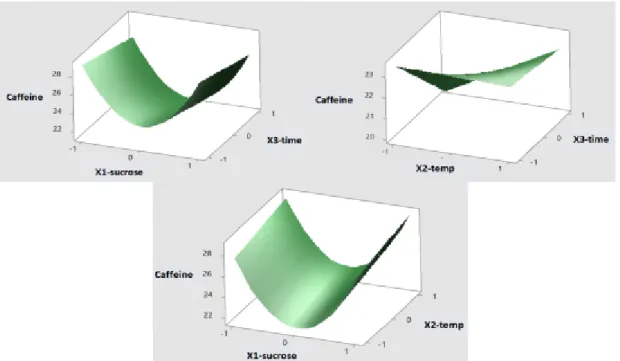
The results of the optimization test for fermentation of caffeine and chlorogenic acid content using 3 parameters, sugar concentration, incubation temperature and incubation time can be seen in Figure 1 and Figure 2. Figure 1 shows a caffeine content which is influenced by the sugar concentration and incubation time. It can be seen from the results of the surface plots that indicate the presence of optimum points. The chlorogenic acid didn’t show an optimum point from the calculation of RSM (Figure 2).
3.5 The study of RSM method
The calculations of RSM can be concluded in Table 10. The optimum results of caffeine and chlorogenic acid levels from green coffee kombucha with three conditions, sugar concentration, incubation temperature and fermentation time showed the highest results at 6.77% sugar concentration, an incubation temperature of 25 °C and an incubation time of 18 days. The caffeine content reached 20.56 mg/L, while the chlorogenic acid content was 138.78 mg/L.
Kombucha is commonly used in the traditional fermentation of tea by adding sugar and kombucha so it produces a slightly sour taste to a strong acid depending on the amount of sugar used, fermentation time and temperature (Lee, 2014). The kombucha culture can grow at temperatures of 20-50 °C with a different growing speed (El-Salam, 2012). Meanwhile, sugar addition was used as the carbon source for kombucha to grow. The concentration of 10% w/v was chosen as the highest concentration due to the research conducted by El-Salam (2012) which concluded that the sucrose addition of 10% w/v resulted in the thickest nata. The yeast which is used in a medium with high glucose will synthesize glucose about 3-20% meanwhile the excess glucose will be used in the fermentation process (Moat; Foster; Spector, 2002). In the present study, kombucha vinegar was also added to provide the first nutrition for the bacteria because it contains glucose and alcohol. Along with the fermentation occurred, there was a symbiosis between bacteria (Acetobacter xylinum) and aerobic yeast (Saccharomyces cerevisiae). Due to the yeast, the porous cloth was used to keep the air circulation. During the fermentation, the jar should be not to shake or move because it can affect the culture growth where the cellulose fibers cannot be a good array.
The optimization resulted in an increase in the concentration of chlorogenic acid by increasing the incubation time. But, it cannot be concluded when the formation of chlorogenic acid stops because the maximum incubation time used in this study was only 18 days. The results show that the RSM analysis did not show a significant difference compared with HPLC. The percentage has a similar value, about
0.1-Table 8: Analysis of variance for caffeine.
Source DF Seq SS Adj SS Adj MS F P
Regression 5 130.984 130.984 26.197 147.38 0.000 Linear 3 10.832 10.832 3.611 20.31 0.000 X1-Sugar 1 0.010 0.010 0.010 0.06 0.820 X2-Temperature 1 3.564 3.564 3.564 20.05 0.002 X3-Time 1 7.258 7.258 7.258 40.83 0.000 Square 1 115.470 115.470 115.470 649.63 0.000 X1-Sugar*X1-Sugar 1 115.470 115.470 115.470 649.63 0.000 Interaction 1 4.682 4.682 4.682 26.34 0.001 X2-Temp*X3-Time 1 4.682 4.682 4.682 26.34 0.001 Residual Error 8 1.422 1.422 0.178 Lack-of-Fit 3 0.138 0.138 0.046 0.18 0.907 Pure Error 5 1.284 1.284 0.257 Total 13 132.406
Table 9: Analysis of variance for chlorogenic acid.
Source DF Seq SS Adj SS Adj MS F P
Regression 4 1395.41 1395.41 348.852 48.10 0.000 Linear 3 1222.52 1222.52 407.507 56.18 0.000 X1-Sugar 1 148.01 148.01 148.006 20.41 0.001 X2-Temperature 1 185.57 185.57 185.570 25.59 0.001 X3-Time 1 888.94 888.94 888.944 122.56 0.000 Interaction 1 172.89 172.89 172.887 23.84 0.001 X1-Sugar*X3-Temp 1 172.89 172.89 172.887 23.84 0.001 Residual Error 9 65.28 65.28 7.253 Lack-of-Fit 4 57.46 57.46 14.365 9.19 0.016 Pure Error 5 7.82 7.82 1.564 Total 13 1460.68
3.19% for caffeine and 0.32-2.99% for chlorogenic acid. The optimum sugar concentration from fermented Robusta green coffee beans using a kombucha culture was 6.77%. During the fermentation process Acetobacter xylinum breaks down sucrose into glucose and fructose (Chen; Liu, 2000), then it is continuously transformed into organic acids and alcohol until the sugar runs out, the acidity will also increase during the fermentation process. In the fermentation process, the sugar is used as a source of nutrients and will be converted into alcohol and CO2. CO2 gas will react with water vapor and form carbonic acid which can provide carbonation effects on alcoholic beverages, as well as in kombucha drinks. According to Kim and Gadd (2008), the Acetobacter xylinum is an over-oxidizer which can convert acetic acid into CO2 and H2O gas. Acetic acid is used by Acetobacter xylinum as a substrate to generate the optimum conditions for its growth and to form CO2 and H2O gases. In contrast,
the caffeine reduction in the fermentation of kombucha coffee was caused by the kombucha culture which oxidized the atom of carbon in the position of C-8. The enzyme of caffeine oxidase played a role in the first degradation which produced 1,3,7-trimethylouric acid. The presence of bacteria would reduce the caffeine concentration with the main route of theobromine to 7-methylxanthine then into xanthine (Mazzafera, 2004).
The optimum incubation temperature calculated using RSM was 25 °C. It shows that temperature plays a significant role in determining the fermentation rate and the composition of the final fermentation product. Kombucha requires an optimal temperature range between 23-29 °C. In this study, the incubation temperature was 31 °C. It was intended to determine the extent of yeast growth in SCOBY which generally grows and develops in a temperature range of 25-30 °C. According to Sibirny (2017), the optimal
Figure 1: Response surface plot of caffeine content from sugar concentration, incubation temperature and incubation time based on the central composite experimental design results.
Figure 2: Response surface plot of chlorogenic acid content from sugar concentration, incubation temperature and incubation time variables based on the results of the central composite experimental design.
temperature for ethanol fermentation is 25-35 °C. While the temperature at 37 °C was intended to determine the growth rate of bacteria which generally grows optimally at an incubation temperature of 37 °C. The kombucha fermentation process must produce an optimal pH between 2.5-3.5 (Naland, 2004). The low pH of kombucha can
prevent other bacteria to grow because the environment is not optimal for survival or reproduction. This condition lead the desired bacteria for fermentation grow properly (May et al., 2019). Thus the appropriate incubation temperature will support the growth of kombucha colonies and increase the quality of the kombucha products produced.
The optimum incubation time obtained from the RSM calculation was 18 days. This study revealed that the kombucha fermentation process was longer than the theoretical incubation period required, which is 8-14 days. This condition was supposedly due to the phase lag (adaptation) shift, where the theoretical incubation of 8-14 days was obtained by using the fermentation medium of tea shifted to 18 days by using a fermentation medium of green coffee.
During the fermentation process, the formation of new kombucha cultures will continue until it becomes ideal and obtain the optimum concentration of caffeine and chlorogenic acid. The kombucha fermentation process is influenced by several environmental factors such as the amount of inoculum, incubation temperature, pH and initial sucrose levels (Mueller, 2014).
4 CONCLUSIONS
The analysis by using RSM did not give a significant difference compared to HPLC. The percentage was similar, about 0.17-3.19% for caffeine and 0.32-2.99% for chlorogenic acid. The optimum condition was obtained when the concentration of sugar was 6.77%, incubation temperature was 25 °C, and the incubation time was 18 days. Therefore, RSM can be developed as a reference to optimize the other parameters to increase the quality of fermented samples.
5 REFERENCES
AMBATI, P.; AYYANNA, C. Optimizing medium constituents and fermentation condition for citric acid production from palmyra jaggery using responds surface method. World Journal of Microbiology and
Biotechnology, 17(4):331-335, 2001.
CHANG, Y. C.; LEE, C. L.; PAN, T. M. Statistical
optimization of media components for the production of Antrodia Cinnamomea AC0623 in submerged cultures.
Applied Microbiology and Biotechnology,
72(4):654-661, 2006.
CHEN, C.; LIU, B. Y. Changes in major components of tea fungus metabolites during prolonged fermentation.
Journal of Applied Microbiology, 89(5):834-839,
2000.
CHILDS, E.; CHILDS, J. Kombucha! The amazing probiotic tea that cleanses, heals, energizes, and
detoxifies. New York: Penguin Random House Company, p.67-89, 2013.
CHU, Y. F. Coffee: Emerging health effects and disease prevention. Iowa, Wiley-Blackwell, West Sussex and Oxford, 2012. 352p.
CORNELIS, M. C. Toward systems Epidemiology of Coffee and Health. Current Opinion in Lipidology, 26(1):20-29, 2015.
EL-SALAM, S. S. A. Bacterial cellulose of kombucha mushroom tea. New York Science Journal, 5(4):81-87, 2012.
FARAH, A. Coffee Constituents. In: CHU, Y. F. Coffee: Emerging health effects and disease prevention. 1st ed. USA: Blackwell Publishing Ltd., p.21-50, 2012. FARAH, A. et al. Chlorogenic Acids And Lactones In
Regular And Water-Decaffeinated Arabica Coffee.
Journal of Agricultural and Food Chemistry,
54(2):374-381, 2006.
JAYABALAN, R. et al. Changes in free-radical scavenging ability of kombucha tea during fermentation. Food
Chemistry, 109(1):227-234, 2008.
KIM, B. H.; GADD, G. M. Bacterial physiology and
metabolism. USA: Cambridge University Press, p.78-90,
2008.
LEE, S. Kombucha revolution: 75 recipes for homemade brews, fixers, elixirs, and mixers. United States: Ten Speed Press, p.56-67, 2014.
LOTFY, W. A.; GHANEM, K. M.; ELHELOW, E. R. Citric acid production by novel Aspergillus niger isolate: II. optimization of process parameter through statistical experiment designs. Bioresource Technology, 98(18):3470-3477, 2007.
MAY, A. et al. Kombucha: A novel model system for cooperation and conflict in a complex multi-species microbial ecosystem. PeerJ, 7:e7565. 2019. MAZZAFERA, P. Catabolism of caffeine in plants and
microorganisms. Frontiers in Biosciences, 1(9):1348-59, 2004.
MOAT, A. G.; FOSTER, J. W.; SPECTOR, M. P. Microbial
Physiology. New York: Wiley-Liss, Inc. 2002. 734p.
Table 10: Results of optimization using the RSM method.
Optimum Sugar Concentration (X1) Optimum Incubation Temperature (X2) Optimum Incubation Time (X3) Estimated Caffeine
Concentration Estimated Chlorogenic acid Concentration
MUELLER, J. Delicious probiotics drinks: 75 recipes for kombucha, kefir, ginger beer, and other naturally fermented drinks. New York: Skyhorse Publishing, p.45-78, 2014.
MURSU, J. et al. The effects of coffee consumption on lipid peroxidation and plasma total homocysteine concentrations a clinical trial. Free Radical Biology and
Medicine, 38(4):527-534, 2005.
MYERS, R. H.; MONTGOMERY, D. C.; ANDERSON-COOK, C. M. Response surface methodology: Process and optimization using designed experiment. New York: John Wiley & Sons, p.34-56, 2009.
NALAND, H. Kombucha: Teh ajaib pencegah dan penyembuh aneka penyakit. Indonesian: AgroMedia Pustaka, Jakarta. 2004. 56p.
NOFEMELE, Z. et al. Improvement of ethanol production from sugarcane molasses through enhanced nutrient supplementation using saccharomyces cerevisiae. Journal
of Brewing and Distilling, 3(2):29-35, 2012.
RAMACHANDRAN, V. S. Encyclopedia of the Human Brain. vol. 4. New York: Academic Press, Inc., p.188-190, 2002. REVUELTA-INIESTA, R.; AL-DUJAILI, E. A. Consumption
Of Green coffee reduces blood pressure and body
composition by Influencing 11ß-HSD1 enzyme activity in healthy individuals: A pilot crossover study using green and black coffee. Biomed Research International, 2014. Available in: <http://downloads.hindawi.com/ journals/bmri/2014/482704.pdf>. Access in: August, 17, 2020.
RYAN, L.; HATFIELD, C.; HOFSTETTER, M. Caffeine Reduces Time-Of-Day Effect on Memory Performance in Older Adult. Psychological Science, 13(1):68-71, 2002.
SCHIEBER, A.; SALDANA, M. D. A. Potato peels: A Source of nutritionally and pharmacologically Interesting Compounds – A Review. Global Science Books, 3(2):23-28, 2009.
SIBIRNY, A. A. Biotechnology of yeasts and
filamentous fungi. Springer International Publishing,
p.1-38, 2017.
SZENTHE, A. Top Coffee Producing Countries. 2019. Available in: <https://www.worldatlas.com/articles/top-coffee-producing-countries.html>. Access in: April, 7, 2020.
TEOH, A. L.; HEARD, G.; COX, J. Yeast Ecology of Kombucha Fermentation. International Journal of Food