Psychological well-being and health perception: predictors for past,
present and future
Â
ngelal
eite1 https://orcid.org/0000-0003-0560-1756a
naR
amiRes1 https://orcid.org/0000-0002-3028-0563a
ndReiadem
ouRa2 https://orcid.org/0000-0003-4836-3794t
eResas
outo2 https://orcid.org/0000-0001-7268-1747J
oãom
aRôco3 https://orcid.org/0000-0001-9214-53781 Universidade Europeia, Lisboa, Portugal.
2 Faculdade de Psicologia, Educação e Desporto, Universidade Lusófona do Porto, Porto, Portugal.
3 William James Center for Research, Instituto Superior de Psicologia Aplicada – Instituto Universitário (ISPA-IU), Lisboa, Portugal.
Received: 05/03/2018 – Accepted: 05/21/2019 DOI: 10.1590/0101-60830000000194
Abstract
Background: Increasing evidence supports an association between psychological well-being and overall health, however, much remains to be understood about this association. Objectives: The current study addresses this issue by presenting a new perspective focusing on health perceptions. Additionally, it examines the impact of each of six dimensions of psychological well-being on health perception. Methods: Data for this study were collected from a sample of 1,155 Portuguese adults in various settings. Results: Findings reveal that psychological well-being dimensions' impact differently on prior, current, and health outlookperceptions. Furthermore, the dimension depressed mood influences current health perception; in turn, current health perception is the strongest predictor for psychological well-being. Discussion: Our results provide support for a bidirectional relationship between health perception and psychological well-being.
Leite A et al. / Arch Clin Psychiatry. 2019;46(3):53-60
Keywords: Psychological well-being, health perception, prior health perception, current health perception, health outlook perception.
Address for correspondence: Ângela Leite. Universidade Europeia. Quinta do Bom Nome, Estr. Correia 53 – 1500-210 – Lisboa, Portugal. Telephone: (351) 210 309 900. E-mail: [email protected]
Introduction
Well-being has been well studied over recent decades1,2 and,
consequently, substantial progress has been made regarding its conceptualization and assessment. Health is an important dimension of psychological well-being3, and there is a consensus that it is more
than just the absence of mental illness or physical infirmity4. There is
also clear evidence that psychological well-being influences health in general5. However, there might be a discrepancy between perceived
health and actual health6. Therefore, it is important to know how
health perceptions have an impact on psychological well-being. Although some authors claim that the relationship between psychological well-being and health perception is bidirectional, which makes it almost impossible to separate the two concepts, clearly5, this relationship is not yet well understood7,8. Furthermore, in
Portugal, research on well-being has not received enough attention9.
The current study aimed to fulfil these research gaps namely by exploring the relation between psychological well-being and health perception in a Portuguese sample. In addition, the impact of each dimension of psychological well-being on health perception was also addressed.
Overview of the literature
There are two main approaches to the concept of well-being: a subjective one focused on overall life satisfaction and happiness that distinguishes between positive and negative effects and a psychologic one that defines well-being as actualization of human potentials2.
The psychological approach draws attention to formulations of
human development and life’s existential challenges and comprises different dimensions5. Although the two approaches have grown
separately, they are in fact conceptually related and may complement each other10; they represent different facets of positive psychological
functioning2. These different conceptions of well-being reflect the
following two philosophies regarding happiness: (1) a hedonic philosophy supporting the idea that happiness is analogous to subjective experiences of pleasure and satisfaction; and (2) an eudaemonist philosophy supporting the idea that happiness occurs when individuals perform personally expressive behaviors during meaningful goal pursuits11. The current study focuses on the hedonic
concept of psychological well-being as it is closer to the experience and easier to identify by participants.
Psychological well-being is a multidimensional construct comprising positive psychological and social functioning, including physical aspects12. In Huppert’s words, “It is the combination of feeling
good and functioning effectively”13 (p. 137). Along the same lines,
the 2011’s Eurobarometer Qualitative Survey on well-being defines psychological well-being as feeling good about oneself, believing in oneself and one’s values, self-realization, recognition and success.
The most significant models of psychological well-being are: Diener’s tripartite model of subjective well-being14 that presents three
related components of wellbeing: frequent positive affect, infrequent negative affect, and cognitive evaluations such as life satisfaction (hedonic well-being); Carol Ryff’s six-factor model of psychological well-being5 that includes self-acceptance, autonomy, positive relations
with others, environmental mastery, purpose in life and personal growth (eudaimonic well-being); Keyes’s flourishing model2 that
psychological well-being, and social well-being (together, eudaimonic well-being); and Seligmann’s positive psychology, concerned with eudaimonic well-being, that distinguishes between three types of happy life (pleasant, good and meaningful).
Although psychological well-being has shown some temporal stability across life span14, it can be influenced by several factors
(e.g., life events, psychological processes, illnesses)15, with increasing
levels of life satisfaction as age increases16, except for women17. The
U-shaped relation between well-being and age is not universal and, according to the Gallup World Poll, is confined to high-income countries18.
Health perception and psychological well-being
Health perception is the individual assessment of his or her own personal health. A growing number of empirical studies have found that psychological well-being significantly influences health in general, and is associated with better health5. For instance, a study
on self-reported health over 9-10 years found that people with high levels of well-being presented better health indexes over time than those with lower levels of well-being19. Likewise, the results of a
meta-analytic review20 indicates a positive association between
psychological well-being and reduced mortality in population with health problems, namely, cardiovascular diseases, renal failure and immunodeficiency virus-infection. People may perceive themselves as healthy even though they suffer from a chronic disease, whereas they may perceive themselves as ill without having any disease. Thus, one’s health perception is particularly relevant to psychological well-being. A body of research has documented that higher psychological well-being is associated with higher self-rating health21.
Demographic factors influence health perception, and age is one of the most significant one. Older people frequently report their health as being poor and very poor compared to individuals under 25 years of age21, which may be explained by chronic diseases, prevalent
among older people. As for gender-related differences, so far, results have been inconclusive although some studies found no statistically significant gender differences21.
Prior and current health
Research conducted by Ware22 on the association between prior and
current health suggests that high scores for current health reflect upon a positive perception of both present and prior health and, albeit to a lesser extent, a positive future health or health outlook. Furthermore, health perception was found to be positively associated with other health variables pertaining to health states, such as psychological well-being, and negatively associated with other variables related to poor health, such as “bed days”. Correlations between current health and other health variables tended to be higher for feelings of general health, pain, and worry than for variables more directly observable, such as “bed days” and activity limitations. Both current health and prior health were negatively associated with illness’ behaviors. Current health, prior health, and future health scale scores were significantly negatively correlated with age. Current health scores were associated with both mental and physical health variables.
As mentioned earlier, previous research has found that the association between health and psychological well-being is bidirectional23 – health influences psychological well-being
and psychological well-being also influences health. However, psychological well-being is a multidimensional concept and each dimension may have a different impact on health. Based on the fact that this subject has not yet been properly addressed, the current study aims: (i) to explore the association between psychological well-being and health perceptions (self-assessed) and (ii) to investigate the impact of each of the six dimensions of psychological well-being established by Dupuy24. The following hypotheses were
formulated: (H1) health perception would predict psychological well-being. Specifically, positive prior, current and future health
perceptions would be associated with higher levels of psychological well-being; (H2) psychological well-being would predict health perception. Specifically, higher levels of psychological well-being would be associated with more positive prior, current and future health perceptions and (H3) the six dimensions of psychological well-being established by Ware22 would have a different impact on
prior, current and future health perceptions. Given the heterogenous results of previous research, no hypotheses were formulated regarding gender or age. Additionally, previous studies on measures’ validity were performed.
Methods
Sample
The sample comprised 1,155 respondents, being 69% female. The average age was 31.53 years-old (ranged between 18 and 79 years,
SD = 13.53 years old). Regarding educational level, most of the
respondents (44%) had reached an higher education level (41% had a bachelors’ degree and 3% postgraduate studies). One percent had basic education (9 years) and the remaining had completed secondary school (12 years of schooling). The sample was a convenience non-probabilistic sample, so, it is not representative of the population.
Procedures
Participants were recruited in multiple settings between 2015 and 2017 (universities, health and community centers), having participated voluntarily. The inclusion criteria were: (1) to be over 18 years of age and (2) to understand either the issues raised to give the informed consent or the items from the questionnaire. The only exclusion criterion was cognitive and psychophysiological impairment. In the information to the participant, researchers made a brief presentation and provided simple description of the study and its procedures and an assurance of confidentiality. The questionnaires were administered in each of the multiple settings, in a private, quiet room. All subjects gave their informed consent to participate in the study. The study protocol was approved by the Ethical Committee of Universidade Europeia, Portugal.
Measures
The sociodemographic questionnaire included questions about sex, age and literacy.
Psychological well-being was assessed with the Psychological
General Well Being Index (PGWBI), an inventory designed by
Dupuy24 to assess subjective perception of psychological well-being;
PGWB measures self-representations of intrapersonal affective or emotional states reflecting a sense of subjective well-being or distress. The choice of Dupuy’s instrument relies on its multidimensionality, reflecting the concept of psychological well-being. This instrument includes a set of factors that together assess psychological well-being; although vitality is theoretically more affected by age and disease, individuals’ assessment cannot rule out. PGWBI is a revised version of the General Well Being schedule (GWB) and comprises six sub-scales assessing positive and negative affective states – anxiety,
depressed mood, positive well-being, self-control, general health and vitality (Table 1) – experienced during the past month, on a
six-point Likert type scale (0 = absence of psychological well-being; to 5 = high levels of well-being), according to the intensity or frequency of the affective experience. The overall score ranges between 0 and 110 and the range for the subscales’ scores is between 0 and 15, or 20 and 25. Results can be analysed globally or considering subscale’s scores. Scores between 0 and 60 reflect severe distress, between 61 and 72 reflect moderate distress, and between 73 and 110 point to a
Although this instrument includes three items (which give rise to the general health factor) about health, they do not replace most of the items of the instrument used to measure health perception.
The Health Perceptions Questionnaire (HPQ) Form II22 was
used to assess health’s subjective evaluations. The questionnaire includes both physical and mental health. It consists of 32 items, of which 26 measure perceptions of prior health, current and future
health, resistance/susceptibility to illness, health concerns, sickness orientation (Table 2), and the remaining six items evaluate rejection of sick role, and attitude toward going to the doctor. High scores on four
subscales (current health, prior health, future health and resistance to
illness) indicate positive health perceptions and high scores on two
subscales (health concerns and sickness orientation) indicate negative health perceptions. Twenty-two of the questions from the HPQ were used to calculate the General Health Rating Index (GHRI) score, ranging from 22 to 110, allowing assessment of health perception over time (past, present and future).
Both scales have been widely used over time for diverse populations25-27.
Data analysis
Statistical analyses were performed using SPSS Statistics and AMOS, version 24 (SPSS, An IBM Company, Chicago, IL). Quantitative data were checked for univariate and multivariate normality, by examining the values of skewness (Sk) and univariate and multivariate kurtosis (Ku)28.
To accomplished preliminar studies about validity of the measures, a confirmatory factor analysis (CFA) for PGWBI and HPQ was performed with maximum likelihood estimation (ML). Both PGWBI and HPQ were conceptualized as second order latent variables. In addition to the chi-square goodness-of-fit statistic, a two-index strategy was applied to assess the model fit of the data29.
The following statistics and recommended cut-off values were used to evaluate overall model fit: Normed Chi-square (c2/df < 3, considered
acceptable30), Standardized root mean residual (SRMR close to .08,
considered good29), Comparative Fit index (CFI>.95, considered
good29) and Root mean square error of approximation (RMSEA <
.07 with the upper limit of the 90% confidence interval less than .08, considered adequate). Multivariate outliers were identified with the Mahalanobis’ squared distance. The improvement of model fit was based on Modification Indexes (MI > 11), and according to the theoretical content of each item; to compare the original model versus the parsimony model, each of the models was evaluated using
a comparative fit index, the Modified expected cross-validation index (MECVI), and the chi-square difference test31.
Reliability for each scale was assessed by composite reliability (.60 < CR < .70, considered to be acceptable; CR ≥ .70 good28). The
four components of the validity of the measuring instrument were analysed: content validity through the literature review; factor validity in accordance with the items’ standardized loadings (λ ≥ .50 or .70 ideally) and individual reliability (R2 ≥ .25); convergent validity by the
value of the average variance extracted by the factors (AVE ≥ .50)28.
Factors’ discriminant validity was evaluated comparing AVE values with factors’ correlations (AVE ≥ squared correlation).
To test predictors, a regression analysis was performed verifying what potential predictor variables were associated to the outcome variable. Only the variables that were significantly associated to the outcome variable were included in the regression analysis.
Results
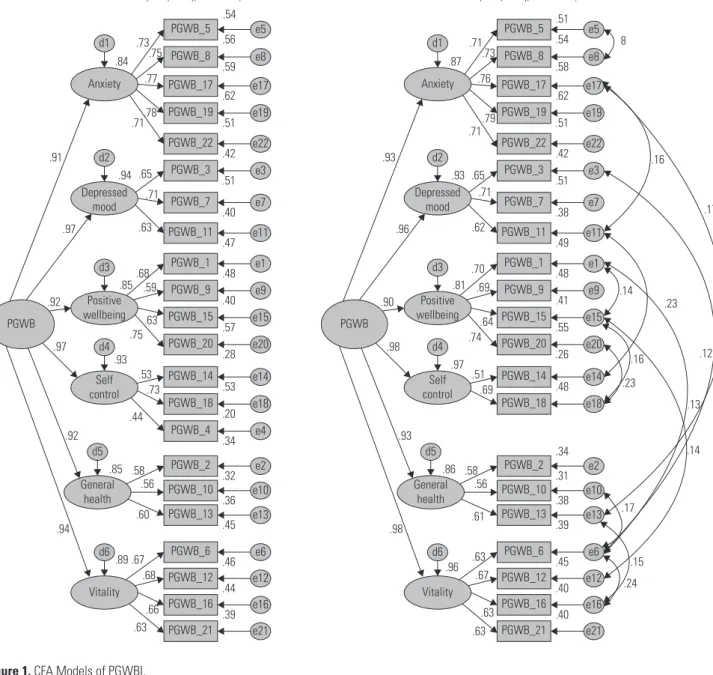
For PGWBI, the model structure comprised six latent variables and 22 observed variables (items). The items did not present severe violations of univariate normality (|sk| < 1.58 e |ku| < 3.16), however they presented violation of multivariate normality (ku = 98.99, p < .001). The PGWBI model revealed a poor fit to the data: χ2 (203) =
1137.513, p < .001; χ2/df = 5.604; RMSEA = .065 with 90% confidence
interval (.062, .069); SRMR = .0552; CFI = .911; MECVI = 1.148 (Figure 1, Model 1). To improve the model 1 fit, the 74 multivariate outliers and item 4 were removed and, then, measurement errors between items were co-variated, namely between items on the basis of the item content (5 and 8;1 and 15; 6 and 16), and between the item complementary content (17 and 11; 17 and 13; 3 and 6;11 and 14; 1 and 6; 15 and 12; 15 and 12; 20 and 18; 10 and 6; 13 and 6). The re-specified model showed a better fit to the data: RMSEA, SRMR and CFI indicate good fit, and χ2/df suggests acceptable fit
(χ2 (170) = 640.086, p < .001; χ2/df = 3.765; RMSEA = .051, IC90:
(.046, .055); SRMR = .0329; CFI = .954; MECVI = .709) (Figure 1, Model 1 – Modified).
Comparing these two models, the former presented a lower value of MECVI and the chi-square difference test was significant (χ2 (38)
= 864.497, p < .001). All items presented good factorial validity (.56 ≤ l ≤ .76) and individual reliability (R2 ≥ .26). The factors internal
reliability was acceptable, except for self-control. The model presented composite reliability for the PGWBI total (.98) and for all PGWBI factors with the exception of general health and self-control. Only the factor anxiety presented convergent validity (Table 3).
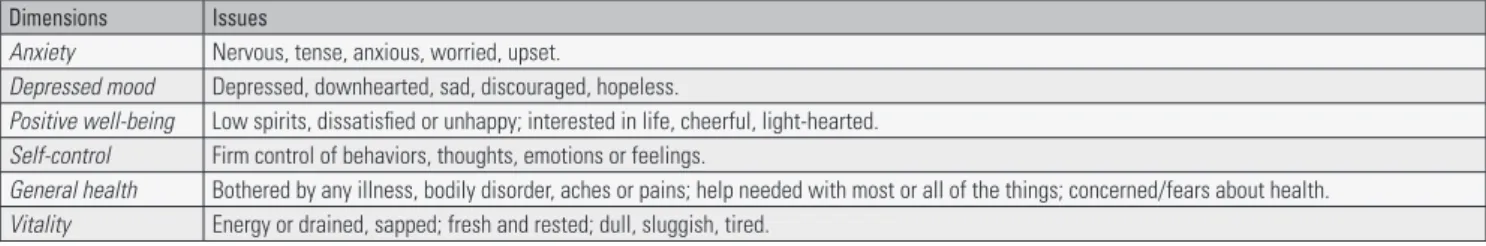
Table 1. The Psychological General Well Being Index (PGWBI)
Dimensions Issues
Anxiety Nervous, tense, anxious, worried, upset.
Depressed mood Depressed, downhearted, sad, discouraged, hopeless.
Positive well-being Low spirits, dissatisfied or unhappy; interested in life, cheerful, light-hearted.
Self-control Firm control of behaviors, thoughts, emotions or feelings.
General health Bothered by any illness, bodily disorder, aches or pains; help needed with most or all of the things; concerned/fears about health.
Vitality Energy or drained, sapped; fresh and rested; dull, sluggish, tired.
Source: PGWBI adapted from Dupuy24 (1984).
Table 2. The Health Perceptions Questionnaire (HPQ) Form II
Dimensions Issues
Prior health Bed days; being sick or ill; thinking that might die.
Current health Bad/excellent current health; healthier/not healthier than other people, than before, than anyone; doctors confirm health status.
Health outlook Better/worse health in the future than now, than other people in the future; expectations to be healthy; afraid to be sick in the future.
Resistance to illness Get sick easier/harder than other people; bodily resistance to illness; perception of something going around.
Health worry/concern Worried about health; worried about health more than other people; health concerns; more health concern than other people.
Sickness orientation Getting sick as being part of life; acceptance of being sometimes sick.
Table 3. Cronbach’s Alpha (a), composite reliability (CF), convergent (AVE) and discriminant validity of the PGWBI dimensions a CF AVE r2 1 2 3 4 5 6 1 Anxiety .86 0.86 0.55 2 Depressed mood .68 0.70 0.44 0.55 3 Positive well-being .76 0.79 0.48 0.70 0.44 4 General health .60 0.61 0.34 0.74 0.80 0.48 5 Self-control .51 0.54 0.37 0.84 0.90 0.78 0.34 6 Vitality .73 0.74 0.41 0.83 0.89 0.77 0.82 0.37 Model 1 Chi-square= 1137.513 df= 203 p= .000 Ratio= 5.604 RMSEA = .065 (.062; .069); CFI= .911; MECVI= 1.148
PGWB_5 d1 Anxiety Depressed mood PGWB d2 .84 .73 .54 .56 .75 .77 .78 .71 .94 .65 .63 .85.68.59 .63 .75 .71 .91 .97 .92 .97 .92 .93 .53 .73 .44 .85 .58 .56 .60 .89 .67 .68 .66 .63 .94 Positive wellbeing d3 Self control d4 General health d5 Vitality d6 e5 PGWB_8 .59 e8 PGWB_17 .62 e17 PGWB_19 .51 e19 PGWB_22 .42 e22 PGWB_3 .51 e3 PGWB_7 .40 e7 PGWB_11 .47 e11 PGWB_1 .48 e1 PGWB_9 .40 e9 PGWB_15 .57 e15 PGWB_20 .28 e20 PGWB_14 .53 e14 PGWB_18 .20 e18 PGWB_4 .34 e4 PGWB_2 .32 e2 PGWB_10 .36 e10 PGWB_13 .45 e13 PGWB_6 .46 e6 PGWB_12 .44 e12 PGWB_16 .39 e16 PGWB_21 e21 Model 1 - Modified Chi-square = 638.979 df = 170 p = .000 Ratio = 3.759 RMSEA = .051 (.046; .055); CFI = .954; MECVI = .707
PGWB_5 d1 Anxiety Depressed mood PGWB d2 .87 .71 .51 .54 .73 .76 .79 .71 .93 .65 .62 .81 .70 .69 .64 .74 .71 .93 .96 .90 .98 .93 .97 .51 .69 .86 .58 .56 .61 .96 .63 .67 .63 .63 .98 Positive wellbeing d3 Self control d4 General health d5 Vitality d6 e5 8 .16 .14 .23 .16 .23 .17 .12 .13 .14 .17 .15 .24 PGWB_8 .58 e8 PGWB_17 .62 e17 PGWB_19 .51 e19 PGWB_22 .42 e22 PGWB_3 .51 e3 PGWB_7 .38 e7 PGWB_11 .49 e11 PGWB_1 .48 e1 PGWB_9 .41 e9 PGWB_15 .55 e15 PGWB_20 .26 e20 PGWB_14 .48 e14 PGWB_18 .34 e18 PGWB_2 .31 e2 PGWB_10 .38 e10 PGWB_13 .39 e13 PGWB_6 .45 e6 PGWB_12 .40 e12 PGWB_16 .40 e16 PGWB_21 e21 For HPQ, the model structure comprised six latent variables
and 26 observed variables (items). All items met the assumption of univariate normality (|sk| < 1.26 e |ku| < 1.61), but not of multivariate normality (ku = 108.44, p < .001). Results of CFA indicated a poor model fit (χ2 (293) = 2359.534, p < .001; χ2/df =
8.053; RMSEA = .081, IC90: (.078, .084); SRMR = .0819; CFI = .716;
MECVI = 2.295) (Figure 2, Model 2). Model re-specification was conducted by deleting items with no factorial validity (items 17,
23, 10, 7, 3 e 5), and by allowing the covariance of residuals based on item content (22 and 30, 30 and 32, and 19 and 18) and item complementary (1 and 22, 4 and 30, 4 and 28, 9 and 26, 12 and 11, 12 and 18, and 26 and 32). The modified model provided a better fit to the data: RMSEA, SRMR and CFI indicated a good fit, and χ2/df
suggested acceptable fit (χ2 (54) = 208.675, p < .001; χ2/df = 3.864;
RMSEA = .051 (.044, .059); SRMR = .0442; CFI = .965; MECVI = .263) (Figure 2, Model 2 – Modified).
Comparison of competing models revealed that the modified model was more parsimonious and had better fit quality (χ2dif (239)
= 2150.859, p < .001). All items had factorial validity (.52 ≤ l ≤
.76) and good individual reliability (R2 ≥ .27). The factors’ internal
reliability was acceptable with the exception of health outlook. The model presented a good composite reliability for the HPQ (.76) and
Model 2 - Modified
Chi-square = 208.675 df = 54 p = .000 Ratio = 3.864 RMSEA = .051 (.044; .059); CFI = .965; MECVI = .263
Prior health Health outlook .40 HPQ_1 .38 e1 HPQ_4 e4 .39 HPQ_9 e9 .31 HPQ_12 e12 .47 .38 .61 .69 .72 .65 .52 .69 .74 .55 .63 .62 .62 .56 .76 .58 .67 .74 .50 .47 .71 .58 HPQ_22 e22 .34 HPQ_26 e26 .45 .55 HPQ_30 e30 HPQ_32 e32 .27 -.14 .23 -.21 .17 .14 -.28 -.34 .26 .19 .14 .42 .53 HPQ_11 e11 HPQ_19 e19 HPQ_28 e28 HPQ_5 e5 HPQ_18 e18 d3 d2 d1 Current health HPQ Health worry concern HPQ Resistance to illess Prior health Health outlook Sickness orientation e6 HPQ_6 e13 HPQ_13 e20 HPQ_20 e24 HPQ_24 e33 HPQ_33 e25 HPQ_25 e16 HPQ_16 .48 HPQ_1 .35 e1 HPQ_4 e4 .46 HPQ_9 e9 .33 HPQ_12 e12 .14 .48 .62 .38 .41 .33 .12 .02 .33 .08 .24 .49 .29 .57 .14 .35 .57 .64 .73 .65 .56 .69 .79 .62 .01 .70 .59 .68 .37 .77 .64 .56 .72 .58 -.08 .32 .56 .9 .29 .17 .24 .41 .00 .49 .05 .48 .48 1.04 1.02 .69 .69 .44 .19 HPQ_17 e17 .60 HPQ_22 e22 .41 HPQ_26 e26 .31 .53 HPQ_30 e30 HPQ_32 e32 .31 .42 .54 HPQ_11 e11 HPQ_19 e19 HPQ_28 e28 HPQ_5 e5 HPQ_18 e18 HPQ_23 e23 HPQ_10 e10 HPQ_3 e3 HPQ_7 e7 HPQ_15 e15 d5 d4 d3 d2 d1 d6 Current health Model 2 Chi-square = 2359.534 df = 293 p = .000 Ratio = 8.053 RMSEA = .081 (.078; .084); CFI = .716; MECVI = 2.295
current health (.85), and an acceptable composite reliability for health outlook (.60). All factors had discriminant validity (Table 4).
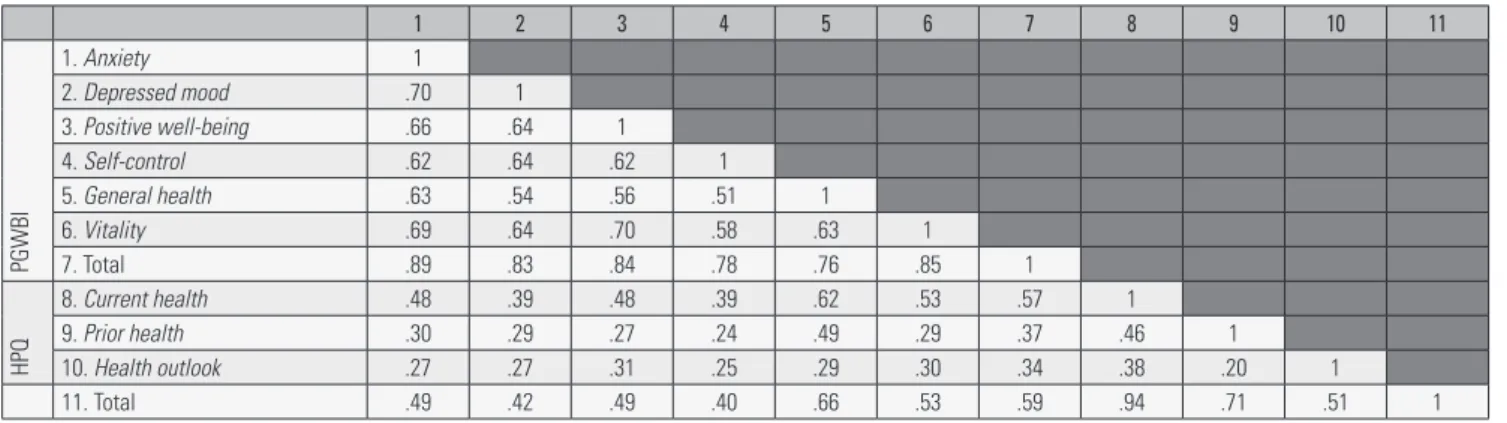
Positive and significant correlations were found between total HPQ and total PGWBI (r = .204; p < .001). Correlations between PGWBI and HPQ were positive and statistically significant (Table 5). Of interest for this study were the correlations between total PGWBI and total HPQ (r =.594) and current health perception (r =.573); and the correlations between general health and current health perception (r =.620) and total HPQ (r =.663).
A multiple regression analysis was conducted to examine the association between PGWBI and HPQ items (Table 6). Five models were analysed to test the predictive effects: of the HPQ factors on PGWBI (Model 1), of PGWBI factors on HPQ (Model 2); of PGWBI factors on prior health perception (Model 3), current health perception (Model 4) and health outlook perception (Model 5).
Findings indicate gender associations for the total PGWBI and the six PGWBI dimensions (gender was codified as 0 – male and 1 – female): total PGWBI score (r = -.156, p < .001), anxiety (r = -.129, p < .001), depressed mood (r = -.118, p < .001), positive
well-being (r = -.113, p < .001), self-control (r = -.136, p < .001), general health (r = -.073, p = .016) and vitality (r = -.203, p < .001). No gender
associations were found for HPQ.
Results point to a negative association between age and PGWBI. Age was found to be negatively related to the total PGWBI (r = -.114,
p < .001), and to the following four PGWBI dimensions: general health
(r = -.215, p < .001), anxiety (r = -.096, p = .002), positive well-being (r = -.116, p < .001) and vitality (r = -.070, p = .021). Age was also negatively associated with total HPQ (r = -.312, p < .001), prior health (r = -.233, p < .001), current health (r = -.299, p < .001), and health
outlook (r = -.109, p < .001) perceptions.
Discussion
Summarizing, in the present study, we suggested that HP and PWB would predict each other (H1 and H2), and that the six dimensions of PWB would have a different impact on prior, current and future health perceptions (H3). Three factors of HPQ were found to predict PGWBI. Thus, results validated our first hypothesis. Positive prior,
current and future health perceptions were found to be associated
with higher levels of PGWBI, and negative prior, current and future
health perceptions were associated with lower levels of PGWBI (Table
6, Model 1). Psychological well-being factors that were found to predict health perception were: general health, vitality and positive
well-being confirming H2 (Table 6, Model 2), and validating our
second hypothesis. As for our third hypothesis, only general health predicted prior health perception (Table 6, Model 3). Four PGWBI factors (general health, vitality, positive well-being and depressed
mood) predicted current health (Table 3, Model 4). Finally, positive well-being, general health and vitality predicted future health outlook perception (Table 6, Model 5).
The current research aimed to explore the association between psychological well-being and (self-assessed) health perception and to study the impact of each of the six dimensions of psychological well-being on health perception. To test the hypotheses that health perception and psychological well-being would predict each other, and that the six dimensions of psychological well-being would have a different impact on prior, current and future health perception, two questionnaires were used. After a thorough examination of the models presented by each author, the psychological well-being model almost fitted the data (21 instead of 22 items and 6 dimensions) but the model presented for health perception had to be modified and reduced to 13 items, 3 dimensions and a general measure.
In this study, positive prior, current and future health perceptions were found to be associated with higher levels of PGWBI, and negative prior, current and future health perception were associated with lower levels of PGWBI. These results corroborate prior research findings3,5,19,20,22. Our results are also in line with Ware’s findings22,
indicating a positive association between health perception and psychological well-being.
The study provides evidence that psychological dimensions of well-being predict different dimensions of health perception: general
health predicted prior health perception; general health, vitality, positive well-being and depressed mood predicted current health perception; general health, positive well-being and vitality predicted health outlook perception. As it might be expected, general health
was present in all three models of health perception (prior health,
current health and future health perceptions), as general health is a
dimension of the PGWB that evaluates health’s general perception. It should be noted that current health predictors did not differ from those found by Ware22, for whom, correlations between current health
Table 5. Correlations between PGWBI and HPQ scores (N = 1,081)
1 2 3 4 5 6 7 8 9 10 11 PGWBI 1. Anxiety 1 2. Depressed mood .70 1 3. Positive well-being .66 .64 1 4. Self-control .62 .64 .62 1 5. General health .63 .54 .56 .51 1 6. Vitality .69 .64 .70 .58 .63 1 7. Total .89 .83 .84 .78 .76 .85 1 HPQ 8. Current health .48 .39 .48 .39 .62 .53 .57 1 9. Prior health .30 .29 .27 .24 .49 .29 .37 .46 1 10. Health outlook .27 .27 .31 .25 .29 .30 .34 .38 .20 1 11. Total .49 .42 .49 .40 .66 .53 .59 .94 .71 .51 1
Note: All correlations were significant at p < .001.
Table 4. Cronbach’s Alpha (a), composite reliability (CF), convergent (AVE) and discriminant validity of HPQ dimensions
r2
a CF AVE 1 2 3
1 Current health .85 .85 .42
-2 Prior health .68 .67 .41 .26
-and other health variables tend to be higher for feelings of general
health, pain, and worry.
Our findings indicate that health concerns are determined by health perception (past, current and future), what is supported by Dupuy’s definitionof general health24: “bothered by any illness, bodily
disorder, aches or pains, help needed with most or all of the things to do; concerned, worried, or with fears about health” (p. 180).
In this study, current health and future health perceptions shared predictors, even though current health includes depressed mood, meaning that what affects current health perception do not affect prior and future health perception; depressed mood is the differentiating element between prior and future health perception. Furthermore, given the positive association between a perception of bad prior health and a perception of good current health, psychological well-being may be mainly determined by current health perception. This is in line with research outcomes that identified psychological well-being with the Actualization of Human Potentials (AHP)2,11 emphasizing
an individual’s power to grow and change in the present and to achieve self-fulfilment.
Gender differences were found for all dimensions of psychological well-being but not for health perception. These findings are consistent with other studies that show that men have higher levels of psychological well-being than women21. Results show also a negative
association between age and psychological well-being, general health,
anxiety, positive well-being and vitality. Thus, our data suggest that
younger people have higher levels of psychological well-being than older people, in previous results of the impact of age on psychological well-being have been quite heterogeneous, with some authors14
claiming that psychological well-being is stable throughout life and others16 reporting the opposite. As for health perception, younger
Table 6. Multiple regression models (N=1,081)
B Std. Error Beta t (p-value) Tolerance VIF
Model 1 R2 = .36; F(3, 1077) = 200.29; p <.001
Constant .82 .11
Current health .47 .03 .46 15.90 (<.001) .71 1.42
Health outlook .14 .03 .13 5.04 (<.001) .85 1.17
Prior health .10 .02 .13 4.77 (<.001) .79 1.27
Dependent variable: PGWBI
Model 2 R2 = .47; F(3, 1077) = 313.67; p <.001 Constant 1.58 .06 General health .40 .02 .52 17.85 (<.001) .58 1.73 Vitality .11 .03 .13 3.93 (<.001) .47 2.29 Positive well-being .07 .02 .10 3.20 (.001) .49 2.04 Dependent variable: HPQ Model 3 R2 = .24; F(3, 1077) = 345.46; p<.001 Constant 1.76 .10 General health .55 .03 .49 18.59 (<.001) 1.00 1.00
Dependent variable: Prior health
Model 4 R2 = .43; F(3, 1077) = 199.63; p<.001 Constant 1.41 .08 General health .41 .03 .46 15.06 (<.001) .56 1.78 Vitality .19 .03 .20 5.52 (<.001) .40 2.50 Positive well-being .10 .03 .12 3.57 (<.001) .44 2.26 Depressed mood -.06 .03 -.07 -2.22 (.026) .50 1.99
Dependent variable: Current health
Model 5 R2 = .12; F(3, 1077) = 48.85; p<.001
Constant 2.12 .09
Positive well-being .13 .03 .16 3.95 (<.001) .49 2.04
General health .12 .03 .14 3.77 (<.001) .58 1.73
Vitality .09 .04 .10 2.22 (.026) .44 2.29
Dependent variable: Health outlook
people have a better health perception than their older counterpart, which is supported by previous research21.
Limitations
By providing information about the association between psychological well-being and health perception, this study contributes to the literature on well-being and health. However, limitations should be acknowledged. First, as this is a cross-sectional study, any causality association between the variables under study must be interpreted with caution. On the other hand, the sample was a convenience non-probabilistic one, so, it is not representative of the population. The fact that results relied exclusively on self-reported data from two questionnaires is another limitation. Thus, future studies should consider a methodological diversity.
Conclusion
The current study gives support to the line of research that indicates a bidirectional association between psychological well-being and health perception. In spite of not determining a causal relation, the study identified psychological dimensions of well-being that predict health perception. Whereas general health was found to predict health perception, depressed mood only influences current health perception and current health perception is the strongest dimension predictor for psychological well-being. Being so, patients’ interventions must be focused on general health. Health perception can be an important factor to predict psychological well-being, aligned with a holistic approach to the phenomenon. Thus, we consider important to plan intervention and to regularly evaluate patient’s treatment programs,
these predictive factors should be considered. Finally, these results allow us to acknowledge patients (in general diseases) from a global and holistic perspective.
Contributions
Ângela Leite contributed to the article performing the conception; analysis and interpretation of data; drafting the article or revising it critically for important intellectual content.
Ana Ramires contributed to the article performing the conception; analysis and interpretation of data; drafting the article or revising it critically for important intellectual content.
Andreia de Moura contributed to the article drafting the article or revising it critically for important intellectual content.
Teresa Souto contributed to the article drafting the article or revising it critically for important intellectual content.
João Marôco contributed to the article performing analysis or interpretation of data.
Disclosure statement
The authors declare that they have no conflict of interests.
References
1. Deci EL, Ryan RM. Hedonia, eudaimonia, and well-being: An introduc-tion. J Happiness Stud. 2008;9:1-11.
2. Keyes CLM, Shmotkin D, Ryff CD. Optimizing well-being: The empirical encounter of two traditions. J Pers Soc Psychol. 2002;82(6):1007-22.
3. Grossi E, Blessi GT, Sacco PL, Buscema M. The interaction between culture, health, and psychological well-being: Data mining from the Italian culture and well-being project. J Happiness Stud. 2002;13:129-48. 4. Keyes CLM. The mental health continuum: From languishing to
flourish-ing in life. J Health Soc Behav. 2002;43(2):207-22.
5. Ryff CD. Psychological well-being revisited: Advances in the science and practice of eudaimonia. Psychother Psychosom. 2014;83(1):10-28. 6. Loprinzi PD. Factors influencing the disconnect between self-perceived
health status and actual health profile: Implications for improving self-awareness of health status. Prev Med. 2015;73:37-9.
7. Diener E, Chan MY. Happy people live longer: Subjective well‐being contributes to health and longevity. Applied Psychology: Health and Well‐Being. 2011;3(1):1-43.
8. McPherson F, Melvin KC, Belew DL, McGraw LK. Health perception and wellness behavior survey among military beneficiaries. Ann Psychiatry Ment Health. 2016;4(2):1060.
9. Soukiazis E, Ramos S. The structure of subjective well-being and its de-terminants: A micro-data study for Portugal. Social Indicators Research. 2016;126(3):1375-99.
10. Gallagher MW, Lopez SJ. Curiosity and well-being. J Positive Psychol. 2007;2(4):236-48.
11. Ryan RM, Deci EL. On happiness and human potentials: a review of research on hedonic and eudaimonic well-being. Ann Rev Psychol. 2001;52:141-66.
12. Taylor RM, Gibson F, Franck, LS. A concept analysis of health-related quality of life in young people with chronic illness. J Clin Nurs. 2008;17(14):1823-33.
13. Huppert FA. Psychological well-being: Evidence regarding its causes and consequences. Applied Psychology: Health and Well-Being. 2009;1:137-64.
14. Diener E, Suh EM, Lucas RE, Smith HE. Subjective well-being: Three decades of progress. Psychol Bull. 1999;125:276-302.
15. Frazier P, Anders S, Shallcross S, Keenan N, Perera SS, Howard K, et al. Further development of the temporal model of control. J Couns Psychol. 2012;59(4):623-30.
16. Steptoe A, Demakakos P, Oliveira C. The psychological well-being, health and functioning of older people in England. In: Banks J, Nazroo J, Steptoe A, eds. The dynamics of ageing: Evidence from the English Longitudinal Study of Ageing 2002-10 (Wave 5). London: The Institute for Fiscal Studies; 2012. p. 98-182.
17. Wilks DC, Neto F. Workplace well-being, gender and age: Examining the ‘double jeopardy’ effect. Social Indicators Research. 2013;114:875-90. 18. Stone AA, Schwartz JE, Broderick JE, Deaton A. A snapshot of the age distribution of psychological well-being in the United States. Proc Nat Acad Sci. 2010;107(22):9985-90.
19. Ryff CD, Radler BT, Friedman EM. Persistent psychological well-being predicts improved self-rated health over 9-10 years: Longitudinal evidence from MIDUS. Health Psychol Open. 2015;2(2). pii: 2055102915601582. 20. Chida Y, Steptoe A. Positive psychological well-being and mortality:
A quantitative review of prospective observational studies. Psychosom Med. 2008;70(7):741-56.
21. Kaleta D, Polánska K, Dziankowska-Zaborszczyk E, Hanke W, Drygas W. Factors influencing self-perception of health status. Cent Eur J Public Health. 2009;17(3):122-7.
22. Ware JE. Scales for measuring general health perceptions. Health Serv Res. 1976;11(4):396-415.
23. Stoll L, Michaelson J, Seaford C. Well-being evidence for policy: a review. London: New Economics Foundation; 2012
24. Dupuy HJ. The psychological general well-being (PGWBI) index. In: Wenger NK, Mattson ME, Furberg CD, Elinson J, eds. Assessment of quality of life in clinical trials of cardiovascular therapies. New York: Le Jacq Publishing; 1984. p. 170-83.
25. Namjoshi MA, Buesching DP. A review of the health-related quality of life literature in bipolar disorder. Qual Life Res. 2001;10(2):105-15. 26. Gonzalez C, Gomes E, Kazachkova N, Bettencourt C, Raposo M, Kay TT,
et al. Psychological well-being and family satisfaction levels five years after being confirmed as a carrier of the Machado-Joseph disease mutation. Genet Test Mol Biomarkers. 2012;16(12):1363-8.
27. Souto T, Leite A, Ramires A, Santos V, Espírito-Santo R. Perceção da saúde: validação de uma escala para a população portuguesa. Temas Psicol. 2018;26(4):2167-83.
28. Hair JF, Black WC, Babin BJ, Anderson RE. Multivariate data analysis. 7th ed. Harlow UK: Pearson Educational Limited; 2014.
29. Hu LT, Bentler PM. Cutoff criteria for fit indexes in covariance structure analysis: Conventional criteria versus new alternatives. Structural Equa-tion Modelling. 1999;6:1-55.
30. Kline RB. Principles and practice of structural equation modelling. New York: Guilford Publications; 2015.
31. Marôco J. Análise estatística com o SPSS Statistics. Pêro Pinheiro, Por-tugal: Report Number, Lda; 2014.