HIGH MOISTURE CONTENT
Valdiney Cambuy Siqueira1, Flávio Meira Borém2, Guilherme Eurípedes Alves3,
Eder Pedroza Isquierdo4, Afonso Celso Ferreira Pinto5, Diego Egídio Ribeiro6,
Fabiana Carmanini Ribeiro7
(Recebido: 03 de outubro de 2016; aceito: 12 de dezembro de 2016)
ABSTRACT: The present study proposes a new processing and drying method and evaluates the behavior of grains subjected
to this process through the water reduction rate and the adjustment of different mathematical models. Mature beans were divided into three batches. The first batch was continuously dried at 40±1 °C. The second batch consisted of natural coffee dried to moisture contents of 0.56±0.02, 0.41±0.02, 0,28±0.02 and 0.20±0.02 decimal (dry basis, d.b.), followed by processing and continuous drying at 35±1 ºC and 40±1 ºC. For all parcels, the drying process was ended when the coffee beans reached the moisture content level of 0.12±0.05 (d.b.). The third batch corresponded to the continuous drying of hulled and demucilated coffee at 40±1 °C. The experimental data were adjusted to ten mathematical models used to represent the drying of agricultural products. The grain water reduction rate was also evaluated. We concluded that the water reduction rate was highest for the drying temperature of 40±1 °C, especially at higher moisture contents. The total drying time for processed coffee with high moisture content was significantly reduced compared with the total drying time of natural coffee. The Midilli model satisfactorily describes the drying kinetics of processed coffee.
Index terms: Adjustment of models, drying rate, temperature, Coffea arabica
CINÉTICA DE SECAGEM DE CAFÉ NATURAL BENEFICIADO COM ALTO TEOR DE ÁGUA
RESUMO: Objetivou-se, com o presente trabalho, propor um novo método de processamento e secagem, assim como avaliar o
comportamento dos grãos submetidos a este processo, por meio da taxa de redução de água e do ajuste de diferentes modelos matemáticos aos dados experimentais da secagem. Os frutos colhidos no estágio maduro foram divididos em três lotes. O primeiro foi seco continuamente à temperatura de 40±1 °C. O segundo consiste na secagem do café natural até os teores de água de 0,56±0,02, 0,41±0,02, 0,28±0,02 e 0,20±0,02 decimal (base seca, b.s.), seguido de beneficiamento e secagem contínua nas temperaturas de 35±1 ºC e 40±1 ºC. O terceiro lote correspondeu à secagem contínua do café descascado e desmucilado na temperatura de 40±1 °C. Em todos os lotes, a secagem foi encerrada quando os grãos atingiram o teor de água de 0,12±0,05 (b.s.). Aos dados experimentais da secagem foram ajustados dez modelos matemáticos utilizados para representação da secagem dos produtos agrícolas. Além da representação da cinética de secagem foi avaliada a taxa de redução de água dos grãos. Conclui-se que a taxa de redução de água é maior para a temperatura de secagem de 40±1 °C, especialmente para maiores teores de água. O tempo total de secagem do café beneficiado com alto teor de água é expressivamente reduzido, quando comparado ao tempo de secagem completa do café natural. O modelo de Midilli descreve satisfatoriamente a cinética de secagem do café beneficiado.
Termos para indexação: Ajuste de modelos, taxa de secagem, temperatura, Coffea arabica
1 INTRODUCTION
The methods involved in the post-harvest stage (processing, drying and storage) are crucial because the maintenance of coffee quality depends on the procedures adopted in these operations.
Freshly harvested coffee has a moisture content of approximately 60% (wet basis, w.b.) and unevenness in maturity, which differs from other grains grown on a large scale. Thus, drying should be started soon after harvest to quickly
1Universidade Federal da Grande Dourados/UFGD - Faculdade de Ciências Agrárias - Cx.P. 533 -79.804-970 - Dourados - MS [email protected]
2,3,5,6Universidade Federal de Lavras/UFLA - Departamento de Engenharia/DEG - Cx. P. 3037 - 37.200-000 - Lavras - MG [email protected], [email protected], [email protected], [email protected]
4Universidade do Estado de Mato Grosso/UNEMAT - Av. São João, S/N - 78.200-000 - Cáceres – MT - [email protected] 5Universidade de Brasília/UNB - Campus Universitário Darcy Ribeiro, S/N - 70.910-900 - Brasília - DF - [email protected]
reduce the high moisture content of the beans and to avoid unwanted fermentation (BORÉM; REINATO; ANDRADE, 2008; RESENDE et al., 2010a; RESENDE; SIQUEIRA; ARCANJO, 2009). However, drying can cause thermal stress and mechanical damage to the product if not performed correctly (BORÉM et al., 2006; MARQUES et al., 2008).
Coffee is one of the few main agricultural crops that is dried in a different form from how it is sold (bean) due to the equipment available
The third batch was dry processed; the beans underwent mechanical drying at 40 °C for 36, 48, 60 and 72 hours, corresponding to moisture contents of 0.56±0.02, 0.41±0.02, 0.28±0.02 and 0.20±0.02 (d.b.) in the grain, respectively. Subsequently, the natural coffee was processed in a CARMOMAQ (DC1) sample processing machine in a single pass, and the beans were subjected to continuous drying at 35±1 ºC and 40±1 ºC until a moisture content of 0.12±0.05 (d.b.) was reached (Figure 1).
Drying was carried out by forced convection in electric fixed bed dryers, composed of six square perforated trays, each with 0.35m sides and a depth of 0.4 m, located over a plenum in order to ensure a uniform airflow.
The moisture content of the natural coffee was determined using an oven at 105±3 °C for 24 hours in three replicates (BRASIL, 2009). The moisture content of the processed coffee was determined by the oven method at 105±1°C for 16 hours according to International Standard ISO 6673 (INTERNATIONAl ORGANIzATION FOR STANDARDIzATION - ISO, 2003).
The drying was performed by forced convection in fixed bed driers composed of square perforated trays over a plenum for airflow uniformity.
The airflow in the dryer was monitored throughout the drying process using a blade
anemometer set and maintained at 24 m3 min-1
m-2. The heating is done by means of electrical
resistances, controlled by an electronic temperature controller, and the monitoring was accomplished using mercury thermometers inserted into the coffee mass. The ambient air temperature and relative humidity were monitored using a thermo-hygro sensor and showed mean values of approximately 17.6 °C and 85.3%, respectively, on the days when the drying was conducted. diffusivity increased by approximately
1,000-fold with parchment removal (i.e., the speed with which the water left the bean was much higher). Therefore, coffee drying is accelerated by removal of the endocarp. However, it is very important that the endosperm does not undergo any damage during the removal of the outer layers of the fruit. It is also necessary to establish the drying temperature because the technical recommendations are restricted to only fruits and coffee in parchment.
The possibility of drying coffee beans can be considered a technological innovation and therefore requires further development. The adjustment of mathematical models for the drying of agricultural products allows predictions of their behavior during the water removal process and thus reduces the time and costs of the actual drying work to allow the development of equipment for
this step (CORRÊA et al., 2007;MARTINAzzO
et al., 2007; RESENDE et al., 2010b; SIQUEIRA; RESENDE; CHAVES, 2013).
Given the importance of drying for the maintenance of coffee quality and the absence of scientific papers describing the coffee bean drying process, the present study was performed to evaluate the drying kinetics of coffee beans after the processing of fruits with different moisture contents and to determine the water reduction rates of the grains at both drying temperatures (35±1 and 40±1 °C).
2 MATERIALS AND METHODS
Ripe coffee beans (Coffea arabica l. cv. Bourbon) manually harvested in the municipality of Carmo de Minas, MG, Brazil, were used in this study. After harvest, the beans underwent hydraulic separation for the removal of lower specific mass beans, followed by manual selection to remove any unripe and overripe beans that were not detected during harvest and/or were not removed during the hydraulic separation process.
The drying process was evaluated by determining the water reduction rate (CORRÊA; MACHADO; ANDRADE, 2001) as follows:
where TRA: water reduction rate (kg water kg dry
matter-1 hour-1); Ma
0: previous total water mass
(kg); Mai: current total water mass (kg); Ms: dry
matter (kg); t0: previous total drying time (h); and
ti: current total drying time (h).
To determine the moisture content ratios of the processed coffee during drying, the following expression was used:
where RX: product moisture content ratio, dimensionless; X: product moisture content (d.b.);
Xi: initial product moisture content (d.b.); and Xe:
equilibrium moisture content of the product (d.b.). The equilibrium moisture content of the processed coffee in each drying condition was obtained through the modified Harkins-Jura equation (3) proposed by Afonso Junior (2001):
where
T: drying air temperature, °C; UR:relative humidity of the drying air (decimal); and a, b, and c: model coefficients (a = -4.0779, b = 0.0336, and c = -0.1434).
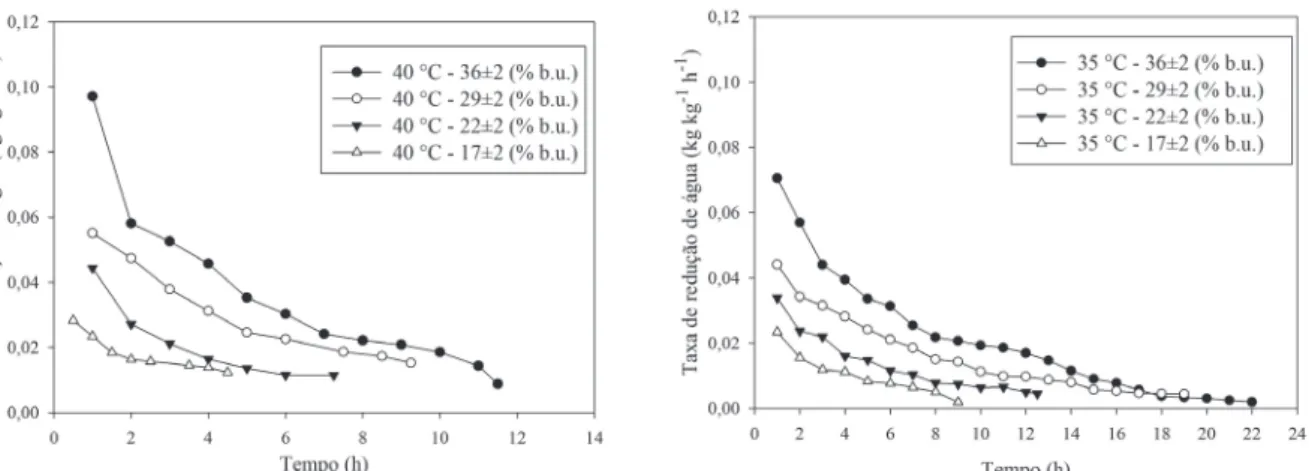
FIGURE 1 – Moisture reduction rate of processed coffee with high moisture content subjected to drying under two air conditions.
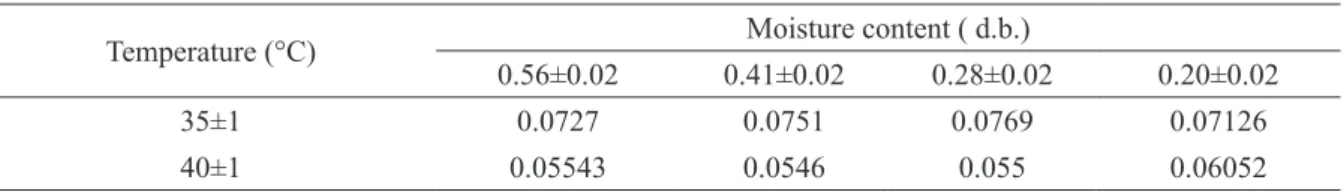
The equilibrium moisture content values estimated by the modified Harkins-Jura equation for the processed coffee grains with high moisture contents are shown in Table 1.
The mathematical models often used for the representation of the drying of agricultural products were adjusted to the experimental data obtained from the coffee drying process as shown in Table 2.
The mathematical models were adjusted by non-linear regression analysis through the Gauss-Newton method. The models were selected based on the magnitude of the determination coefficient
(R2), mean relative error (P) and estimated standard
deviation (SE) in addition to the verification of the residual distribution. The mean relative error and standard deviation of the estimate for each model were calculated according to the following expressions:
where RXobs: experimental moisture content ratio;
RXest: moisture content ratio estimated by the
model; N: number of experimental observations; and GlR: degrees of freedom of the model (number of experimental observations minus the number of model coefficients).
Two-term exponential RX = a exp (-k t) + (1-a) exp (-k a t) (5) Modified Henderson & Pabis RX = a exp (-k t) + b exp (-k0t) + cexp (-k1t) (6)
Henderson & Pabis RX = a exp (-kt) (7)
Midilli RX = a exp (-k tn) + bt (8)
Newton RX = exp (-k t) (9)
Page RX = exp (-ktn) (10)
Thompson RX = exp {[-a-(-a² + 4 bt)0,5](2 b)-1} (11)
Verma RX = -aexp (-kt) + (1-a) exp (-k1t) (12)
Valcam RX = a + b t + c t1,5 + dt2 (13)
t: drying time, h; k, ko, k1: drying constants h-1; and a, b, c, d, n: model coefficients.
3 RESULTS AND DISCUSSION
The highest water reduction rates occurred early in the process. Over the course of drying, reduction was observed regardless of the drying temperature and processing time (Figure 1) due to the higher energy needs required for evaporating more strongly bonded water. Several authors found the same behavior when they studied the drying of agricultural products, such as natural coffee (AlVES et al., 2013), beans (RESENDE et al., 2008), cherry coffee (RESENDE et al., 2010a) and jatropha (SIQUEIRA; RESENDE; CHAVES, 2012a).
We observed that the water reduction rate was always higher at 40 °C due to the greater difference between the partial water vapor pressure of the drying air and the product, which caused the water to be removed more easily and quickly.
As shown in Figure 1, the highest water reduction rate was observed at the drying temperature of 40±1 °C, which promoted a shorter drying time compared to 35±1 °C. After processing the coffee, we added the time required for drying to the time required for processing; based on this analysis, coffee processing required 47.5, 57.25, 67.25 and 76.5 hours at 40±1 °C and 58, 67, 72.5 and 81 hours at 35±1 °C for processed coffees with 0.56±0.02, 0.41±0.02, 0.28±0.02
and 0.20±0.02 (d.b.), respectively. These results indicate an acceleration of the drying process because the total drying time of natural coffee in this experiment was 108 hours, whereas the drying time of demucilated coffee was 32 hours. The large difference in the drying times between the natural and demucilated coffees was justified by the higher initial moisture content of the natural coffee and the presence of the exocarp and mesocarp.
Importantly, although the drying time of demucilated coffee is less than that of processed coffee with high moisture content and coffee dried in its natural form, the production of this type of coffee requires the acquisition of specific equipment for this purpose. These devices use water in their operation (the most important natural resource for human survival) and produce waste (solid and liquid) that greatly affects the environment.
Table 3 shows the statistical parameters applied to compare the ten models used to describe the kinetics of drying processed coffee beans at different moisture contents.
Some principles should be followed when choosing a model. According to Kashaninejad et al. (2007) and Madamba, Driscoll and Buckle
(1996), determination coefficients (R2) above
95% indicate a satisfactory representation of the drying process.
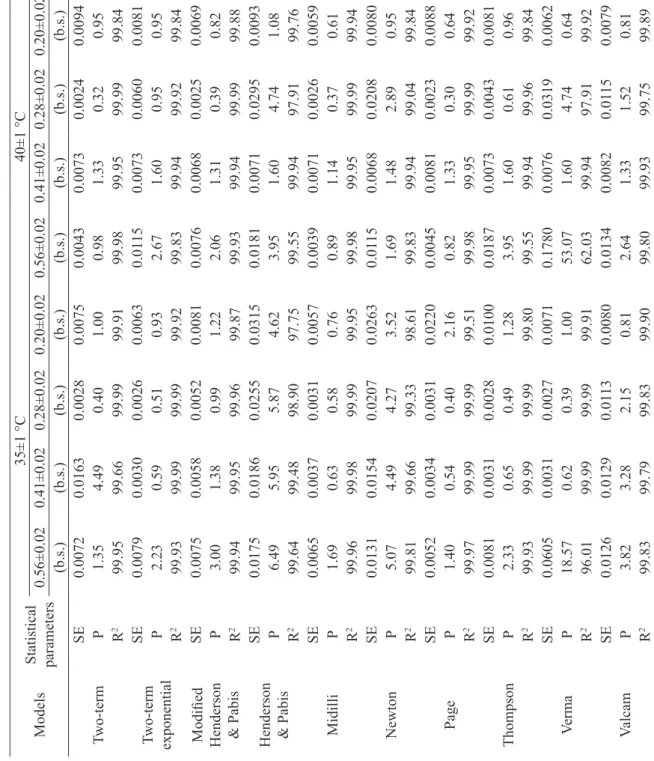
TABLE 3
Statistical parameters obtained for drying models used to describe the drying kinetics of processed cof
fee. Models Statistical parameters 35±1 °C 40±1 °C 0.56±0.02 0.41±0.02 0.28±0.02 0.20±0.02 0.56±0.02 0.41±0.02 0.28±0.02 0.20±0.02 (b.s.) (b.s.) (b.s.) (b.s.) (b.s.) (b.s.) (b.s.) (b.s.) Two-term SE 0.0072 0.0163 0.0028 0.0075 0.0043 0.0073 0.0024 0.0094 P 1.35 4.49 0.40 1.00 0.98 1.33 0.32 0.95 R 2 99.95 99.66 99.99 99.91 99.98 99.95 99.99 99.84 Two-term exponential SE 0.0079 0.0030 0.0026 0.0063 0.01 15 0.0073 0.0060 0.0081 P 2.23 0.59 0.51 0.93 2.67 1.60 0.95 0.95 R 2 99.93 99.99 99.99 99.92 99.83 99.94 99.92 99.84
Modified Henderson & Pabis
SE 0.0075 0.0058 0.0052 0.0081 0.0076 0.0068 0.0025 0.0069 P 3.00 1.38 0.99 1.22 2.06 1.31 0.39 0.82 R 2 99.94 99.95 99.96 99.87 99.93 99.94 99.99 99.88
Henderson & Pabis
SE 0.0175 0.0186 0.0255 0.0315 0.0181 0.0071 0.0295 0.0093 P 6.49 5.95 5.87 4.62 3.95 1.60 4.74 1.08 R 2 99.64 99.48 98.90 97.75 99.55 99.94 97.91 99.76 Midilli SE 0.0065 0.0037 0.0031 0.0057 0.0039 0.0071 0.0026 0.0059 P 1.69 0.63 0.58 0.76 0.89 1.14 0.37 0.61 R 2 99.96 99.98 99.99 99.95 99.98 99.95 99.99 99.94 Newton SE 0.0131 0.0154 0.0207 0.0263 0.01 15 0.0068 0.0208 0.0080 P 5.07 4.49 4.27 3.52 1.69 1.48 2.89 0.95 R 2 99.81 99.66 99.33 98.61 99.83 99.94 99.04 99.84 Page SE 0.0052 0.0034 0.0031 0.0220 0.0045 0.0081 0.0023 0.0088 P 1.40 0.54 0.40 2.16 0.82 1.33 0.30 0.64 R 2 99.97 99.99 99.99 99.51 99.98 99.95 99.99 99.92 Thompson SE 0.0081 0.0031 0.0028 0.0100 0.0187 0.0073 0.0043 0.0081 P 2.33 0.65 0.49 1.28 3.95 1.60 0.61 0.96 R 2 99.93 99.99 99.99 99.80 99.55 99.94 99.96 99.84 Verma SE 0.0605 0.0031 0.0027 0.0071 0.1780 0.0076 0.0319 0.0062 P 18.57 0.62 0.39 1.00 53.07 1.60 4.74 0.64 R 2 96.01 99.99 99.99 99.91 62.03 99.94 97.91 99.92 Valcam SE 0.0126 0.0129 0.01 13 0.0080 0.0134 0.0082 0.01 15 0.0079 P 3.82 3.28 2.15 0.81 2.64 1.33 1.52 0.81 R 2 99.83 99.79 99.83 99.90 99.80 99.93 99.75 99.89
compared to the curve estimated by the model (KASHANINEJAD et al., 2007).
When processed, coffee beans show a typical drying behavior. Thus, all of the models used, with the exception of the Verma model, met all of the statistical requirements for model validation. The Verma model showed P values of 18.57% and 53.07% for the processed coffee with 0.56±0.02 at both temperatures (35±1 and 40±1 °C), which suggested that the non-adjustment of this model was more related to the grain moisture content than the drying temperatures used. In addition to meeting the statistical requirements, the other models showed determination coefficient values above 97.7% and mean relative errors and standard deviations of the estimate below 6.5% and 0.032, respectively, which indicated satisfactory adjustment.
When several models satisfactorily represent the drying phenomenon, the parameter values and the complexity of each model should be taken into account for its recommendation. The models that best met the statistical requirements were Midilli, modified Henderson & Pabis, two-term, and Thompson & Page. Among these, the simplest models are Page, which is considered a classic model, and Midilli; both models are used to describe the drying kinetics of several agricultural products. Therefore, the use of an auxiliary component is needed to choose a model. Residual distribution analysis has been consistently used in a complementary manner to statistical parameters for choosing a model. Even if subjective, this analysis provides a good indication of the model adjustment to the experimental values.
According to Goneli et al. (2011), a model is considered random if the residual values are found near the horizontal range around zero and do not form defined figures, indicating no result bias. If a biased distribution is presented, the
the Verma model) during the drying of processed coffee beans with high moisture content at 35±1 and 40±1 °C. In both conditions, the residual values provided by the Midilli model are near the horizontal line that marks the zero axis with no biased behavior, which is in contrast to the Verma model. For the 35±1 °C and 0.56±0.02 (d.b.) condition, the formed “figure” resembles a parabola, whereas for the 40±1 °C and 36 hours condition, the formed “figure” is similar to an exponential curve.
Among the models used to describe the drying kinetics of processed coffee with different moisture contents, the Midilli model showed the best adjustments after a combined analysis of the values of the determination coefficient, mean relative error, standard deviation of the estimate and residual distribution bias. Therefore, this model was chosen to represent the coffee bean drying process for different temperature and initial moisture content conditions.
Goneli et al. (2009) studied the drying kinetics (40, 50 and 60 °C) of hulled coffee and concluded that the Midilli model was the most suitable for the representation of the process. Alves (2013) studied the drying of natural coffee at 40 and 45 °C and different airflows and also found that the Midilli model could be used to describe the phenomenon. Processed coffee has a drying behavior similar to parchment and natural coffee for the studied temperature range.
In addition to coffee in its different processing forms, the Midilli model is also recommended to predict the drying phenomenon of other agricultural products, such as red beans (CORRÊA et al., 2007), adzuki beans (RESENDE; FERREIRA; AlMEIDA, 2010) and jatropha grains (SIQUEIRA; RESENDE; CHAVES, 2012b).
Table 5 shows the coefficients of the Midilli model adjusted to the experimental data obtained from the coffee bean drying kinetics. The magnitude of the drying constant “k”, which represents the effect of external drying conditions (GONELI et al., 2009), tends to increase with the increasing drying temperature, although this value is numerically lower for the 0.20±0.02 (d.b.) and 40±1 °C condition compared to the 0.20±0.02 (d.b.) and 35±1 °C condition. According to Babalis and Belessiotis (2004) and Madamba, Driscoll and Buckle (1996), the drying constant “k” can be used as an approach to characterize the temperature effect and is related to the effective diffusivity in the drying process for the decreasing period. This finding indicates that the drying rate increases with the increase in the temperature. As the drying process take place and the moisture content reduces, the constant value “k” increases for the air temperature set at 35±1 °C. Considering the smaller size of coffee bean due to the volumetric contraction, the water molecules would have to go through a shorter distance, leading to a diffusion increasing. Conversely, this phenomenon was not detected for the air temperature set at 40±1 °C.
The coefficient “n” is lower for 40±1 °C compared to 35±1 °C, with the exception of the 0.41±0.02 (d.b.) condition. According to Goneli et al. (2009), this coefficient reflects the product’s internal resistance to drying. Thus, the higher the drying temperature is, the lower the magnitude of the coefficient.
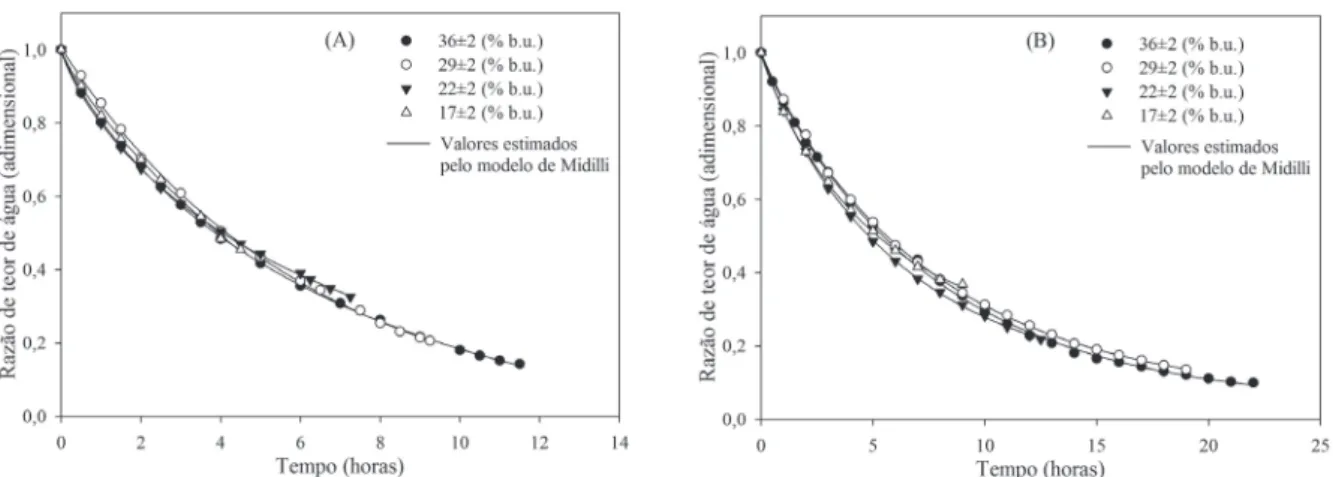
Figure 3 shows the behavior of the moisture content ratio of wet processed coffee beans estimated by the Midilli model for drying temperatures of 40±1 and 35±1 °C. The Midilli model shows satisfactory adjustment to the experimental values and thus accurately represents the behavior and describes the drying phenomenon of coffee beans for both temperatures used.
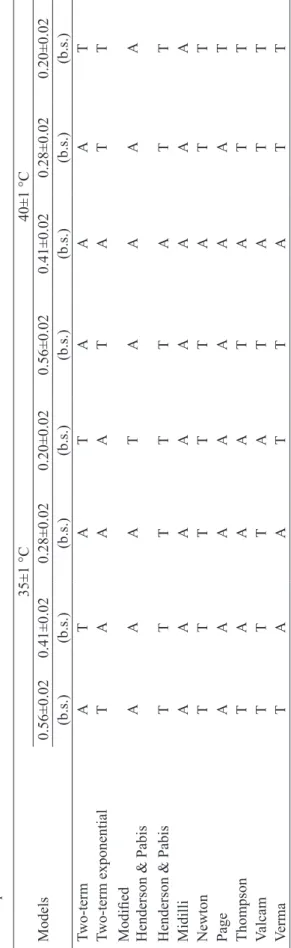
TABLE 4 Residual distribution (A = random; T = biased) for ten analyzed models during the drying of processed cof fee with various moisture contents under
two temperature conditions. Models
35±1 °C 40±1 °C 0.56±0.02 0.41±0.02 0.28±0.02 0.20±0.02 0.56±0.02 0.41±0.02 0.28±0.02 0.20±0.02 (b.s.) (b.s.) (b.s.) (b.s.) (b.s.) (b.s.) (b.s.) (b.s.) Two-term A T A T A A A T Two-term exponential T A A A T A T T
Modified Henderson & Pabis
A A A T A A A A
Henderson & Pabis
T T T T T A T T Midilli A A A A A A A A Newton T T T T T A T T Page A A A A A A A T Thompson T A A A T A T T Valcam T T T A T A T T Verma T A A T T A T T
FIGURE 2 - Residual distribution graphs for the processed coffee beans with different initial moisture contents subjected to drying at 35±1 and 40±1 °C. “A” and “C”, random for the Midilli model; “B” and “D”, biased for the Verma model.
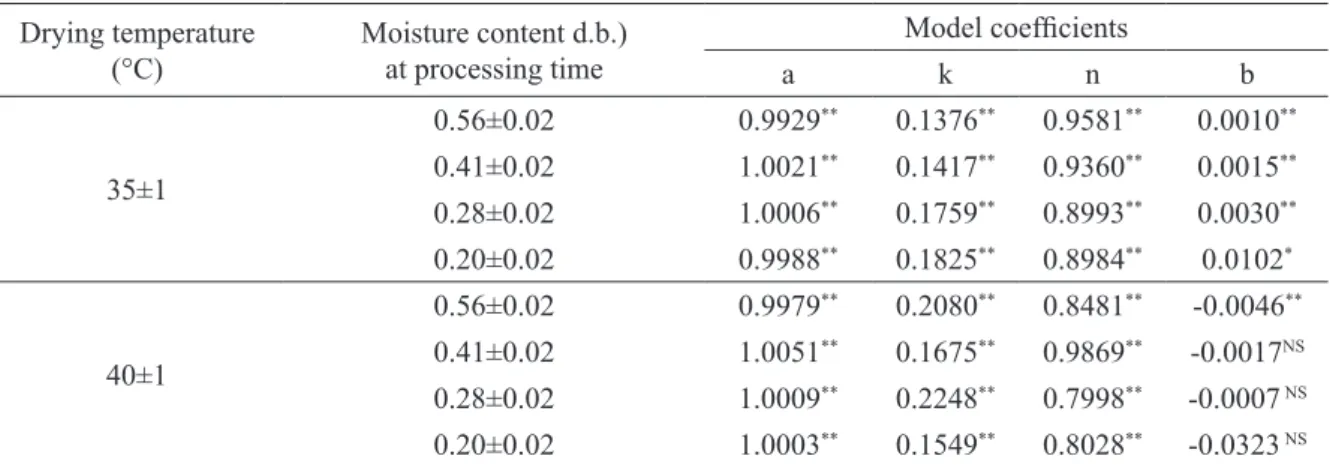
TABLE 5 - Midilli model parameters adjusted for the different drying conditions of coffee beans. Drying temperature
(°C) Moisture content d.b.)at processing time a Model coefficientsk n b
35±1 0.56±0.02 0.9929** 0.1376** 0.9581** 0.0010** 0.41±0.02 1.0021** 0.1417** 0.9360** 0.0015** 0.28±0.02 1.0006** 0.1759** 0.8993** 0.0030** 0.20±0.02 0.9988** 0.1825** 0.8984** 0.0102* 40±1 0.56±0.02 0.9979** 0.2080** 0.8481** -0.0046** 0.41±0.02 1.0051** 0.1675** 0.9869** -0.0017NS 0.28±0.02 1.0009** 0.2248** 0.7998** -0.0007 NS 0.20±0.02 1.0003** 0.1549** 0.8028** -0.0323 NS ** Significant at 1%, by F-test; * Significant at 5%, by F-test; ns Non-significant.
4 CONCLUSIONS
The water reduction rate is higher for the drying temperature of 40±1 °C compared to 35±1 °C. This difference is reduced when the initial moisture content of the processed coffee decreases.
The total drying time of processed coffee with high moisture content is significantly reduced compared to the total drying time of natural coffee at 40±1 °C.
For the studied moisture contents, the Midilli model satisfactorily describes the drying kinetics of processed coffee beans subjected to drying at the temperatures of 35±1 and 40±1 °C.
5 ACKNOWLEDGEMENTS
CAPES, FAPEMIG, CNPq, and INCT-Café. 6 REFERENCES
AFONSO JUNIOR, P. C. Aspectos físicos, fisiológicos e de qualidade do café em função da secagem e do armazenamento. 2001. 399 p. Tese (Doutorado em Engenharia Agrícola)-Universidade Federal de Viçosa, Viçosa, 2001.
AlVES, G. E. Cinética de secagem e qualidade do café para diferentes temperaturas e fluxos de ar. 2013. 131 p. Dissertação (Mestrado em Engenharia Agrícola)-Universidade Federal de lavras, lavras, 2013. AlVES, G. E. et al. Cinética de secagem de café natural para diferentes temperaturas e baixa umidade relativa. Coffee Science, Lavras, v. 8, n. 2, p. 238-247, 2013. BABALIS, S. J.; BELESSIOTIS, V. G. Influence of the drying conditions on the drying constants and moisture
FIGURE 3 - Experimental moisture content ratio values and the values estimated by the Midilli model for processed coffee beans with different moisture contents subjected to drying at 40±1 °C (A) and 35±1 °C (B).
diffusivity during the thin-layer drying of figs. Journal of Food Engineering, Essex, v. 65, n. 3, p. 449-458, 2004. BORÉM, F. M. et al. Qualidade do café submetido a diferentes temperaturas, fluxos de ar e períodos de pré-secagem. Coffee Science, lavras, v. 1, n. 1, p. 55-63, 2006. BORÉM, F. M.; REINATO, C. H. R.; ANDRADE, E. T. Secagem do café. In: BORÉM, F. M. (Ed.). Pós-colheita do café. Lavras: Ed. UFLA, 2008. p. 205-240. BRASIl. Ministério da Agricultura e Reforma Agrária. Secretaria Nacional de Defesa Agropecuária. Regras para análise de sementes. Brasília, DF, 2009. 395 p. CORRÊA, P. C. et al. Modelagem matemática para a descrição do processo de secagem do feijão (Phaseolus vulgaris l.) em camadas delgadas. Engenharia Agrícola, Jaboticabal, v. 27, n. 2, p. 501-510, 2007. CORRÊA, P. C.; MACHADO, P. F.; ANDRADE, E. T. Cinética de secagem e qualidade de grãos de milho-pipoca. Ciência e Agrotecnologia, lavras, v. 25, n. 1, p. 134-142, jan./fev. 2001.
DRAPER, N. R.; SMITH, H. Applied regression analysis. New York: J. Wiley, 1998. 712 p.
GONElI, A. l. D. et al. Cinética de secagem dos grãos de café descascados em camada delgada. Revista Brasileira de Armazenamento, Viçosa, n. 11, p. 64-73, 2009. Especial café.
______. Contração volumétrica e forma dos frutos de mamona durante a secagem. Acta Scientiarum Agronomy, Londrina, v. 33, n. 1, p. 1-8, 2011.
75-97, 1996.
MARQUES, E. R. et al. Eficácia do teste de acidez graxa na avaliação da qualidade do café arábica (Coffea arabica l.) submetido a diferente períodos e temperaturas de secagem. Ciência e Agrotecnologia, Lavras, v. 32, n. 5, p. 1557-1562, set./out. 2008.
MARTINAzzO, A. P. et al. Análise e descrição matemática da cinética de secagem de folhas de capim-limão. Revista Brasileira de Engenharia Agrícola e Ambiental, Campina Grande, v. 11, n. 3, p. 301-306, 2007. MOHAPATRA, D.; RAO, P. S. A thin layer drying model of parboiled wheat. Journal of Food Engineering, Essex, v. 66, n. 4, p. 513-518, 2005.
NIlNONT, W. et al. Finite element simulation for coffee (Coffea arabica) drying. Food and Bioproducts Processing, Rugby, v. 90, n. 2, p. 341-350, 2012.
Agroindustriais, Campina Grande, v. 10, n. 1, p. 17-26, 2008.
RESENDE, O.; SIQUEIRA, V. C.; ARCANJO, R. V. Influência do pavimento de terreiros na secagem e na qualidade do café conilon. Global Science and Technology, Rio Verde, v. 3, n. 5, p. 26-37, 2009. SIQUEIRA, V. C.; RESENDE, O.; CHAVES, T. H. Determination of the volumetric shrinkage in jatropha seeds during drying. Acta Scientiarum. Agronomy, Londrina, v. 34, n. 3, p. 231-238, 2012a.
______. Drying kinetics of Jatropha seeds. Revista Ceres, Viçosa, v. 59, n. 2, p. 171-177, 2012b.
______. Mathematical modelling of the drying of jatropha fruit: an empirical comparison. Revista Ciência Agronômica, Fortaleza, v. 44, n. 2, p. 278-285, 2013.