DISCLOSURES AND DISCLAIMER AT THE END OF THE DOCUMENT PAGE 1/30 SEE MORE INFORMATION AT WWW.FE.UNL.PT
o We have revised Galp Energia with a price target of €13.68 following a buy recommendation down from previous target. The slight decline in price is carried by lower oil prices and also an expected tax increase in Portugal. Nevertheless, we see strong progress supported by an interesting E&P portfolio. At present time the main bulk of profits are received from their R&M segment. However when their E&P portfolio becomes operational they will become a major player with their target production of 150,000 kbpd
o
The market is still uncertain, with oil prices fluctuating at high levels. European refining margins are under pressure with refineries running at excess capacities. Galp Energia’s refining margins are expected to remain at an elevated level above the Rotterdam cracking margin, with a swift increase when their scheduled conversion project is completed.o
Their Gas & Power segment brings in stable cash flows with their regulated activities, although Galp Energia are shifting their business more towards the unregulated market. Future construction projects are under way which will increase Galp’s capacity, along with improvements in the energy efficiency of their two refineries in Sines and Porto.“GALP
ENERGIA”
C
OMPANY
R
EPORT
“OIL
&
GAS”
ANALYST: “B
JØRNI
VARS. F
URUSETH ”Optimistic view...
Will it hold?
Recommendation: BUY
Vs Previous Recommendation BUY
Price Target FY10: 13.68 €
Vs Previous Price Target 14.12 €
Price (as of 7-Jun-10) 12.00 €
Reuters: GALP:LS, Bloomberg: GALP:PL
52-week range (€) 13.68-8.86 Market Cap (€m) 9,951.006 Outstanding Shares (m) 829 Source: Bloomberg Source: Bloomberg €(k) 2009 2010E 2011E sales 11,728,447 12,798,645 16,300,464 EBITDA 755,462 1,085,659 1,382,704 Net Income 347,272 548,273 704,357 ROIC 7.90% 10.50% 9.80% P/E 32.6 20.7 16.1 EPS 0.42 0.66 0.85
2
T
ABLE
O
F
C
ONTENTS
EXECEUTIVE SUMMARY ... 3 COMPANY DESCRIPTON ... 4 SHAREHOLDER STRUCTURE ... 4-5 VALUATION ... 6-8 COMPARABLES ... 8-9 COMPANY FACTORS & SWOT ANALYSIS ... 9-11SWOT ANALYSIS ... 10 CAPEX STRATEGY ... 11
OIL INVENTORIES ... 12 EXPLORATION & PRODUCTION ... 13-17
ANALYSIS OF THE MARKET... 13-14
ANGOLA ... 14-15
BRAZIL ... 15-16 OTHER PROJECTS ... 17 VENEZUELA ... 17 REFINING & MARKETING ... 18-23
ANALYSIS OF THE MARKET... 18-20
REFINING ... 20-22
BIOFUELS ... 22
MARKETING ... 22-23
GAS & POWER ... 16
ANALYSIS OF THE MARKET... 24-25
NATURAL GAS ... 26
POWER ... 27-28 FINANCIAL STATEMENTS ... 28-29
3
E
XECUTIVE
S
UMMARY
This report will touch on the different subjects within Galp Energia’s interest. We will analyze the markets for each segment of operations and also possible future scenarios within this business. The main focus will be towards petroleum and petroleum products, along with the natural gas market. The reason for this approach is given that Galp Energia’s main interests lie within these commodities.
We use the so called sum of parts valuation approach when defining Galp Energia’s price at €13.68, thus leading to a buy rating of the stock. This method reflects the company value more precisely due to the business is divided into segments. In the E&P segment we used ROV, as there are managerial flexibilities tied with production on oil fields.
Galp Energia is currently traded at a premium compared to the rest of the players in the industry. The grounds for this can be explained by looking at Galp’s interests in the E&P segment, mainly focusing on their stake in Brazilian oil fields. The resource base that they have acquired over the last years, and the positive outlook of further increase, pushes the value and popularity of this company.
With enormous oil finds in the Brazilian basins, Galp Energia is in for an exciting journey. Even though the E&P segment is not a major contributor to Galp’s operating performance, they have several projects that will boost future revenues significantly.
Galp Energia operates mainly in the Iberian Peninsula with two refineries located in Portugal, namely Sines and Porto refinery. They are the only refiner in Portugal and enjoy a 20% market share in the Iberian refining capacity. Their main concerns regarding risks are drops in refining margins, considering that the main contribution to their performance is from their Refining & Marketing segment. Galp Energia is currently undergoing a conversion project on their refineries which will support their growth potential, considering European refining margins are declining.
”Galp Energia is
currently being
traded at a premium
compared to the rest
of the players in the
industry”
”We will use the
sum of parts
valuation
approach”
”operations consist
mainly in the Iberian
Peninsula”
4
Galp is working towards a fully integrated energy company comprising three main segments namely E&P, R&M and G&P.
Exploration & Production: This segment is responsible for activities related to exploration, development and production of hydrocarbons. The core areas of interest are in Angola and Brazil where the Tupi Field is the main attraction.
Refining & Marketing: Refining comprises the refining, supply and logistic activities of the Company. Galp operates two refineries, namely in Sines and Oporto. They have the benefit of being the sole refiner in Portugal and one of the largest in the Iberian Peninsula. Their marketing division consists of retail, wholesale and LPG distribution. In the retail division Galp has over 35% market share in Portugal, with roughly 1500 service stations and 449 convenience stores in Iberia.
Galp Energia controls 50% of the market share in Portugal from the wholesale division, where around 50% of their volumes are sold to Spain. LPG section delivers consistent high levels of profitability and currently has a 50% stake of the market share in Portugal. Gas & Power segment supplies natural gas to high volume industrial users, power companies and local distribution companies mainly to the Iberian Peninsula.
S
HAREHOLDER
S
TRUCTURE
“Galp Energia is a
fully integrated energy
company”
“1500 service
stations and 449
convenience stores
in Iberia”
”Controls 50% market
share in Portugal
from wholesale”
Source:Galp Energia Chart 1:5
An important issue to discuss is the possible change of shareholder structure that can take place by the end of this year. Eni and Amorim Energia are currently in a pact that holds them back from selling their stake, but this agreement will be over by the end of this year. There are talks that the Brazilian oil company Petrobras will take over Eni’s share in Galp Energia, which would be of extreme importance to Galp. Petrobras and Galp are currently joined in roughly 50 operations in the Exploration and Production segments, where Petrobras enjoys operating leader status in most projects. With Petrobras as a major stakeholder Galp Energia would benefit from Petrobras financial strength and expertise at deepwater fields. Galp would also open the doors for Petrobras into the European refining market. Their operations are already intertwined on several levels, so a possible stake in Galp would benefit both companies greatly. Another scenario to take into account is that the Portuguese state could also sell their stake on the market in order to reduce their debt levels.
shareholders are Power, Oil & Gas Investments BV (30%), Amorim Investimentos Energéticos SGPS S.A. (20%), Oil Investments BV (5%) and Esperaza Holding BV (45%). Whereas the three first companies are directly or indirectly controlled by Portuguese investor Américo Amorim, the last one is controlled by Sonangol, E.P., Angola’s stateowned oil company.
Comments: Caixa Geral de Depósitos (CGD) is Portugal’s largest credit institution and is wholly owned by the Portuguese state.
Comments: Eni is an italian energy operator listed on the Milan Stock Exchange and the NYSE in New York. Eni is present inb over 70 countries in Exploration & Production, Refi ning & Marketing, Gas & Power, Petrochemicals & Engineering Services and Construction & Drilling. At 31 December 2009, Eni had a market capitalization of €71 billion.
Comments: Parpública is a vehicle for the Portuguese state’s equity holdings in a number of companies
Comments: Shares freely traded on the market at the end of 2009 accounted for approximately 25% of the total. The largest portion – around 80% of this free float or 20% of the total – was held by institutional investors. Retail investors owned 5% of Galp Energia, in line with what was the case a year earlier.
Comments: The Royal Bank of Scotland Group plc (RBS) is the holding company of a global banking and financial services group. The Company operates in the United Kingdom, the United States, and internationally. The Company’s business segments include: Retail, Corporate, Wealth, Global Banking and Markets, Global Transaction Services and Insurance.
”talks of Petrobras
will take Eni’s share
in Galp Energia”
6
We use the so called sum of parts valuation approach when defining Galp Energia’s price at €13.68, thus leading to a buy rating of the stock. This method reflects the company value more precisely seeing as the business is divided into segments. In the E&P segment we used ROV, since there are managerial flexibilities tied with production on oil fields.
In the refining and marketing part of the business, we revised the refining margins, following a future outlook of products prices and also the effect from the conversion project has been taken into account. We estimate a lower utility rate on the refineries than what Galp Energia expects, with a stable rate of 90% opposed to Galp’s estimate of 95% after the conversion takes place. Oil prices along with natural gas prices, are estimated through the forward curve.
Due to limited information regarding oil fields, we have used multiples assumptions and also the location and size of the field compared with data already available from similar fields. In Brazil,the Tupi Field BM-S-11 has been the benchmark for estimates of opex and capex for the other fields in the area. We have been fairly optimistic in the total barrels found, by using numbers close to the limit of what has been announced by either Galp Energia, or one of its consortium partners. Also a fair assumption of 30% probability of reserves recovery has been implemented into our valuation.
Oil Field Total Barrels Galps share Risk Free Rate Method Value
BRAZIL Tupi BM-S-11 8,000,000,000 10% 12% ROV € 3.71 Iara-BM-S-11 4,000,000,000 10% 12% ROV € 1.68 Jupiter BM-S-24 3,500,000,000 10% 12% ROV € 1.32 Bem-Te-Vi (BM-S-8) 1,500,000,000 10% 12% ROV € 0.54 Caramba BM-S-21 1,300,000,000 10% 12% ROV € 0.46 ANGOLA
Kuito Field 50,000,000 9% 3% ROV € 0.32
Tombua Landana Field 32,000,000 9% 3% ROV € 0.17
BBLT 25,000,000 9% 3% ROV € 0.09
Sum € 8.28
”sum of parts
valuation approach
with a target price of
€13.68”
”estimated 90% utility
rate for Galp
Energia’s refineries
after the conversion”
Source: Galp Energia, Analyst Table 2:
7
Galp Energia’s E&P portfolio has been estimated at a total value of €8.28. We feel it is necessary to run a sensitivity test on this portfolio to show the volatility of the upstream business with changes in the price of oil. Graph 1 demonstrates the price of barrels ranging from $35 to 105$ placing a value on Galp Energia’s most valuable field at $0.41 and $7.68 respectively.
One of the risks we face for our valuation of Galp Energia is the appreciation of the USD on the EUR. This can best be explained by looking at graph 2 below where the complete E&P portfolio is estimated at different levels of conversion.
Graph 1:
Source: Aanlyst
Graph 2:
8
Table 3 underneath explains the layout of each segment and its value. For our valuation we chose an optimistic market risk premium of 6% due to recent studies that give evidence facilitating an average market risk premium is between 4-6%. With Galp Energia’s interests spread over several countries, we chose a different risk free rate for each country namely Brazil, Portugal and Angola with rates at 12.46%, 3% and 3.2% respectively. We set the beta for Galp at 1.03, and this has been kept for each segments valuation. The tax rate in Portugal is expected to increase this month and the change has been taken into account.
C
OMPARABLESGalp Energia is being traded at a premium compared to the rest of the players in the industry which multiples in table 4 confirm. The reason for this can be explained by looking at Galp’s interests in the E&P segment, mainly focusing on their stake in Brazilian oil fields. The resource base that they have acquired over the last years, and the positive outlook of further increase, pushes the value and popularity of this company.
Segment EV € (k) Share Price €
G&P 2,616,799 € 3.16 E&P 6,867,606 € 8.28 R&M 4,023,045 € 4.85 Total EV 13,507,449 € 16.29 Debt 2,170,642 € 2.62 Equity 11,336,807 shares (k) 829,251 Price € 13.68 Table 3:
9
COMPANIES EV/EBITDA P/E Ratio P/B Ratio
Exxon 8.5 14.8 2.8
Galp Energia 15.5 22.9 3.8
ENI 4.4 12.3 1.3
Petrobras 6.6 9.2 1.7
Statoil 2.9 16.9 2.0
Royal Dutch Shell 6.4 11.8 1.2
Repsol 5.8 11.4 0.9 Devon 6.7 12.5 1.8 BP 5.3 7.9 1.5 Chevron 5.1 11.8 1.7 Average 6.7 13.1 1.9 Source: Bloomberg
C
OMPANY
F
ACTORS
& S
WOT
A
NALYSIS
The main driver of value for Galp Energia is the promising E&P portfolio they are acquiring. With enormous oil finds in the Brazilian basins, Galp Energia is in for an exciting journey. Even though the E&P segment is not a major contributor to Galp’s operating performance, they have several projects that will boost future revenues significantly. Galp Energia are increasing their presence in the Iberian Market, with recent acquisitions in the R&M and G&P segment of their business, placing them as the 2nd and 3rd player in natural gas and oil distribution market, respectively.
Galp Energia’s main concerns regarding risks are drops in refining margins, considering that the main contribution to their performance is from their Refining & Marketing segment.
This can be observed by their weak 2009 results where refining margins declined by 67% reaching $1.50/bbl. Further future risks lie within uncertainties of expenses relating to extraction and operating costs in the Brazilian oil fields due to extreme drilling conditions. Devaluation of the USD is also a factor touching Galp’s risk profile seeing as EUR being their currency of operations.
”main driver for
value is Galp
Energia’s promising
E&P portfolio”
”main risks are
drops in refining
margins”
10
S
WOT ANALYSISSTRENGTHS: WEAKNESSES:
o Strong E&P portfolio in Brazil
o Market Leader of Oil & Gas in Portugal
o Stable Cash flow generation from R&M Segment
o Large client base, now also with an increased presence in Madrid after their last acquistion
o Weak production of raw materials, dependant on external sources
o Small or no control of projects in their Exploration portfolio, due to low participation in the stake on each field
OPPORTUNITIES: THREATS:
o R&M segments increasing presence in Spain o Sines & Porto conversion project almost
complete, this will lead to higher refining margins and increased sales
o Robust exploration portfolio
o Moving towards a completely integrated oil company when their E&P segment becomes fully operational, receiving compensation for being a player in both the E&P and R&M sector
o Economic instability in the domestic country o EUR/USD appreciation
o Higher than expected exploration costs in pre salt areas of Brazil
o Decreasing refining margins
o Insecurity in the long term scope of cash flow generation with a diminishing global resource base
Table 5:
11
C
APEX STRATEGY
Galp Energia’s forward looking capex strategy consists of main investments going to their refining & marketing segment until the end of 2011. From 2012 onwards Galp alter their core focus towards capex in their exploration & production portfolio. The total amount of capex expected is noted at €4 - €4.5 bln for the period 2010 – 2014. To support this plan, Galp Energia were required to make some adjustments in their structure. A brief overview of these changes was to reschedule and renegotiate projects and contracts. They are creating a cost efficiency program that will give an impact of roughly €125 million through the period and also cut their dividend policy from €0.32 to €0.20. They also decided to go into a joint venture project with construction of their newly planned CCGT1. This agreement is prepared to reduce costs by otherwise taking on the project on their own. These changes do not cover the total amount for the whole period, so support from the banking sector can be expected. Their refining & marketing segment will also be a large contributor through the period, with a strong growth in market share after their recent Iberian acquisition.
1
CCGT: Combined Cycle Gas Turbine
”CAPEX strategy
consist of
investments in
upstream for the
first part, then
moving core
investments to
upstream”
”restructuring
changes to be
made to support
their CAPEX
strategy”
Downstream part of the business will receive the major part of capex until 2011
Upstream segment will take over the core capex from 2012 and onwards
”total capex for the period is €4-4.5 bln” Chart 2:
12
O
IL
I
NVENTORIES
In the US, commercial stocks rose 24.2 mb in April, putting an end to the two month falling trend. The US are stacking up their inventories in stronger volumes than what has been noted over the last 5 years, reaching almost 10 mb2 above the average build and touching a level of 1072.7 mb. The US crude commercial oil stocks in April were climbing for the fourth consecutive month at a total of 360.6 mb, placing the volume at the highest level in nearly a year. Strong crude oil imports reaching roughly 260,000 b/d compared with the same period last year are reasons for this build up, with US imports realizing almost 10 mb a week in April. This is a good indicator that the economic conditions in the US are strengthening and that a positive short term scope can be expected. Japan’s commercial oil stocks came out of a 5 year slumber in March with an increase of 4.0 mb to a total of 159.6 mb, although compared with numbers from last year, the build still falls 10% short. With Japanese crude oil inventories at 93.1 mb they are currently at their highest level since September 2009, giving signals towards an optimistic view. The increase in crude inventories has shrunk the deficit with a year ago at a strong paste, closing the gap by 10% compared with February’s numbers at 19%.
According to numbers from OPEC, European and Norwegian stock movements showed a slight decline in March falling an inch by 2.3 mb. Total inventory levels remained 30 mb or 3 % above the 5 year average at 1153 mb. Reasons for the fall can be explained by a dip in the products stocks of 7.5 mb mainly supported by the large scale of refinery maintenance currently in progress. Total crude oil stocks recorded at 476.3 mb in the end of March, up from February but still at a 26mb lower than last year.
2 Mb: million barrels Source: EIA Source: EIA Chart 3: Chart 4:
13
E
XPLORATION &
P
RODUCTION
A
NALYSIS OF THE MARKETAccording to OPEC the world oil demand for 2010 is expected to have a slight growth of 1.1% or 0.9 mb/d3 up from a reduction of 1.4 mb/d in 2009. Recent macroeconomic factors have shown positive signals, creating an upward movement in commodities with the IMF Commodity Index showing an increase of 4% m-o-m in March. Oil prices are still very sensitive and are fairly correlated with the fluctuation of the US economy with crude currently being traded at $72.50 per barrel. The US driving season is coming close and it is likely that we can see a further growth in the oil price with numbers showing a boost in US gasoline consumption in April by 1.4% yoy4. The petrochemical sector in North America increased demand for petroleum products, expanding total US oil demand by 0.4 mb/d.
Euro-Zone’s economy is still fragile, with Greece and Portugal being the factors of uncertainty. The euro has appreciated towards the dollar and oil demand is contracting. It is stated in the OPEC Monthly Report March 2010 edition, that January data shows 11.8% yoy decline for total oil usage in Europe, and an upward movement is not expected in the near future. OECD Europe’s oil demand was revised downward by 200,000 bbl/d5, for the first and second quarter this year reaching an average total demand of 14.2mb/d i6n 2010. Europe is also contributing to decreases in oil consumption by moving towards a greener Europe with more focus on biofuels and renewables.
3
Mb/d : million barrels per day
4
Yoy: year on year
5
Bbl/d: barrels per day Source: BPI Statistical Review
”according to OPEC
world oil demand in
2010 is expected to
show slight growth of
1.1%”
”US driving season is
coming close, which
should create a short
term boost in
demand”
”euro-zone’s
economy is still
fragile”
14
transport fuel, where the UK Government has already started the program this April. China’s demand is forecasted to increase by 160,000b/d in 2010 due to high demand in transport and industrial sectors. Imports of oil in February grew by 58% yoy to 4.8mb/d.
Developing countries have started to play an important role in the world growth and growth in oil demand these last years. Expected oil growth for DC countries are 0.6 mb/d with an total average of 26.5 mb/d. Latin America’s growth is expected to reach 123,000b/d in 2010, led by Brazils hunger for petroleum products. India is estimated to acquire a growth of 135,000b/d mainly supported by agriculture, transport and industry demands. The rest of Asia receives a forecast from OPEC that expands to 220,000 b/d yoy, following an optimistic expectation of fair domestic growth within the Asian countries.
A
NGOLAIn Angola, Galp Energia participates in four offshore blocks namely, block 14,block 14K-A-IMI, block 32 and block 33.
Block 14 has an estimated resource base with and oil quality ranging from intermediate to light (24°-37° API gravity oil.) The block has been operational since 1999 with 5 development areas; Kuito, Benguela-Belize-Lobito-Tomboco (BBLT), Tômbua-Lândana (TL), Negage and Gabela. Production is currently coming from the three first fields in the list, with BBLT field pulling the most weight. Partners in the Block 14 project are: Sonangol, ENI, Total, Chevron and Galp Energia with working interest.
Tômbua-Lândana field is the newest area of interest for Galp in Angola. It has an estimated resource base of 1 billion barrels with roughly 350 million barrels recoverable. The CAPEX for the consortium in this field is USD 3.8 billion. 100,000 kbp/d of production is expected to be reached by 2011.
forecasted to increase
by 160,000b/d”
”galp energia
participates in four
offshore blocks in
Angola”
Chart 5:15
Galp Energia has been participating in the development of the first integrated natural gas project in Angola, with the purpose of exploration, research and ensuing certification of natural gas reserves. If the exploration is successful an LNG terminal will be constructed by the consortium of the Angola LNG II project. Partners in this consortium consist of Galp Energia, Eni, Gas Natural, Exem and the operator Sonagas.
B
RAZILGalp Energia is present in seven basins namely; Santos, Espirito Santo, Potiguar, Sergipe/Alagoas,
Pernambuco, Campos and
Amazonas. Santos basin is the area that has received the most attention with recent discoveries in areas such as Tupi and Iara in BM-S-11 block, Jupiter with block BM-S-24, the Bem-te-vi with block S-8 and the Caramba in BM-S-21. The Tupi Field in BM-S-11 block holds an estimated 5-8 billion barrels of oil and gas with high quality oil of 28° API. The oil is located at pre salt levels, 5-7 km underground. The production process will use FPSO’s and the pilot project will reach an estimated 90 kbopd and 5 million cubic meters of gas this year. 10 FPSO’s are expected to be taken in use for the complete Tupi field, with the second FPSO being operational in 2013. The first stage CAPEX is considered to reach $3.7 bln.
Recent Discoveries in the Iara well also located in BM-S-11 block shows that there are possible 3-4 billion barrels of recoverable oil and natural gas with a degree of 30° API. Considering the size of this field compared with the Tupi field this is a remarkable find and makes us wonder the real capacity of oil resources located in the whole Tupi field.
”Galp Energia enjoys
a presence in seven
basins in Brazil”
”Tupi field holds an
estimated 5-8 billion
barrels of oil and gas”
”recent discoveries
show that Iara well
could contain 3-4
billion barrels or
recoverable oil and
gas”
16
Galp Energia an attractive company to watch in the future due to their sudden increase in resource base.
Galp Energia has set a future goal of producing 150,000 kbopd and these fields will help them reach their target. Consortium operating in these two fields consists of Petrobras, BG and Galp Energia.
In 2009 Galp Energia entered into a joint venture with Petrobras, the BG Group and Repsol with Galp holding a 16.3% stake. The purpose for this joint venture is to develop three FEED projects for a floating LNG unit to operate in the Santos Basin. At current time the decision of how to recover the gas reserves in Santos Basin has not been finalized and other solutions are still being discussed. The deadline for determining the optimal solution for gas extraction will be decided in 2011, and if the FEED project will be green lighted, it is estimated that the project will be up and running in Q3 of 2015. The unit will be installed next to the FPSO7 and will receive, process and liquefy up to 14 million cubic meters of gas per day. The FLNG8 will also store and transfer processed products to gas carrier vessels, which, in turn, will transport them to the final market. The rest of Galp Energia’s offshore projects are still at early stages with the first exploration well being drilled in the Espirito Santos basin this year. The field stretches over 722 km2 and is located roughly at a water depth of 2000 meters. Galp Energia owns a 20% stake in the field. In Campos basin, 3D seismic tests have been made on block C-M-593 where Galp owns a 15% stake. The field expands over 84.64 km2 and is located close to several other discovered fields, so there is reason for optimistic thoughts. In Pernambuco Basin Galp holds a 20% stake in three blocks, where 3D seismic tests are expected to be completed this year.
Galp Energia is keeping up its partnership with Petrobras for their onshore projects where they both control a stake of 50% in the three basins Sergipe/Alagoas, Potiguar and Amazonas. Discoveries of light oil in Potiguar basin wells 1-GALP-1RN and 1-FAC-2-RN are confirmed with production to be realized as early as this year.
7
FPSO:Floeating Production Storage and Offloading
8
FLNG: Floating Liquefied Natural Gas Facility
”galp energia has set a
future goal of 150,000
kbopd of production”
”several offshore projects
in Brazil, however they
are still at early stages”
”galp energia enjoys a
stable partnership with
brazilian state owned
company Petrobras”
17
O
THER PROJECTSMozambique: Galp Energia entered in 2007 a consortium that is exploring area 4 in Rovuma basin. Seismic tests reveal several prospects that go beyond past predictions. First well test drilling will commence in 2011 and the exploration phase is expected to finish in 2015. Consortium for this area consists of; Galp Energia, ENH, Kogas and the operator ENI.
East Timor: This project is still under very early stages and exploration drilling is expected to be initiated this year with the exploration period estimated to be ended by November 2013. Galp Energia has exposure in blocks A,B,C,E and H. The Consortium in these blocks are divided into, Galp Energia, Kogas and ENI as the operator.
Portugal: Galp Energia signed contracts with the Portuguese state in 2007 for seven blocks divided into two basins, namely Peniche basin and Alentejo basin. Seismic 3D campaigns are planned to be executed this year, following with exploration drilling in 2011. Consortium in Peniche Basin consists of Galp Energia(30%), Partex(20%) and Petrobras(50%) and in Alentejo basin, Galp Energia(10%), Partex(10%) and operator Tullow Oil(80%).
Uruguay: In 2009 this project was added to Galp Energias exploration portfolio. They were awarded two areas namely 3 and 4 in the Punta del Este Basin with expected seismic tests to last until 2017 with possible drilling of two exploration wells. If the project is successful, first oil extraction is planned in 2021. Consortium consist of Galp Energia(20%), Petrobras(40%) which is operating leader in block 4 and Repsol(40%) being operating leader in block 3.
Venezuela: Galp Energia is currently in a partnership with the state owned oil company PDSVA, bringing a possible exploration project in block Boyaca 6 which is located in the Orinoco oil belt. Galp also shares a presence in two LNG projects on Deltana and Mariscal Sucre platforms. Contract date for investment in these projects expires in 2011.
Source: Galp Energia Chart 9:
Source: Galp Energia Chart 10:
Source: Galp Energia Chart 11:
18
Galp Energia operates mainly in the Iberian Peninsula with two refineries located in Portugal, namely Sines and Porto refinery. They are the only refiner in Portugal and enjoy a 20% market share in the Iberian refining capacity. Their products are marketed through their service stations, but they also manage business in Africa and export to Europe and North America. Galp Energia’s strategy is to focus on organic growth in this segment to support their further expansion in exploration & production. Their presence in Spain increased considerably after their acquisition of Agip and ExxonMobil giving Galp Energia an enlarged market share in the Iberian Peninsula. It is not expected that this will increase significantly in the future due to their strategy of organic growth and there are no plans of acquiring more operations in Spain.
A
NALYSIS OF THE MARKETEconomic recovery has improved refining margins and product demand in April showing positive signs in certain markets. OPEC May 2010 report state that WTI crude oil on the US Gulf grew by 78cents to $6.80/b in April up from $6.02/b in March. In Europe where financial difficulties still are roaming the zone are followed by higher costs of North Sea crude oil. The refining margins dropped 11cents to $1.77/b in April down from $1.88/b in March. Uncertainties of the economic conditions in the Euro Zone and refineries running with excess capacity are leading to low expectations of any high jumps of refining margins in the short term.
US gasoline demand has produced an upward movement the last two months with 9.26 mb/d in April up from 8.63 mb/d in February. This has created positive effects in refinery throughputs and with gasoline prices reaching roughly $20/b and gasoil showing a slight increase to 9$/b in the end of April. Jet fuel prices were affected by the Icelandic volcano erupting, with the price falling to $-9/b.
”the two refineries
in Portugal which
are located in Sines
and Porto are
controlled by Galp
Energia”
”strategy of organic
growth for the
refining & marketing
segment”
”uncertainties in the
euro-zone and
refineries running
with excess capacity
are leading to low
expectations for
refining margins”
”positive US
gasoline demand
in the past
months”
19
maintenance and nature setting a halt in growth. The gasoline crack spread against Brent crude oil at Rotterdam was reported stable at $14/b. Gasoil prices were noted at $11/b in April, with possible upside movements in the short term due to a slight positive view of European economic conditions, and also an increased US and Asian export demand for gasoil. Jet fuel oil felt the impact of the volcanic ash cloud, however recovery was swift to reach back to normal levels of trading.
According to numbers from the OPEC oil market report the refining operations in the OECD countries have shrunk due to a slow recovery of demand these past months. Spring maintenance on several major refineries has also been scheduled and will hold back utilization rates. However with positive signals in the economy alongside with a season of high demand, refineries are expected to increase their throughputs with expectations of stronger product demand. Asia who currently has ongoing maintenance on their refineries is experiencing slight drops in their refining operations. As graph 5 below points out, Japan & Singapore are decreasing their utility by over 3% and 1% respectively. European countries which have recently experienced economic difficulties are not expected to enjoy the upward lift that the driving season tends to bring, with a 1% increase to 79.9% in utilization rates from March to April. US refinery utilization rates grew 4% since March, reaching 86.9% in April.
Source: OPEC
slowed European
growth”
”positive signals for
OECD countries
growth in demand,
due to high season
approacing”
20
to energy supply. It has become apparent that first generation biofuels that come from grains, seeds, sugar and other food crops are taking a toll on environmental factors along with high economic production costs. The market trend is shifting slowly towards second generation biofuels which are not produced by food crops. This is a long term scope, and numbers from OPEC illustrate that second generation biofuels will not dominate until 2020 onwards. Growth potential in the global biofuel market is estimated at an annual rate of 6.7% until 2030. Total biomass expected growth in production per year is set at an average rate of 3.4% with total consumption following at a slower paste, at roughly 3% which is pointed out in graph 6.
Source: EIA, OPEC, Analyst
R
EFINING: The two refineries Sines and Porto have a combined refining capacity of 310,000 barrels per day, processing crude oil from 15 countries in the world to maintain a diversified portfolio of petroleum products. Sines and Porto refinery holds a nelson index of 6.3, 9.4 and a salomon index of 7.8, 8.0 respectively. There is a conversion project planned on these refineries that will touch a CAPEX of €1.3 billion. This conversion will enable the refineries to process more diesel than gasoline to meet increasing demand in the Iberian.”in recent years,
biofuels have
become more
significant, with an
expected global
annual growth rate
of 6.7% until 2030”
”Sines and Porto
refinery hold a
refining capacity of
310,000 barrels per
day”
Graph 6: Chart 10: Chart 11:21
Source: Galp Energia
It is expected to create a $3 USD/barrel positive impact on the refining margin when this conversion project is completed. The reason for this is the new hydrocracker being installed in the Sines refinery that converts heavier crude oil that can be acquired at lower prices than the light crude. Galp also states that their refineries will be run at roughly 95% efficiency after the conversion. The project is expected to be completed in Porto 3Q11 and Sines in 4Q11.
Source: Galp Energia, Analyst
”conversion project
is expected to create
a $3 per barrel
increase in refining
margin”
Source: Galp Energia
22
the energy sector where prices have a high tendency of extreme price jumps. There are four main factors to take into consideration when evaluating refining margins. It is necessary to look at the type of crude being processed (light or heavy), the complexity of the refinery9, supply and demand of crude products and the utilization rate of the refineries. As explained above, when Galp Energia completes their conversion project their estimated refining margin will be inched up $3 USD/barrel, floating at a comfortable level above the benchmark.
B
IOFUELS: With European countries moving towards a greenerenvironment, Galp Energia has no intention of being left behind in the development of biofuels. In 2009 Galp was already delivering the option of using biofuels with their FAME product, which is a first generation biodiesel. They are also focusing more extensively on production of green diesel (second generation biodiesel). The year was also of great significance to the development of their project regarding plantations of palm oil in Belêm, Brazil with over 1.1 million JCL (Jathropa Curcas Linn) plants grown and ready to be planted this year, covering an area of around 6.500 hectare. Mozambique is also an area where Galp Energia operates in biofuel production, with over 640,000 planted JCL plants over an area of 500 hectare.
M
ARKETING: Retail sales went up 35% in 2009 relative to 2008, increasing to 3.6 million ton. Galp Energia kept its leadership position with a market share of 35% in Portugal. After the acquisition of Agip and Exxon Mobil in the Iberian, their main focus has been on organic growth and improving their services to their clients by making their premium products more available.Since the launch of their Gforce 95 gasoline product in 2007, sales of this product has reached 10% of their total sales, attaining the highest penetration rate in Europe.
9
Hydroskimming with a distillation unit, a refinery with a visbreaker or a refinery using a catalytic cracker/hydrocracker which is the most complex.
”european countries
moving towards a
more greener
environment”
Chart 13:
Source: Galp Energia Chart 14:
23
Demand for gasoline and diesel in Spain contracted in 2009, led by financial difficulty and is not expected to change significantly in 2010. This aside, Galp Energia’s sales in Spain increased by 100% leaving them with a 41% market share in the Iberian Peninsula, up from 27% the previous year. The acquisition of Agip and Exxon has benefited Galp Energia at higher levels than expected, with current ownership of 1,451 service stations in the Iberian Peninsula. As demand in the fuel market is still weak, Galp has stepped up their focus on delivering more additional services such as repair, washing facilities, restaurant and hotel facilities and they are also looking inside their business to become more cost efficient for sustained revenue growth.
Wholesale rose by 64% and 2% in Spain and Portugal, respectively. This led to a total increase of sales in the Iberian by 24%. Sales to marine, aviation and industrial dominated in the Portuguese sub segments, reaching a 75% share of total sales. Galp Energia in Spain has reached a status as a model operator in marketing diesel for transportation, agriculture and heating, and also fuel oil to several industries touching volumes of 72% of total sales. The recent acquisition opened the doors for business in 20 Spanish Airports and also operations in the Canary Islands.
In LPG Galp Energia’s client base include around 500,000 clients with sales of bottled LPG having 67% of sales, the butane gas bottle PLUMA and some piped gas. This segment also benefits strongly from the acquisition where synergies are expected to take effect this year, giving Galp Energia a competitive advantage in the Spanish LPG market.
”acquisition of Agip
and Exxon has
benefited Galp
Energia at higher
levels than expected”
”Galp Energia’s
client base in LPG
includes around
500,000 clients”
Chart 15:
Source: Galp Energia
Chart 15:
Source: Galp Energia
Chart 17:
24
Galp Energia’s strategy for this segment is to develop an integrated portfolio of natural gas and power generation projects. They import natural gas from Algeria through a pipeline and also from Nigeria by LNG methane tankers to their distribution and marketing segment in the Iberian Peninsula.
In 2009 they imported 4.8 billion cubic meters of natural gas, down 15% from 2008. 2 billion came from Algeria, 1.9 from Nigeria and the rest was purchased at the spot market when pricing was more favorable for Galp. Galp Energia also owns and operates cogeneration plants with new CCGT plants in the process of being constructed. The future goal of Galp is to acquire higher market share in its neighbor country Spain. To reach this goal their aim is to expand their sourcing capacity and also enter into the midstream LNG business with focus on projects in Angola and Venezuela. Galp Energia is also planning to enlarge their presence in renewable energy, mainly wind power.
A
NALYSIS OF THE MARKETNatural Gas: According to OPEC’s World outlook report from 2009, gas
demand in the OECD countries are expected to hold a modest growth in the future with a mere 0.3%-0.4% increase per year. This can be explained by strong growth in the past ranging from 3-4% growth per year. A slower growth is estimated since distribution networks are operating close to their limits, and are not expanding to meet further strong demand. In contrast, developing countries energy demand can be expected to grow at a high paste supported by their major economic growth. Graph 8 below illustrates that their need for natural gas is estimated to reach OECD levels as early as 2020.
Russia and the rest of the countries from the former Soviet Union are the third largest players in the gas market with an expected growth just touching 1% per year.
”Galp Energia owns
and operates CCGT
plants, with new
plants on the way”
”according to
OPEC, gas demand
is expected to hold a
modest growth of
0.3-0.4% in the
OECD countries”
25
Source: BPI Statistical Review, OPEC, Analyst
Hydropower: Numbers from 2009 show that hydropower contributed to 16% of the market share in global energy production. Developed countries are already reaching their maximum capacities, however developing countries have just acquired a taste for hydropower production and there are expansion possibilities in these areas. Referring to OPEC’s forward scope in this market, global demand will grow at roughly 2.3% per year, with China leading the way at an estimated 4.4% growth potential per year.
Source: BPI Statistical Review, OPEC, Analyst
”numbers show that
hydropower
contributed to 16%
of the global energy
production”
26
N
ATURAL GAS: This segment is comprised of regulated andunregulated activities in Portugal. Sales in the Iberian market declined by 17% in 2009 compared with 2008 with sales at 4.680 million cubic meters. The market is still bearing the effect of the economic slowdown and also a stronger demand in hydropower due to a higher than expected raining season. Galp Energia increased their presence in the natural gas segment by their Madrid acquisition from Gas Natural in 2009 at a price tag of €800 million.
This left them with an increased client base of 504,000 households with a total annual consumption of 400 million cubic meters. In Portugal Galp Energia is the market leader of distribution and marketing activities with over 900,000 clients, so with this acquisition they are the second largest player in the Iberian Peninsula with a total market share of 15%.
The unregulated market consists of sales to electricity producers, industry and trading. Sales to electricity producers fell by 12%, due to higher demand in hydro generated products and the usage of coal for thermal production. Galp Energia sold 1,010 million cubic meters of gas to industries pushing sales of 887 million cubic meters more than in 2008. The reason for this increase can be explained by the loss of the competitiveness the regulated market used to enjoy by the regulated tariff. Sales to Spain in 2009 went up by 45% to 165 million cubic meters, giving Galp Energia a market share of 1% in a market with a demand of over 15 billion cubic meters which can be explored. In trading, sales contracted by 69% due to lower demand in Spain and sales margins dropping as a response to the global natural gas demand.
In the regulated market Galp Energia sold volumes of 1.472 million cubic meters down 39% from 2008. Industrial, residential and commercial sub segments were the dominant areas of sales with industrial sales contracting 48% in 2009 due to movement away from the regulated and into the regulated market. The commercial and residential segment increased 1% relative to 2008 reaching sales of 291 million cubic meters.
Source: Galp Energia
Chart 20:
Source: Galp Energia Chart 21:
Source: Galp Energia Chart 22:
27
P
OWER:Galp Energia’s strategy for this segment is to develop a competitive power portfolio. Already operating cogeneration plants are Carrico, Powercer and Energin which are part of owned by Galp Energia. The plants have a joint capacity of 80 megawatts with a 2009 electrical power generation of 556 gigawatts/hour and a consumption of 164 million cubic meters of gas.
In 2009 a new cogeneration plant in the Sines refinery became operational, doubling the cogeneration capacity to 160 megawatts. The plant is expected to consume 250 million cubic meters of natural gas per year, however this new cogeneration plant will create a positive effect on the cost efficiency of the Sines refinery. It will improve their energy efficiency, lowering thermal energy costs, cut back emission of sulphur and nitrogen oxides and also reduce domestic CO2 emission. According to Galp this will lead to an expected reduction of 23% in the primary energy consumption. In October 2009 the cogeneration plant was operating at 99.5% and supplied the Sines refinery with a total of 821,166 tonnes of steam.
O
VERVIEW OF PLANNED PORTFOLIO:”strategy to develop a
competitive power
portfolio”
”new cogeneration
plant in the Sines
refinery will improve
energy efficiency”
Source: Galp Energia Chart 23:
28
A similar project for their Porto refinery is under construction, and can be expected operational in 2011. The plant will be equipped with two gas turbines, creating a production of 80 megawatts. They also plan to connect the two gas turbines with recovery boilers, so that Porto’s steam consumption will be met by this cogeneration plant. The planned construction of the Sines CCGT plant is still under negotiations with bidders for engineering and construction. The expected installed capacity will reach 800 megawatts. The plant’s estimated gas consumption will reach 820 million cubic meters per year, which could leave Galp Energia with possible synergies due to their strong gas segment. This is a joint venture project with Galp Energia holding roughly 50% ownership.
Galp Energia enjoys a reasonable share in the wind power market, with a 49% ownership the company Ventinveste S.A. The company was awarded installation of generation capacity reaching 400 megawatts with 6 wind farms in 2009.
F
INANCIAL STATEMENTS
2009 2010E 2011E 2012E 2013E 2014E 2015E
INCOME STATEMENT
Sales 11,728,447 12,798,645 16,300,464 17,262,504 18,256,251 19,316,825 20,422,482 Services rendered 279,898 305,561 389,165 412,133 435,859 461,179 487,576 Other operating income 130,034 141,868 180,684 191,348 202,363 214,119 226,375 Total operating income: 12,138,379 13,246,073 16,870,313 17,865,985 18,894,473 19,992,123 21,136,433 Cost of sales 10,193,419 10,861,780 13,833,656 14,650,108 15,493,468 16,393,541 17,331,875 Other operating costs 1,189,498 1,298,635 1,653,952 1,751,567 1,852,399 1,960,012 2,072,199 Total operating costs: 11,382,917 12,160,415 15,487,609 16,401,675 17,345,867 18,353,553 19,404,075
EBITDA 755,462 1,085,659 1,382,704 1,464,310 1,548,606 1,638,570 1,732,359 Income before tax: 451,393 707,175 915,094 971,870 1,030,506 1,093,091 1,158,329 Income tax expense -98,597 -165,147 -213,702 -226,961 -240,654 -255,270 -270,505
Net Income 347,272 548,273 704,357 747,056 791,158 838,228 887,294
EPS 0.42 0.66 0.85 0.90 0.95 1.01 1.07
”similar project under
way for the Porto
refinery, and can be
exepcted operation in
2011”
Table 6:
29
Assets 7,242,446 8,117,325 10,123,684 10,518,551 11,173,338 11,692,282 12,249,809 Non-current assets: 4,416,085 5,262,616 6,393,418 6,704,078 7,024,978 7,367,456 7,724,493 Tangible fixed assets 3,688,002 4,524,879 5,626,121 5,928,661 6,241,171 6,574,697 6,922,401 Investments 230,171 230,461 230,461 230,461 230,461 230,461 230,461 Other 497,912 507,276 536,836 544,957 553,345 562,298 571,631 Current assets: 2,826,361 2,854,709 3,730,266 3,814,473 4,148,360 4,324,826 4,525,315 Inventories 1,228,833 1,309,637 1,667,965 1,766,407 1,868,093 1,976,617 2,089,755 Receivables 1,350,079 1,475,424 1,879,112 1,990,016 2,104,575 2,226,837 2,354,297 Other 247,449 69,648 183,190 58,050 175,693 121,371 81,263 Equity 2,388,663 2,836,271 3,426,846 4,022,407 4,662,543 5,350,746 6,088,689 Liabilities: 4,853,783 5,281,054 6,696,838 6,496,144 6,510,795 6,341,536 6,161,120 Non-current liabilities: 2,347,009 2,311,543 2,104,446 1,557,237 1,562,704 1,387,025 1,416,189 Current liabilities: 2,506,774 2,969,511 4,592,392 4,938,907 4,948,091 4,954,511 4,744,931Total equity and
liabilities 7,242,446 8,117,325 10,123,684 10,518,551 11,173,338 11,692,282 12,249,809
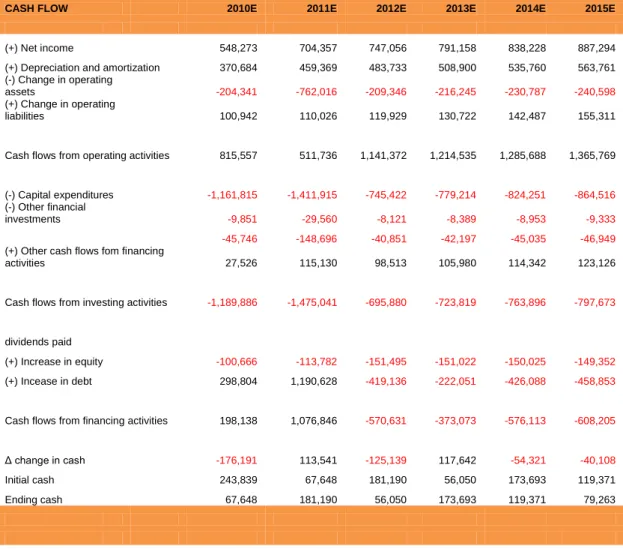
CASH FLOW 2010E 2011E 2012E 2013E 2014E 2015E
(+) Net income 548,273 704,357 747,056 791,158 838,228 887,294 (+) Depreciation and amortization 370,684 459,369 483,733 508,900 535,760 563,761 (-) Change in operating
assets -204,341 -762,016 -209,346 -216,245 -230,787 -240,598
(+) Change in operating
liabilities 100,942 110,026 119,929 130,722 142,487 155,311
Cash flows from operating activities 815,557 511,736 1,141,372 1,214,535 1,285,688 1,365,769
(-) Capital expenditures -1,161,815 -1,411,915 -745,422 -779,214 -824,251 -864,516
(-) Other financial
investments -9,851 -29,560 -8,121 -8,389 -8,953 -9,333
-45,746 -148,696 -40,851 -42,197 -45,035 -46,949
(+) Other cash flows fom financing
activities 27,526 115,130 98,513 105,980 114,342 123,126
Cash flows from investing activities -1,189,886 -1,475,041 -695,880 -723,819 -763,896 -797,673
dividends paid
(+) Increase in equity -100,666 -113,782 -151,495 -151,022 -150,025 -149,352
(+) Incease in debt 298,804 1,190,628 -419,136 -222,051 -426,088 -458,853
Cash flows from financing activities 198,138 1,076,846 -570,631 -373,073 -576,113 -608,205
Δ change in cash -176,191 113,541 -125,139 117,642 -54,321 -40,108
Initial cash 243,839 67,648 181,190 56,050 173,693 119,371 Ending cash 67,648 181,190 56,050 173,693 119,371 79,263
Table 7 – Source: Galp Energia, Analayst
30
Research Recommendations
Buy Expected total return (including dividends) of more than 15% over a 12-month period.
Hold Expected total return (including dividends) between 0% and 15% over a 12-month period.
Sell Expected negative total return (including dividends) over a 12-month period.
This report has been prepared by a Masters of Finance student following the Equity Research – Field Lab Work Project for exclusively academic purposes. Thus, the author is the sole responsible for the information and estimates contained herein and for the opinions expressed, which exclusively reflect his/her own personal judgement. All opinions and estimates are subject to change without notice. NOVA or its faculty accepts no responsibility whatsoever for the content of this report nor for any consequences of its use. The information contained herein has been compiled by students from public sources believed to be reliable, but NOVA or the students make no representation that it is accurate or complete and accept no liability whatsoever for any direct or indirect loss resulting from the use of this report or its content.
The author hereby certifies that the views expressed in this report accurately reflect his/her personal opinion about the subject company and its securities. He/she has not received or been promised any direct or indirect compensation for expressing the opinions or recommendation included in this report.
The author of this report may have a position, or otherwise be interested, in transactions in securities which are directly or indirectly the subject of this report.
NOVA may have received compensation from the subject company during the last 12 months related to its fund raising program. Nevertheless, no compensation eventually received by NOVA is in any way related to or dependent on the opinions expressed in this report.
The School of Economics and Management at NOVA is a public university thus not dealing for, advising or otherwise offering any investment or intermediate services to market counterparties, private or intermediate customers.
This report may not be reproduced, distributed or published without the explicit previous consent of its author, unless when used by NOVA for academic purposes only. At any time, NOVA may decide to suspend this report reproduction or distribution without further notice.