Assessment of genetic diversity in the Russian olive (Elaeagnus
angustifolia) based on ISSR genetic markers
1Avaliação da diversidade genética em Oliva Russa (Elaeagnus angustifolia) com base
em marcadores genéticos ISSR
Leila Sadat Asadiar2*, Fatemeh Rahmani2 e Abbas Siami2
ABSTRACT - Elaeagnus is a Eurasian tree with 77 species worldwide. In this study, ISSR markers were used to
establish the level of genetic relationships and polymorphism across nine genotypes of Elaeagnus angustifolia collected from 9 different regions of West Azarbaijan province. The ISSR analysis with 11 anchored primers also generated 116 scorable loci, of which 92 were polymorphic (79.3%). The estimated Jaccard similarity coefficient ranged from 0.44 to 0.76 for the ISSR markers. Cluster analysis was carried out, based on the Unweighted Pair Group Method with Arithmetic Averages (UPGMA) and the dendrogram drawn with the help of the NTSYSpc 2.02 software. The analysis revealed 5 main clusters for the ISSR data. According to our results, there is a relatively high genetic distance across E.
angustifolia genotypes in the West Azarbaijan province of Iran. Furthermore, it could be inferred that ISSR markers are
suitable tools for the evaluation of genetic diversity and relationships within the Elaeagnus genus.
Key words: Dendrogram. Russian olive. Genetic variation. Molecular marker.
RESUMO - A Elaeagnus é uma árvore da Eurásia com 77 espécies em todo o mundo. Neste estudo, marcadores
ISSR foram usados para estabelecer o nível de relações genéticas e polimorfismo entre nove genótipos de Elaeagnus
angustifolia, coletados em 9 diferentes regiões da província do Azerbaijão Ocidental. A análise ISSR, com 11 primers
ancorados, também gerou 116 loci contáveis, dos quais 92 polimórficos (79,3%). O coeficiente de similaridade de Jaccard estimado, variou de 0,44 a 0,76 para os marcadores ISSR. A análise de agrupamento foi realizada com base no Método não-ponderado de pares não-agrupados, com médias aritméticas (UPGMA), e a dendrograma elaborada com a ajuda do software NTSYSpc 2.02. A análise revelou cinco grupos principais para os dados ISSR. De acordo com nossos resultados, há uma distância genética relativamente alta entre genótipos de E. angustifolia na província de Azarbaijan Ocidental no Iran. Além disso, pode-se inferir que os marcadores ISSR são ferramentas adequadas para a avaliação da diversidade genética e as relações dentro do gênero Elaeagnus.
Palavras-chave: Dendrograma. Oliva russa. Variação genética. Marcador molecular.
*Autor para correspondência
1Recebido para publicação em 17/10/2011; aprovado em 20/07/2012
Research by Institute of Biotechnology, Urmia University, Urmia, Iran
2Department of Biology and Institute of Biotechnology, Urmia University, Urmia, Iran, lasadiar65@gmail.com, f.rahmani@urmia.ac.ir,
INTRODUCTION
The Elaeagnaceae is a small family with three genera: Elaeagnus L., Hippophae L. and Shepherdia Nutt and has 77 species worldwide (SUN; LIN, 2010). Temperate Eurasian Hippophae as well as North American Shepherdia only consists of three species, whereas Elaeagnus L. is the largest with a wide distribution in eastern Asia, extending to Southeast Asia and Queensland in northeastern Australia. The diversity of the genus Elaeagnus is centered in China (SUN; LIN, 2010). E. angustifolia is a deciduous tree, sometime shrub, erect, to 10 m tall in cultivation. Flowers are yellowish white and fruit ellipsoid or subglobose (SUN; LIN, 2010).
This Eurasian tree has become naturalized and has invaded zones along watercourses in many arid and semiarid regions of the world (KLICH, 2000). E. angustifolia plays a very important role in maintaining ecosystem function in the hyper arid areas, because of its tolerance to severe drought, high salinity and alkalinity in soils (WANG et al., 2006). The species has various ecological, medicinal and economical uses. The ripe fruits of E. angustifolia have been used to treat amoebic dysentery. In folk medicine, oleaster fruit or flower preparations are used for treating nausea, vomiting, jaundice, asthma and flatulence (WANG et al., 2006). An infusion of the fruit has been used in Iranian traditional medicine as an analgesic agent for alleviating pain in rheumatoid arthritis patients. The flower is traditionally used for treating tetanus (HOSSEINZADEH; RAMEZANI; NAMJO, 2003).
Although morphological traits are valuable in identifying genotypes, the results are not completely reliable because morphological traits can be affected by environmental factors and cultivation conditions (STRUSS et al., 2001). These markers directly measure variations at the DNA level and are not affected by environmental factors and developmental stages (SARABI et al., 2010; SARKHOSH et al., 2006).
Since the mid 1980s, PCR (Polymerase Chain Reaction) technology and a large number of marker protocols have been developed. PCR based techniques developed in recent years such as Random Amplified Polymorphic DNA (RAPDs) (WELSH; MCCLELLAND, 1990; WILLIAMS et al., 1990), Inter Simple Sequence Repeats (ISSR) (ZIETKIEWICZ; RAFALSKI; LABUDA, 1994), Amplified Fragment Length Polymorphism (AFLPs) (VOS et al., 1995) and Simple Sequence Repeats (SSR) (WEBER; MAY, 1989).
All these DNA markers are dispersed throughout plant genomes and are easier to reproduce and analyze.
Since 1994, inter-simple sequence repeat (ISSR) molecular marker technique developed by Zietkiewicz, Rafalski and Labuda (1994) has become available. ISSR markers have the advantages of high reproducibility and relatively low cost (GONZALEZ; COULSON; BRETTELL, 2002; GOULAO; OLIVEIRA, 2001).
ISSR markers can also be applied in population genetic studies of plant species as they effectively detect very low levels of genetic variation (ZIETKIEWICZ; RAFALSKI; LABUDA, 1994). They also require small amounts of DNA without involving radioactive labels and no prior genomic information is required for their use (BORNET; BRANCHARD, 2001).
Based on literature research, genetic relationship of E. angustifolia has been analyzed based on RP-HPLC biochemical markers (WANG et al., 2006) and there is no published report using any DNA marker system in the world. In the present study, we employed ISSR marker to investigate genetic variation among different genotypes of E. angustifolia.
MATERIAL AND METHODS
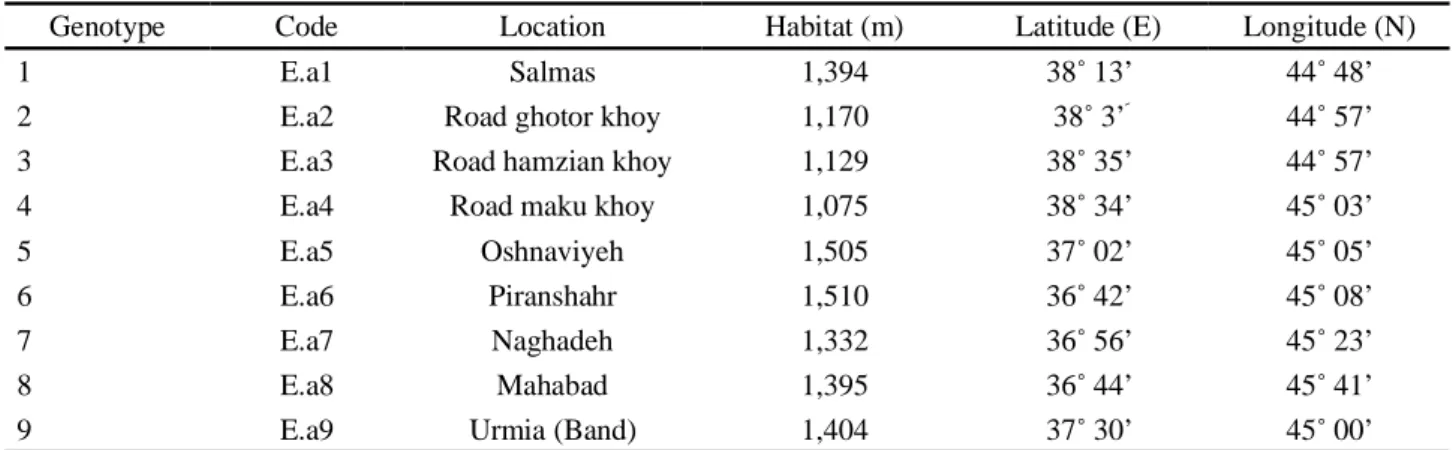
Plant materialLeaves of E. angustifolia were collected from 9 different regions of West Azarbaijan province of Iran in September 2010 and transferred to -80 °C freezer in Biotechnology Research Center of Urmia University (Tabela 1 and Figura 1).
DNA extraction
Total genomic DNA was extracted from fresh young leaves taken from 5 plants per location following the cetyl trimethyl ammonium bromide (CTAB) method described by Doyle and Doyle (1987) with minor modifications. The concentration of each DNA bulk sample was determined spectrophotometrically at 260 nm (BioPhotometer 6131; Eppendrof, Hamburg, Germany). The quality of the DNA was checked by running 1 µl DNA in 1% (w/v) gels in 0.5% TBE buffer (45 mM Tris base, 45 mM boric acid, 1 mM EDTA pH 8.0). DNA samples that gave a smear in the gel were rejected. DNA was diluted to make uniform concentration of 10 ng µl for PCRs.
ISSR amplification
PCR amplification was performed according to the protocol of Zietkiewicz, Rafalski and Labuda (1994). ISSR amplification reactions were carried out in 25 µl volume containing 0.75 µl MgCl2 (50 mM), 0.5 µl dNTP (10 mM), 2.5 µl PCR buffer (10x), 0.25 µl Taq DNA
Table 1 - Location of E. angustifolia genotypes collected from West Azarbaijan province of Iran
Figure 1 - Geographical distribution of selected E. angustifolia
genotypes in West Azarbaijan province as has been described in Table 1
Genotype Code Location Habitat (m) Latitude (E) Longitude (N)
1 E.a1 Salmas 1,394 38 13’ 44 48’
2 E.a2 Road ghotor khoy 1,170 38 3’ 44 57’
3 E.a3 Road hamzian khoy 1,129 38 35’ 44 57’
4 E.a4 Road maku khoy 1,075 38 34’ 45 03’
5 E.a5 Oshnaviyeh 1,505 37 02’ 45 05’
6 E.a6 Piranshahr 1,510 36 42’ 45 08’
7 E.a7 Naghadeh 1,332 36 56’ 45 23’
8 E.a8 Mahabad 1,395 36 44’ 45 41’
9 E.a9 Urmia (Band) 1,404 37 30’ 45 00’
polymerase (5u / µl), 0.3 µl Primer (100 µM), 1 µl template DNA (10ng/ µl) and 19.7 µl ddH2O. Eighteen ISSR primers were purchased from Cinnagen, Inc., Tehran, Iran (Tabela 2). DNA amplifications were performed using Veriti ® 96 well Thermal Cycler (Applied Biosystem, USA). The amplification reactions were carried out using Time Release program following these steps: Initial denaturation for 3 min at 95 º , followed by 35 cycles of 95 º for 30 sec, annealing at 50 for 45 sec, extension at 72 º for 2 min and a final extension at 72 º for 10 min. Tubes were held at 4 º until removal.
Electrophoresis
Amplified products were electrophoresed (Bio-Red Company, Eppendorf) on 2% agarose in 0.5X TBE buffer. The gels stained with ethidium bromide (1.0 µg/ml) and photographed under UV light in a gel
documentation system (Carestream 212 Pro, USA). Primers which gave reproducible fingerprints (DNA bands) were considered for the data analysis.
Data analysis
Each ISSR band was considered as an independent locus and polymorphic bands were scored as absent (0) or present (1) for all the 9 genotypes. Only clearly reproducible bands were scored and differences in band intensity were not considered. Faint or unclear bands were not considered. Data analyses were conducted using only the polymorphic bands. Genetic similarity matrix was generated using Jaccard’s similarity coefficient (JACCARD, 1908). The cluster analysis was performed based on Unweighted Pair Group Method with Arithmetic Averages (UPGMA) and dendrogram drawn by help of NTSYS pc 2.02 software (ROHLF, 2000).
RESULTS AND DISCUSSION
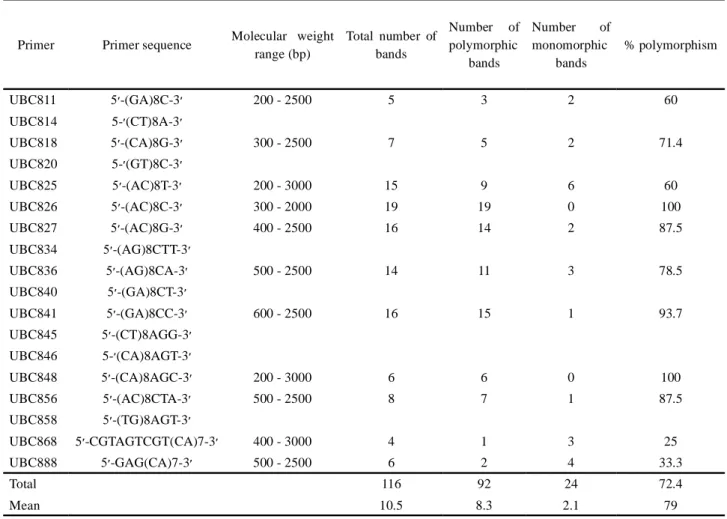
Out of 18 ISSR primers tested, 11 gave distinct polymorphic products. Typical results obtained with primer 825 are shown in Figure 2.
The size of the amplified products ranged from 200 to 3,000 bp. Eleven primers generated 116 scorable loci, which 92 were polymorphic (79.3%). The number of bands varied from 4 (primer 868) to 19 (primer 826) with an average of 10.5 markers per primer. The polymorphism level, calculated as the number of polymorphic bands per primer ranged from 25% (primer 868) to 100% (primers 826, 848). The average number of polymorphic bands per primer was 12.6. Minimum and Maximum number of polymorphic bands was obtained with the primers 868 (1) and 826 (19), respectively (Tabela 2). Two primers showed high level of polymorphism, seven revealed relatively
Figure 2 - Amplified PCR products generated using primer
825 for 9 genotypes of E. angustifolia.1, 2, 3, 4, 5, 6, 7, 8, 9 are representative of the Salmas (E.a1), Jade ghotor khoy (E.a2), Jade hamzian khoy (E.a3), Jade maku khoy (E.a4), Oshnaviyeh (E.a5), Piranshahr (E.a6), Naghadeh (E.a7), Mahabad (E.a8) and Band (E.a9), respectively. M: DNA Ladder (100 - 3000bp). The arrow Shows polymorphic band
informative ( 50%) and two were comparatively less informative (< 50% polymorphism).
The similarity coefficient among different genotypes of E. angustifolia ranged from 0.44 (between E.a2 and E.a4) to 0.76 (between E.a6 and E.a8) (Tabela 3).
The cophenetic correlation coefficient between the similarity matrix and the UPGMA dendrogram was r = 0.8, indicating a relatively good representation of relationships among genotypes in the dendrogram. The dendrogram revealed five main clusters (Figura 3).
Cluster consisted of E.a1 and E.a4. Cluster was further divided into 2 sub clusters. The first sub cluster consisted of E.a3 and the second sub cluster comprised of E.a6 and E.a8. Clusters and V each included one genotype, E.a2 and E.a9, respectively. E.a5 and E.a7 were grouped in cluster V. E.a6 and E.a8 appeared to be closer to each other, with a 0.62 similarity coefficient (Tabela 3).
Table 2 - List of ISSR primers, the number of amplified products, the number of polymorphic and monomorphic bands, and percentage
of polymorphism obtained by analyzing 9 genotypes of E. angustifolia
Primer Primer sequence Molecular weight range (bp) Total number of bands Number of polymorphic bands Number of monomorphic bands % polymorphism UBC811 -(GA)8C-3 200 - 2500 5 3 2 60 UBC814 5- (CT)8A-3 UBC818 -(CA)8G-3 300 - 2500 7 5 2 71.4 UBC820 5- (GT)8C-3 UBC825 -(AC)8T-3 200 - 3000 15 9 6 60 UBC826 -(AC)8C-3 300 - 2000 19 19 0 100 UBC827 -(AC)8G-3 400 - 2500 16 14 2 87.5 UBC834 -(AG)8CTT-3 UBC836 -(AG)8CA-3 500 - 2500 14 11 3 78.5 UBC840 -(GA)8CT-3 UBC841 -(GA)8CC-3 600 - 2500 16 15 1 93.7 UBC845 -(CT)8AGG-3 UBC846 5- (CA)8AGT-3 UBC848 -(CA)8AGC-3 200 - 3000 6 6 0 100 UBC856 -(AC)8CTA-3 500 - 2500 8 7 1 87.5 UBC858 -(TG)8AGT-3 UBC868 5 -CGTAGTCGT(CA)7-3 400 - 3000 4 1 3 25 UBC888 -GAG(CA)7-3 500 - 2500 6 2 4 33.3 Total 116 92 24 72.4 Mean 10.5 8.3 2.1 79
ISSR markers can be used in population genetic studies of plant species as they effectively detect very low levels of genetic variation (ZIETKIEWICZ; RAFALSKI; LABUDA, 1994). This method also may have potential for analyzing biogeographic patterns among populations of a single plant species (LI; CHEN, 2008). High reproducibility of ISSR may be due to the use of longer primers and higher annealing temperatures (MORENO; MART; ORTIZ, 1998) compared with those used normally for other DNA amplification-based techniques, such as the RAPD.
Table 3 - Jaccard’s similarity coefficient among 9 E. angustifolia genotypes based on ISSR data analysis
E.a1 E.a2 E.a3 E.a4 E.a5 E.a6 E.a7 E.a8 E.a9
E.a1 1.0000 E.a2 0.5316 1.0000 E.a3 0.5357 0.5506 1.0000 E.a4 0.6164 0.4432 0.5517 1.0000 E.a5 0.4778 0.5106 0.5789 0.5795 1.0000 E.a6 0.4828 0.4526 0.5870 0.5698 0.5625 1.0000 E.a7 0.5422 0.5930 0.4796 0.4725 0.6022 0.4646 1.0000 E.a8 0.4884 0.4731 0.6292 0.4725 0.4900 0.7683 0.4845 1.0000 E.a9 0.4699 0.5412 0.5109 0.6000 0.5543 0.5109 0.5333 0.4681 1.0000
Earlier studies by Chen et al. (2008) using the ISSR markers for genetic diversity of 5 populations of Hippophae rhamnoides in China based on fingerprinting patterns revealed high levels of genetic variation within populations and subpopulations.
This is the first report of using ISSR markers in surveying genetic variation and determination of genetic relationships in the E. angustifolia. In the present investigation, 11 ISSR primers produced 92 polymorphic and 24 monomorphic bands (79.3% polymorphism) that unambiguously discriminated 9 E. angustifolia genotypes
Figure 3 - Dendrogram obtained with UPGMA based on Jaccard’s similarity coefficient. codes represent the genotypes of E.
Azarbaijan province of Iran. The present study reveals that PCR based fingerprinting techniques (ISSR) are informative for estimating the extent of genetic diversity as well as determining the pattern of genetic relationships.
ACKNOWLEDGEMENTS
The authors give special thanks to authorities of Biotechnology Institute of Urmia University for technical support of this work.
REFERENCES
ARNAU, G.; LALLEMAND, J.; BOURGOIN, M. Fast and reliable strawberry cultivar identification using Inter Simple Sequence Repeat (ISSR) amplification. Euphytica, v. 129, n. 1, p. 69-79, 2003.
BORNET, B.; BRANCHARD, M. Nonanchored Inter Simple Sequence Repeat (ISSR) markers: reproducible and specific tools for genome fingerprinting. International Society for Plant
Molecular Biology, v. 19, n. 3, p. 209-215, 2001.
CHEN, G. et al. Genetic diversity of Hippophae rhamnoides populations at varying altitudes in the wolong natural reserve of China as revealed by ISSR markers. Silvae Genetica, v. 57, p. 1-29, 2008.
CHOWDHURY, M. A.; VANDENBERG, B.; WARKENTIN, T. Cultivar identification and genetic relationship among selected breeding lines and cultivars in chickpea (Cicer
arietinum L.). Euphytica, v. 127, n. 3, p. 317-325, 2002.
DOYLE, J. J.; DOYLE, J. L. A rapid DNA isolation procedure for small quantities of fresh leaf material. Phytochemical Bulletin, v. 19, p. 11-15, 1987.
GONZALEZ, A.; COULSON, M.; BRETTELL, R. Development of DNA markers (ISSRs) in mango. Acta Horticulturae, v. 575, p. 139-143, 2002.
GOULAO, L.; OLIVEIRA, C. M. Molecular characterization of cultivars of apple (Malus domestica Borkh.) using microsatellite (SSR and ISSR) markers. Euphytica, v. 122, n. 1, p. 81-89, 2001.
HOSSEINZADEH, H.; RAMEZANI, M.; NAMJO, N. Muscle relaxant activity of Elaeagnus angustifolia L. fruit seeds in mice. Journal of Ethnopharmacology, v. 84, n. 2/3, p. 275-278, 2003.
JACCARD, P. Nouvelles recherches sur la distribution florale. Bulletin Scoiete Vaudoise des Sciences Naturelles, v. 44, p. 223-270, 1908.
KLICH, M. G. Leaf variations in Elaeagnus angustifolia related to environment heterogeneity. Environmental and
Experimental Botany, v. 44, n. 3, p. 171-183, 2000.
into 5 major clusters. Results indicated the presence of wide genetic variability which reflects a high level of polymorphism at the DNA level. Variations in DNA sequences lead to polymorphism and greater polymorphism are indicative of greater genetic diversity. The ISSR method has been reported to be more reproducible (GOULAO; OLIVEIRA, 2001) and produces more marker patterns than the RAPD approach (CHOWDHURY; VANDENBERG; WARKENTIN, 2002), which is advantageous when differentiating closely related cultivars. ISSR has also been used for cultivar identification in numerous plant species, including sorghum (MEDRAOUI et al., 2007), apple (GOULAO; OLIVEIRA, 2001) and strawberry (ARNAU; LALLEMAND; BOURGOIN, 2003).
Based on morphological traits such as speckles on leaves, color of adaxial leaf surface, shape of leaf blade, shape of leaf apex, shape of leaf margin, shape of leave base, fruit surface type, type of fruit pedicel, presence of wings on fruit surface, shape of fruit, fruit length diameter, fruit width diameter and seed size it was predicted that there is a close relationship between Piranshahr (E.a6) and Mahabad (E.a8) genotypes which is supported by similarity coefficient of 0.76 for ISSR markers. These 2 genotypes showed a high similarity on most morphological traits and clustering using ISSR data, placed them in the same cluster, too. Band genotype (E.a9) was different from the other genotypes based on morphological traits (length of leaves, width of leaves, ripe fruit color, shape of fruit, seed size and fruit length diameter). E.a9 also formed a single cluster itself which could be due to its different genetic background. Our results show relatively high genetic distance (0.24 to 0.56) among E. angustifolia genotypes in West Azarbaijan province in Iran.
This is the first evaluation of genetic diversity of E. angustifolia in Iran. ISSR analysis was applied for the first time to obtain preliminary information on genetic diversity of this plant in the world and this is the start of further studies by more powerful markers. Earlier studies by Sheng et al. (2006) using the RAPD technique provided some information about the relationship between the quantity and distribution pattern of genetic variation in space and time and the geographical or ecological factors that might serve as theoretical evidences for the classification of the species or intraspecific patterns and for the evaluation of the ecological adaptability of Hippophae L.. In order to preserve this highly valuable plant, more samples of this plant should be collected.
CONCLUSION
In conclusion, there is a high genetic variability among studied E. angustifolia genotypes in West
LI, H.; CHEN, G. Genetic relationship among species in the genus Sonneratia in China as revealed by Inter- Simple Sequence Repeat (ISSR) markers. Biochemical Systematics
and Ecology, v. 36, n. 5/6, p. 392-398, 2008.
MEDRAOUI, L. et al. Evaluation of genetic variability of sorghum (Sorghum bicolor L. Moench) in northwestern Morocco by ISSR and RAPD markers. Plant biology and
pathology, v. 330, n. 11, p. 789-797, 2007.
MORENO, S.; MART, J. P.; ORTIZ, J. M. Inter-simple sequence repeats PCR for characterization of closely related grapevine germplasm, Euphytica, v. 101, n. 1, p. 117–125, 1998.
ROHLF, F. J. NTSYS-pc: Numerical Taxonomy and
Multivariate Analysis System. Version 2. 1. New York: Exeter Software, 2000.
SARABI, B. et al. Evaluation of genetic diversity among some Iranian wild asparagus populations using morphological characteristics and RAPD markers. Scientia Horticulturae, v. 126, n. 1, p. 1-7, 2010.
SARKHOSH, A. et al. Markers reveal polymorphism among some Iranian pomegranate (Punica granatum L.) genotypes,
Scientia Horticulturae, v. 111, n. 1, p. 24-29, 2006.
SHENG, H. M. et al. Analysis of the genetic diversity and relationships among and within species of Hippophae (Elaeagnaceae) based on RAPD markers. Plant Systematics
and Evolution, v. 260, n. 1, p. 25-37, 2006.
STRUSS, D. et al. Detection of genetic diversity among population sweetcherry, Scientia Horticulturae, v. 76, n. 3, p. 362-367, 2001.
SUN, M.; LIN, Q. A revision of Elaeagnus L. (Elaeagnaceae) in mainland China. Journal of Systematics and Evolution, v. 48, n. 5, p. 356-390, 2010.
VOS, P. et al. A new technique for DNA fingerprinting, Nucleic
Acids Research, v. 23, p. 4407-4414, 1995.
WANG, Q. et al. Intera-specific genetic relationship analyses of Elaeagnus angustifolia based on RP-HPLC biochemical markers. Journal of Zhejiang University Science B, v. 7, n. 4, p. 272-278, 2006.
WEBER, J. L.; MAY, P. E. Abundant class of human DNA polymorphisms which can be typed using the polymerase chain reaction. American Journal of Human Genetics, v. 44, n. 3, p. 388-484, 1989.
WELSH, J.; MCCLELLAND, M. Fingerprinting genomes using PCR with arbitrary primers. Nucleic Acids Research, v. 18, n. 24, p. 7213-7218, 1990.
WILLIAMS, J. G. K. et al. DNA Polymorphisms amplified by arbitrary primers are useful as genetic markers. Nucleic Acids
Research, v. 18, n. 22, p. 6531-6536, 1990.
ZIETKIEWICZ, E.; RAFALSKI, A.; LABUDA, D. Genome fingerprinting by Simple Sequence Repeat (SSR) anchored polymerase chain reaction amplification. Genomics, v. 20, n. 2, p. 176-183, 1994.