1 A Work Project presented as part of the requirements for the Award of a Master Degree in
Management from the NOVA – School of Business and Economics
Analysis of Lisbon Startups’ Business Intelligence Capabilities
João Miguel Rodrigues Martins e Neves
2513
A Project carried out on the International Master in Management Program, under the supervision of:
Prof. Miguel Neto
2 Abstract
“Business intelligence (BI) is a broad category of applications, technologies, and processes for gathering, storing, accessing, and analysing data to help business users make better decisions.”1
Organisations pursue these activities most often to build competitive advantage or improve the customer experience and it’s, undeniably, expected to have a positive impact on company revenues, margins, and organizational efficiency.2
This work project, Analysis of Lisbon Startups’ Business Intelligence Capabilities, intends to clarify the relationship between the usage of current Business Intelligence & Analytics tools and the success of business enterprises, using three different startups based in Lisbon as case studies to illustrate that: Aptoide, Misk, and Tiger Time.
[Keywords: Business Intelligence, Analytics, BI&A, Startups, Aptoide, Misk, Tiger Time]
Introduction
In recent years, there has been growing recognition of the vital links between an information process and the success of business enterprises. As computational capabilities grew exponentially, and the concept of Big Data turned reality, managers started to rely more on data-driven decisions and less on their own intuition.3 The unarguable success of companies such Google, Facebook,
and Amazon tells us exactly the importance of the correct use of data in today’s world. As The
Economist put it: “The world’s most valuable resource is no longer oil, but data.”4
Despite that evidence, is it possible to guarantee the success of a data driven organisation? Can we avoid the failure of a company with a data driven mindset and processes? According to research by Cambridge Associates, “conventional wisdom says 90% of startups fail but data says otherwise” 5 and, between 2001 and 2010, the real percentage of venture-backed startups that fail
3 has kept below 60%. Despite that, we can easily deduct that, if we include all the startups that failed to raise money from investors, that percentage would be a lot higher. Why is that? In a world with accessible data, why do most startups keep failing? Is that because they’re not data driven? Maybe, is it because they’re not using all the Business Intelligence & Analytics (BI&A) tools available? Or even, is it because the current BI&A tools are not well designed for startups usage? Or is it simply because they’ve not achieved the level of BI&A maturity of larger companies, and their business dies before data can make its impact? Finally, can we extrapolate these numbers and conclusions to the Portuguese economy and ecosystem? What is been doing in the Lisbon ecosystem to enter this new data-economy and achieve success?
As The Guardian said it, Lisbon can be, indeed, the next tech capital.6 After 2016 Web Summit,
Lisbon is, in fact, roaring and prepares to build the world’s biggest startup campus.7 Despite getting
less consideration than other European cities like London, Berlin, or even Barcelona8, more and
more investors, accelerators, and startups are paying attention to Lisbon9 and, in 2016, the
Portuguese startup ecosystem grew twice as much as the European average10. These factors, in an
economy that always relied upon its SMBs as main driving force11, illustrate well the importance
of Portuguese startups as a factor that may be key to guarantee economic recovery.
This work project will then test the hypothesis that Lisbon startups understand the importance and value of data, but don’t take the most advantage of existing BI&A tools. Are there Lisbon Startups failing due to the lack of BI&A usage? How can it be solved?
According to CB Insights’ report The Top 20 Reasons Startups Fail12, most startups go wrong due to: 1) No market need; 2) Run out of cash; 3) Not the right team; 4) Get outcompeted; 5) Pricing/Cost issues; 6) Poor product; 7) No business model; 8) Poor Marketing; 9) Ignore Customers; 10) Product mis-timed; 11) Lose focus; 12) Disharmony in team/investors; 13) Pivot
4 gone bad; 14) Lack of passion; 15) Bad location; 16) No financing or investor interest; 17) Legal challenges; 18) Don’t use network/advisors; 19) Burnout; 20) Failure to pivot.
From those, at least 7 reasons could be attenuated, or even eliminated, with the usage of BI&A tools. What would be the impact on the Lisbon startup ecosystem, and in the national economy, if we were able to eliminate 35% of the main reasons startups fail?
Literature review: main research questions and hypotheses
Since this thesis will cover different topics, from business intelligence to startups and one specific startup ecosystem, we first need to further study each part to better understand the whole and, this way, have a truly holistic and valuable approach. This literature review will then cover a brief history of BI&A, its importance in the success of businesses and then more specifically on BI&A maturity levels.
“Business intelligence (BI) is a broad category of applications, technologies, and processes for gathering, storing, accessing, and analysing data to help business users make better decisions” (Watson, 2009). Its earliest use is dated from 1865, when Richard Devens explained how Sir Henry Furnese gained profit by collecting information, and reacting accordingly, before his competitors.13 Since then, the term has evolved, and several authors have given their understanding
of the topic: Hans Luhn, in 1958, discusses an “automatic system” for the “[…] admission of acquisition of new information, its dissemination, storage, retrieval, and transmittal to the action points […]”14. More recently, in 1996, a Gartner Group report already mentions the “sea of data,”
currently referred as Big Data, to aggregate all the tools used to “synthesize valuable information” into a category called Business Intelligence.15 Being a broad umbrella term that covers several
5 and understand, the larger amount of data they receive daily. Before, it was limited to static and periodic reports in the form of management information systems (MIS). It evolved into executive information systems (EIS) and later to dynamic, multidimensional, ad-hoc reporting. Today it consists of web-based dashboards that take advantage of artificial intelligence and data mining. In the end, as soft and hardware evolve, BI&A tools will change as well. For us, what is important is to understand the added value of data, and to take full advantage of available tools.
BI&A added value has been proven, over the years, not only by the academia but also management case studies all over the world. Chau and Xu identified increased sales16, both Park and Sahoo
recognised the increase of personalized recommendations.17 18 They all acknowledge the increase
in customer satisfaction. Lau studied BI&A importance on strategic decision making in mergers and acquisitions19, Hu on monitoring and mitigation of contagious bank failures20 and Abbasi on
financial fraud detection.21
As stated, there are numerous relevant management case studies, from areas as different as public services, sports, retail, or delivery that illustrate BI&A impact and benefits. Incorporation of BI&A processes with patient data, helped the Washington State Health Care reducing emergency visits and visits by frequent patients by about 10%, hence reducing unnecessary use of emergency room and reducing costs.22 Tesco, the largest retailer in the UK, was able to process data coming from
their loyalty card to increase personalisation and achieved an increase from 3% to 70% in the rate of coupon redemption. They were also able to save 100 million pounds in stock by observing historical sales and optimizing their stock-keeping system.23 It’s also famous the
route-optimization strategy deployed by UPS that minimizes left turns. Their software analyses, in real time, 200 000 possibilities for each route and, as a result, “between 2004 and 2012, UPS saved 10 million gallons of gas and carbon emissions were reduced by 100,000 metric tons (the equivalent
6 of pulling 5,300 cars off the road annually). It also saved the company 98 million idle minutes or about $25 million worth of labour cost each year. In other words, this one simple change increased profits, met customer demands, improved safety and positively affected the environment.”24
The notion of “maturity” has been proposed to evaluate “the state of being complete, perfect, or ready” and, in that sense, “maturity as a measure to evaluate the capabilities of an organisation in regard to a certain discipline has become popular since the Capability Maturity Model (CMM) has been proposed by the Software Engineering Institute at Carnegie Mellon University.”25
In 2007, SAS concluded that only a small part of organisations shows maturity levels high enough to maximise value and utility of information. Hence, maturity level assessment represents a method to increase both parameters.26 In the same way, a recent McKinsey&Company’s survey
(McKinsey&Company, 2016) concluded that, despite the high hopes that organisations and executives put on their BI&A activities, respondents report mixed success in meeting their analytics objectives.
While BI&A continues to be a top tech investment priority, it’s important business leaders understand their organisations strengths and weaknesses on this matter and work to improve their business intelligence maturity level scores. Since “the pace of evolution in BI maturity and the degree of success possible in your company depends partly on its ability to learn about, develop, and implement effective BI and DW [data warehouse] competencies”27, BI&A maturity models
are important because they describe the path that organisations should move to better align technology with business processes. It’s then necessary to first study the most used BI&A maturity models:
7 First developed by Wayne Eckerson in 2004, it was later redesigned in 2009.28 The Data
Warehousing Institute model proposes a five stage BI maturity model, assuming BI
implementation “evolves from a low-value cost centre operation to a high value strategic utility to provide competitive advantage”.29 It concentrates on the technical viewpoints, mainly in data
warehouse. Despite that, from the business viewpoint, it lacks cultural and organisational aspects.30 However, it’s broadly used since its maturity assessment tool and further documentation is available online.31 It’s grading levels are:
1. Infant Stage: composed of the Prenatal phase, until the creation of a data warehouse, and the Infant stage, where the organisation faces several fragmented data sources that produce conflicting views on business information.
2. Child Stage: Information is gathered at a department level and only covers department’s needs. Local data warehouses are built but not linked.
3. Teenager Stage: Broader, more integrated level.
4. Adult Stage: Occurs when BI tools correspond to a strategic resource that allows the organisation to achieve its goals. There’s a centralised management of data sources, common architecture of the DW, and it’s fully loaded with data, flexible and layered, and accomplishes delivery in time, predictive analysis, performance and centralised management.
5. Sage Stage: Completes the cycle by turning BI capabilities into services. The main characteristics of this level are distributed development, data services, and extended enterprise.32
8 Opposite to the TDWI model, HP model depicts a five stage maturity levels from the business side.33 It was designed to describe the evolution of its clients’ BI capabilities and, though it lacks
more technical considerations such as data warehousing and analytical aspects, it shows that BI&A long term success relates to business enablement (understanding the business needs that are solved with BI solutions), strategy and program management (key enablers for BI success) and information management (solutions to solve business problems). According to this model, organisations can be successful by working through the five stages of the model:
1. Operations: focus on running the business
2. Improvement: focus on measuring and monitoring the business
3. Alignment: focus on integrating performance management and intelligence 4. Empowerment: focus on business innovation and people productivity 5. Excellence: focus on strategic agility and differentiation
• Gartner Model
Gartner’s five stage model allows assessing the maturity level of an organisation BI efforts according to three dimensions: people, processes, and metrics and technologies. It’s five stages are:
1. Unaware: “information anarchy” with no real BI capability in place. The major challenges at his level identifying business drivers and understanding the current information management structure.
2. Tactical: at this level, starts investment in BI tools. However, executives lack confidence in data quality and reliability, since there are no common metrics or organisational approach.
9 3. Focused: there’s a stronger commitment to BI among executives since metrics are formally defined. Thus, it’s possible to analyse departmental performance and rises demand for management dashboards. There’s still no formal connection to broad organisational objectives and the challenge is to expand the successes and scope of application and user base.
4. Strategic: BI usage is inter departmental following common metrics and organisational approach. Consequently, it’s possible to assess performance and improvement needs. Data is trusted and acted upon at the executive level. Nevertheless, the challenge is to develop a structure consistent with the company’s business objectives and strategy.
5. Pervasive: BI systems are fully integrated into business tools and processes. Users at multiple levels have information that allows them to manage, innovate and make decisions to drive performance.
• Côrte-Real Model
In 2012, Nadine Côrte-Real proposed a new model for the evaluation of BI maturity within organisations.34 There, Côrte-Real proposes another 5 stages model evaluated according to
different dimensions split between two modules: the first module, corresponding to the first dimension, would be the Base Module and would provide basic, generic information such as “What are the needs that led your company to adopt BI solutions?” and “What is the current scope of your company's BI solution?”. After this first dimension, five others would be analysed, included in the so called Thematic Modules: 1) Strategy and Value; 2) Finance; 3) Project Management and IT Consolidation; 4) Data Infrastructure and BI Platform; and 5) User Experience.
10 Based on these modules, Côrte-Real then designed a questionnaire that aimed to evaluate each organisation on a scale from 1 to 5 (Operational, Reactive, Focused, Consolidated, Optimised) on each one of the nine variables she identified: 1) BI perception; 2) Strategy; 3) Value; 4) Organisation; 5) Financing and investment; 6) Project management; 7) System architecture; 8) Standardisation; and 9) Functionalities.
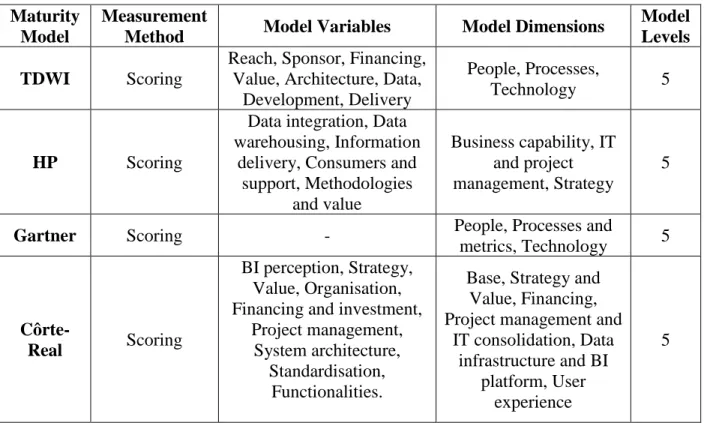
Given the completeness of information regarding the model Côrte-Real proposed, and the fact that her model is, indeed, a combination of some models presented during this literature review, it was the chosen model to evaluate the maturity level of the startups that will be studied.
Maturity Model
Measurement
Method Model Variables Model Dimensions
Model Levels TDWI Scoring
Reach, Sponsor, Financing, Value, Architecture, Data,
Development, Delivery
People, Processes,
Technology 5
HP Scoring
Data integration, Data warehousing, Information
delivery, Consumers and support, Methodologies and value Business capability, IT and project management, Strategy 5
Gartner Scoring - People, Processes and
metrics, Technology 5
Côrte-Real Scoring
BI perception, Strategy, Value, Organisation, Financing and investment,
Project management, System architecture,
Standardisation, Functionalities.
Base, Strategy and Value, Financing, Project management and
IT consolidation, Data infrastructure and BI
platform, User experience
5
Table 1 – Maturity Model Comparison
Nevertheless, none of these matters if we don’t understand the context in which we’re working on. Without it, we cannot identify an ideal stage of maturity of an organisation. To understand the
11 context, we first need to study its ecosystem: where does the organisation operate and who are the other players in the industry.
According to the Global Startup Ecosystem Report 2017,35 a study conducted by Startup Genome
across more than 100 cities, that uses survey responses of around 10 000 founders to provide advanced analysis of the specific drivers of each startup ecosystem, Lisbon is still out of the 2017
Global Startup Ecosystem Ranking Top 20. Lisbon still lags hubs such Silicon Valley, London,
Beijing, Tel Aviv, Berlin, Paris, Stockholm, Amsterdam or even Bangalore, just to mention a few. However, “Lisbon currently counts more than 15 incubators, 20 acceleration programs, and a knockout community of Business Angels and Venture Capital investors. In short, it is not surprising Lisbon is already home to an estimated 200-300 tech startups.” The study continues “Lisbon has ample access to talent, affordable housing, and adequate public transportation, and the coastal location adds to its attractiveness as a spot for founders to establish their firms.” Everything about Lisbon seems just right in what concerns becoming a strong European hub for innovation and entrepreneurship: It hosts world renowned events (Web Summit), it’s home of internationally recognised accelerators and incubators (Beta-i and Second Home), there are political will and strong financial incentives for startups. Additionally, Lisbon startups have 34% of foreign customers and a high score in what concerns access to international markets. It has also the highest percentage of founders with a Master or Ph.D. and the highest rate of women founders in Europe, a sign of inclusive growth that could become a competitive advantage in the long run.
On the other hand, what makes Lisbon a lower ranked ecosystem is, apparently, its infancy: there aren’t still many exits or people with that kind of experience. Despite that, early stage investment is growing at a fast pace and that can only be a strong indicator of future strength.
12 Methodology section
1. Selection of study subject
For the scientific accuracy of this research, it’s fundamental to clearly define the different terminology used. It’s also important to state why it was chosen to be carried this way since different subjects of study would lead to completely different outcomes and any possible extrapolation needs to be carefully analysed: What is a startup? How will geography influence the sample? What can we learn from the selected case studies? And finally, what can we extrapolate from that?
According to Steve Blank’s “The Startup Owner's Manual: The Step-By-Step Guide for Building a Great Company”, a book taught at Stanford, Berkeley, and Columbia, among other leading universities worldwide,36 a startup is “a temporary organisation in search of a scalable, repeatable,
profitable business model”.37
To meet most of these criteria, this research will focus on internet based, technological startups.
Regarding the location of the organisations, this thesis will only cover startups with headquarters in Lisbon. This decision assumes that this is an indicator of where was the company originally founded, and it may be related to the city’s capability to retain or attract talent.
Although it considerably narrows the subject of study of this thesis, and even though most of its conclusions won’t apply to so many of new or early companies founded in recent years, we believe that including non-technological/non-internet companies would tremendously affect the outcome of the research. Since these companies still account for such a large piece of the economic tissue, it can be of great interest to study how its failure levels can be reduced, however, from the BI&A
13 perspective, this research assumed that, in Portugal, any other sector would not be representative of the BI&A state of the art.
Also, any extrapolation can only be applied to the Portuguese economy, mainly due to major differences in the venture capital funding environment among entrepreneurial ecosystems. While, in Lisbon, the early stage funding per startup is worth $201,000 and the whole ecosystem is worth $1.3 billion; Silicon Valley, the most sophisticated startup ecosystem, according to Startup Genome 2017 report, is worth $264 billion, and the early stage funding per startup is worth $762,000. The global average is $4.1 billion of ecosystem value and $252,000 of early stage funding per startup (Startup Genome, 2017).
2. Questionnaire to the startup ecosystem
Since the goal was to collect standardized, comparable, and both quantitative and qualitative information from an initial large batch of startups, an online questionnaire was chosen as the first research method.
Given the importance within the ecosystem, the questionnaire was sent to all startups from Startup Lisboa, Beta-i, and Lispolis. It was also sent to a selection of some of the most successful startups based in Lisbon that already left the city’s incubators/accelerators.
To meet its goals, the questionnaire was designed according to the following:
a. Startup Overview – where this research tries to draw the profile of each startup b. Business Intelligence Overview – where this research understands if the startup
uses, or not, BI&A tools i. If yes:
14 2. BI&A maturity level of the startup
3. Case Studies selection
With an overview of the city’s ecosystem, the next step is to choose which organisations will feature as case study. Staff of each chosen startup will be asked to answer a questionnaire that intends to clarify internal factors, this way understanding not only the startup development stage but also its BI&A maturity level.
In order to represent different business stages, three companies were chosen to be featured as case studies: Aptoide, Misk, and Tiger Time.
According to CrunchBase companies’ database, Aptoide is the highest ranked company with headquarter listed in Lisbon. It was chosen to show how industry leading startups are using and benefiting from BI&A tools.
Misk was founded in 2016, it’s incubated in Startup Lisboa and online on the App Store. It was chosen to illustrate how an early stage startup can work with BI&A tools and what are its difficulties.
Tiger Time was founded in 2017, it was elected one of the Top 10 startups at the European Innovation Academy and selected to integrate the first batch of Beta-i’s Lisbon Challenge. At the time of this research, it is still not online and therefore it’s an indicator of how an infant project can use these tools to grow and design its strategy.
Results and discussion
15 Founded in 2011 by Alvaro Pinto (law), Inês Rola (Psychology) and Paulo Trezentos (Computer Science)38, Aptoide gives developers, OEMs, and telecommunication companies access to a fully
customizable app store and a worldwide competitive revenue share model.39 It’s now one of the main alternatives to Google’s Play Store with over 200 million users, 4 Billion downloads and 1 Million Apps.40
After a $1 million seed round in 2013, Aptoide was awarded the Tech Startup of the Year 2015 award by Portugal Ventures and on January 2016, it closed a series-A funding round of $4 million led by e.ventures, with additional participation from China’s Gobi Ventures, Southeast Asia-based Golden Gate Ventures, and Portugal Ventures.41
Clearly, the largest and, so far, most successful organisation studied in this research, Aptoide has now a team that includes between 50 and 100 people and generates more than 1 million euros of annual revenue.
Despite that, and the fact that the organisation considers itself, and the ecosystem, to be data-driven, the company only started using BI&A tools since 2016 (five years after foundation) and less than 10% of the annual budget goes into that department that directly employees less than five people. Aptoide is currently using Qlik software, for both business intelligence and product technical decisions.
For Aptoide, their BI&A tools and processes are agile within the organisation, however, it seems contradictory that, according to their answers, it’s not fulfilling a real-time analysis but, on the opposite, it’s only answering the question of What happened? in order for them to predict What
can we [Aptoide] offer? their customers. Apparently, crucial business questions such as What should happen?, Why did it happen?, and What is happening? are not being answered by their
16 current tools and it may be the reason why, on a scale from 1 to 5, BI&A is perceived as a 4, value wise. This means that being an important decision tool, BI&A is not completely strategic for Aptoide.
Eventually, this perception is biased on the fact that, investment wise, it’s still not possible for the organisation to compute return on investment of these tools: as the ROI becomes clearer, value perception will probably become more extreme – positive returns should bias value perception of BI&A tools towards level 5, while negative or unclear short-term returns may decrease the perception of value of the implemented tools and, ultimately, lead to a decrease on investment. As we’ll later see when we study Misk, the perception of the value of BI&A tools for the company is directly correlated with the degree of agreement that these tools can improve the
decision-making processes at all levels of management and improve tactical and strategic management processes.
One plausible explanation for the not complete agreement with this is that last year’s implementation of BI&A was not fully successful and, as a result, tools are not optimised. However, Aptoide’s BI processes are aligned with other internal methodologies, around a
data-warehouse & master data management system architecture, standardised on the entire organisation
to create dashboards and an efficient performance management. All these answers reject that hypothetical explanation and, combined with the fact that the company is planning to further invest during 2018-2020, make us wonder if the return on previous investments is, indeed, unclear.
When asked what is the main BI challenge that Lisbon tech startups face, Aptoide’s answer reveals the organisation higher degree of maturity on this matter: “One of the main challenges is the
17
this is a problem on BI. Different sources, different formats, different dimensions, different measures, etc.”
Misk
Founded in 2016 by Madalena Rugeroni (Communication), Sofia Pitta (Management) and Daniel Rosa (Computer Engineering), Misk is “a community for restaurant lovers that will let you decide where to grab a bite or have a drink based on your friends’ recommendations”.42 The three have
experience in the tech industry having worked at Google, Bloomberg, SAP, and Intel.43
At the moment of the writing of this thesis, Misk is only available for Apple’s App Store and, for a company that launched its product just over a year from now, all customer feedback is crucial for development and continuous improvement.
Despite only spending between 10 and 25% of its annual budget on BI&A tools dedicated to product management, the main challenge that Misk founders point is that these tools are still too expensive. This idea is shared with other companies with a similar profile who were contacted for the purpose of this research, however, most are considering or will indeed further invest in these tools until 2020, including Misk. An interesting conclusion, since most of them considered their own organisation as data driven but answered that they don’t know or don’t agree that Lisbon’s tech startups are data driven.
Misk is using a combination of Google Analytics (marketing analytics), Mixpanel (product analytics for mobile and web) and Appsee (App’s user experience analytics). Again, none of the companies who answered our questions with similar level of maturity uses only one BI&A software.
18 According to our analysis, at Misk there’s a strong sense of how BI&A can be important for the organisation. When analysing the strategic component, we understand that they’re using BI&A to answer to questions such as what happened, what should happen, why did it happen, and what is
happening, therefore the only dimension that is still not being covered by these tools is the
predictive one: What can we offer? Nevertheless, Misk founders attributed to BI&A the highest level of importance from the perspective of strategic value. Consequently, despite the fact that it’s still impossible for them to compare the return to the cost of these tools, they’re planning to further invest in it and it’s clear to them of its importance as they strongly agree that “BI&A can improve the decision-making processes at all level of management and improve your tactical and strategic management processes.”
On a team of three people and where only one is directly involved with BI&A, the practical aspects of the maturity level, those that regard implementation and not strategy, are, obviously, showing the low level of maturity of these tools. A methodology is not yet fully tested and implemented, the system architecture consists of spreadmarts and manual integration and its implementation consists of spreadsheets and the manipulation of basic data.
The path, for Misk in what concerns BI&A, must necessarily be the integration of product management tools with financial, sales and CRM. After validating the market need, not running out of cash should be any startup number one priority and, without proper financial analysis, it is considerably more difficult. Also, sales and customer oriented BI&A tools can further help Misk to avoid, for instance, being outcompeted, pricing issues, poor product and ignoring their customers.
19 “Tiger Time is an app that blocks distractions and gamifies concentration”44, or in other words, “a
simple, yet powerful time management app that uses the leading productivity systems to help busy people study better and work harder”45
Founded in 2017 by João Cartucho (Electrical Engineering) and Adam O’Neill (Business Computing), the team originally met and started working on the idea during the European Innovation Academy - Portugal 2017. There, the “world’s largest extreme entrepreneurship program”, teams compete to take a project from idea to a tech startup in 15 days.46
Tiger Time was voted as one of the 10 best startups in the competition and was later one of the 9 chosen startups to include the first batch of Beta-i’s Lisbon Challenge, which earned them ten thousand euros.
During both mentioned programs, Tiger Time worked with the business model canvas, financial analysis, and pitched their idea. The goal was always to validate their business, develop and launch the product. At this moment, we cannot know if Tiger Time will be chosen as one of the four startups that will receive an additional 50 thousand euros funding and office space at Beta-i. Because it’s not yet online, Tiger Time has a completely different profile from the rest of this research case studies. Its founders were one of the few to admit that they weren’t sure about the concept of Business Intelligence, they’re still the only two people working for the project and the tool they actually use is only targeting their landing page. In it, they ask their visitors to answer to a brief survey. However, it only tries to better know who their early adopters are, and it seems to be much more a tool to validate their business idea than their product or how they’re developing it.
20 Going back to CB Insights’ report on why startups fail, it seems that the team behind Tiger Time is only using BI&A in what concerns the number 1 reason: No market need. Shouldn’t a company, that is currently working to launch its product, also be concerned with, for instance, pricing issues or not having a poor product that doesn’t ignore customers?
Such a small organisation should, in theory, be agile enough to integrate any tool or process in the culture of the team. The BI experience could easily be implemented as a holistic approach to all the work being developed. However, it’s perceived by Tiger Time’s founders as merely basic and not predicative: they’re not trying to answer the question What can we offer? and it’s, indeed, perceived as something irrelevant for the team.
Despite that, they are planning to invest in BI&A tools until 2020, and consider themselves a data driven organisation. For the purpose of this study, it seems that Tiger Time’s team is not taking advantage of all available, and many times free, solutions that are able to help them perform better. According to its founders, one of the main challenges with BI&A tools is the infancy of the ecosystem, but being accelerated at, probably, the main hub in the country, it seems that that reason may not apply directly to Tiger Time.
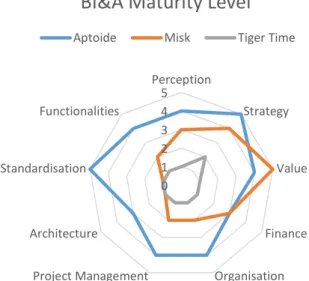
0 1 2 3 4 5 Perception Strategy Value Finance Organisation Project Management Architecture Standardisation Functionalities
BI&A Maturity Level
Aptoide Misk Tiger Time
21 Conclusion
It was a goal of this study to illustrate the growing importance of data for the success of enterprises. As Warren Shaeffer (co-founder of Vidme, a video platform that reached over 200 million people annually and that shut down recently) put it, “advertisers want to target specific audiences, which means a new platform that doesn’t store troves of personal user data is at a severe disadvantage relative to Facebook and Google, which combined control 60% of online ad spending in the US”.47
And as already showed, BI&A can contribute to better decisions in so many aspects of the business that it doesn’t make sense not to use today tools, some of them even free.
We’ve seen that there may exist, indeed, a correlation between the maturity level of the startup, and its success, with the maturity level of its BI&A tools and processes. As the graphic output shows it, this study indicates that the three startups are biased towards a more strategic view of these tools as they understand its value but sometimes lack the execution. This is clearly shown by the difference between Aptoide and Misk in the technical variables of Côrte-Real model: while in business variables like Perception, Strategy, and Finance the score difference between the two organisations is only 1, and in Value Misk even scores higher than Aptoide, when we study technology specific variables such as Project Management, Architecture, and Functionalities that score difference doubles to 2. In fact, in a crucial variable like Standardisation, Misk scores as low as Tiger Time (Score 1) and Aptoide achieves the highest level (Score 5), showing us the depth of the differences between both organisations.
As it was expected, Tiger Time showed lower (or equal) levels of maturity in all model’s variables when compared with Misk and the same happened with Misk when compared with Aptoide (exception made to the Value dimension). This clearly shows the already mentioned apparent
22 correlation, that was only likely to confirm with a larger sample that made a statistical study possible.
It was, however, impossible to understand if this apparent correlation has a causational explanation due to two distinct reasons: first, although it was the main goal, it was not possible to do a valid statistical study. Despite the several contacts done with the City Council and the main startup incubators and accelerators, the questionnaire designed for this study faced a lot of friction from the startups. Although it was five minutes long, a lot of contacted teams answered that they are constantly approached by students to answer this kind of questionnaires and they don’t have time to answer to everything, nor is it a priority for them. Second, the chosen model of maturity evaluation is only a representation of the organization at the time of the questionnaire. As it was outside its scope, it didn’t contemplate time as a variable of study. However, for the matter of this study, given the distinct stages of maturity of among the three case studies, the evolution each BI&A tools and processes suffered in each organization would probably be an even more essential element to analyse.
There are other factors that limit the results of this study: difficulty to track and lack of availability from founders of startups that failed to answer to our questionnaire. This would allow us to compare those results with currently operating organisations and understand what are the best practices, and mistakes to avoid. Also, technological startups are only a fraction of the micro and SMBs that form the Portuguese economy. More than that, choosing three case studies from a sample of startups already incubated in main entities such as Beta-i or Startup Lisboa may lead to an obvious bias as the criteria for selection of these startups was already more demanding than what many other startups face and, the community there is probably much more aware of such issues as the importance of data and its influence on making good business decisions. As
23 previously stated, this research may not be possible to extrapolate to non-tech startups and therefore, much of the meaning of this study is lost. However, as technology assumes a key role in our lives, new startups may use these case studies to build their BI&A processes and follow good examples.
Future work projects should pay particular attention to the difficulties associated with collecting primary data by making questionnaires. Instead of the analyses of specific case studies, the statistic study of a valid sample of the community would be of greater interest, not only academically, but also for the industry and for the ecosystem authorities, such the City Council or even the incubators/accelerators themselves. An easy conclusion from this research is that these entities don’t have enough data and/or knowledge of the ecosystem itself to discuss the importance of data for Lisbon startups and, a study like this would give them valuable information and insights that are currently not available. Also, the time concerned analyses of the evolution of these organisations, how they grew and what allowed them to succeed or not.
To conclude, one valuable initiative would be the creation of a Lisbon startup observatory to monitor the evolution of the city startup ecosystem over time in these and other relevant dimensions to support not only the monitorization of its performance but also to feed public policy makers and, this way, attract investment.
Reference List
1. Watson, Hugh J. 2009. Tutorial: Business Intelligence – Past, Present, and Future,"Communications of the Association for Information Systems: Vol. 25, Article 39. 2. McKinsey&Company. 2016. “The need to lead in data and analytics”. Accessed
December 28. https://www.mckinsey.com/business-functions/digital-mckinsey/our-insights/the-need-to-lead-in-data-and-analytics
3. Harvard Business Review. 2016. “The Rise of Data-Driven Decision Making Is Real but Uneven”. Accessed December 28. https://hbr.org/2016/02/the-rise-of-data-driven-decision-making-is-real-but-uneven
24 4. The Economist. 2017. “The world’s most valuable resource is no longer oil, but data”. Accessed December 20. https://www.economist.com/news/leaders/21721656-data-economy-demands-new-approach-antitrust-rules-worlds-most-valuable-resource
5. Fortune. 2017. “Conventional Wisdom Says 90% of Startups Fail. Data Says Otherwise”. Accessed December 20. http://fortune.com/2017/06/27/startup-advice-data-failure/ 6. The Guardian. 2016. “Sun, surf and low rents: why Lisbon could be the next tech capital”.
Accessed December 20. https://www.theguardian.com/world/2016/oct/29/lisbon-web-summit-sun-surf-cheap-rents-tech-capital
7. Tech Crunch. 2017. “Startup hub builder Factory plans gargantuan new campus in Lisbon”. Accessed December 20. https://techcrunch.com/2017/07/25/startup-hub-builder-factory-plans-gargantuan-new-campus-in-lisbon/
8. Google Trends
9. Tech Crunch. 2017. “In 2016 Lisbon fired-up its startup engines — 2017 will hear them roar.” Accessed December 20. https://techcrunch.com/2017/02/14/in-2016-lisbon-fired-up-its-startup-engines-2017-will-hear-them-roar/
10. Observador. 2017. “Startups. Ecossistema português cresceu o dobro da média europeia”. Accessed December 20. http://observador.pt/2017/06/07/startups-ecossistema-portugues-cresceu-o-dobro-da-media-europeia/
11. Jornal de Negócios. 2012. “INE: PME representavam 99,9% do tecido empresarial
português em 2010”. Accessed December 20.
http://www.jornaldenegocios.pt/economia/detalhe/ine_pme_representavam_999_do_tecid o_empresarial_portuguecircs_em_2010
12. Entrepreneur. 2017. “Why Some Startups Succeed (and Why Most Fail)”. Accessed December 20. https://www.entrepreneur.com/article/288769
13. Devens, Richard Miller. 1865. Cyclopædia of commercial and business anecdotes. New York: D. Appleton and company
14. Luhn, H. 1958. A Business Intelligence System. IBM Journal of Research and Development
15. Gartner Group report, 1996
16. Chau, M., & Xu, J. 2012. Business intelligence in blogs: Understanding consumer
interactions and communities. MIS quarterly, 36(4).
17. Park, S. H., Huh, S. Y., Oh, W., & Han, S. P. 2012. A social network-based inference
model for validating customer profile data. MIS Quarterly, 36(4).
18. Sahoo, N., Singh, P. V., & Mukhopadhyay, T. 2010. A hidden Markov model for
collaborative filtering.
19. Lau, R. Y., Liao, S. S., Wong, K. F., & Chiu, D. K. 2012. Web 2.0 Environmental
Scanning and Adaptive Decision Support for Business Mergers and Acquisitions. MIS
Quarterly, 36(4).
20. Hu, D., Zhao, J. L., Hua, Z., & Wong, M. 2012. Network-Based Modeling and Analysis
of Systemic Risk in Banking Systems. MIS Quarterly, 36(4).
21. Abbasi, A., Albrecht, C., Vance, A., & Hansen, J. 2012. Metafraud: a meta-learning
framework for detecting financial fraud. Mis Quarterly, 36(4).
22. Business Intelligence. 2015. “How Patient Data Helps Hospitals”. Accessed December 20. https://businessintelligence.com/big-data-case-studies/patient-data-helps-hospitals/
25 23. Business Intelligence. 2015. “Tesco’s Legendary Big Data Benefits”. Accessed December 20. https://businessintelligence.com/big-data-case-studies/tescos-legendary-big-data-benefits/
24. Business Intelligence. 2015. “How UPS Uses Big Data With Every Delivery”. Accessed December 20. https://businessintelligence.com/big-data-case-studies/ups-uses-big-data-every-delivery/
25. Bruin, T. D., & Rosemann, M. 2005. Towards a business process management maturity
model. In Proc. 13th European Conference on Information Systems (ECIS).
26. SAS. 2007. Business intelligence maturity and the quest for better performance. pp. 6-12 27. Williams, S., & Williams, N. 2010. The profit impact of business intelligence. Morgan
Kaufmann.
28. Eckerson, W. W. 2009. TDWI's Business Intelligence Maturity Model. Chatsworth: The Data Warehousing Institute.
29. The Business Intelligence Blog. 2012. “BI maturity models”. Accessed December 20. https://biguru.wordpress.com/2012/01/08/bi-maturity-models/
30. Chuah, M. H., & Wong, K. L. 2011. A review of business intelligence and its maturity
models. African journal of business management, 5(9), 3424-3428.
31. TDWI. “How mature is your analytics program?”. Accessed December 20. https://tdwi.org/pages/research/maturity-models-and-assessments.aspx
32. Shaaban, E., Helmy, Y., Khedr, A., & Nasr, M. 2011. Business Intelligence Maturity
Models Toward New Integrated Model.
33. Hewlett, P. 2009. The HP Business Intelligence Maturity Model: Describing the BI
journey. Hewlett-Packard Development Company LP.
34. N. Côrte-Real, M. Neto and F. Neves. 2012. Business intelligence maturity assessment
model for organizations. 7th Iberian Conference on Information Systems and Technologies
(CISTI 2012). Madrid , pp. 1-7.
35. Genome, Startup. 2017. Global Startup Ecosystem: report 2017.
36. Amazon. Accessed December 28. https://www.amazon.com/Startup-Step-Step-Building-Company/dp/0984999302
37. Blank, Steve. 2012. The startup owner's manual: The step-by-step guide for building a
great company. BookBaby.
38. CrunchBase. Accessed December 20. https://www.crunchbase.com/organization/aptoide 39. Aptoide. Accessed December 20. https://www.aptoide.com/page/about
40. Aptoide. Accessed December 20. https://www.aptoide.com/page/presskit 41. Tech Crunch. 2016. https://techcrunch.com/2016/01/05/aptoide-series-a/
42. Startup Lisboa. Accessed December 20. http://www.startuplisboa.com/portfolio-startups/misk
43. Made Of Lisboa. Accessed December 20. https://madeoflisboa.com/p/company/misk 44. Tiger Time. Accessed December 20. https://www.tigertime.io/
45. Lisbon Challenge. Accessed December 20. http://www.lisbon-challenge.com/lisbon-challenge-2017-meet-promising-startups-will-join-acceleration-stage/
46. EIA. Accessed December 20. http://inacademy.eu/about-eia/