UNIVERSIDADE DA BEIRA INTERIOR
Ciências
Development and optimization
of a microRNA purification technology by affinity
chromatography, using the concept of QbD
Adriana Alexandra Fernandes Afonso
Dissertação para obtenção do Grau de Mestre em
Biotecnologia
(2º ciclo de estudos)
Orientadora: Prof
a. Doutora Fani Sousa
Coorientadora: Prof
a. Doutora Ângela Sousa
iii
“All our science, measured against reality, is primitive and
childlike - and yet it is the most precious thing we have.”
Albert Einstein
v
To my parents…
For all their love, support and encouragement.
I love you both.
vii
Acknowledgments
First of all, I would like to express my sincere gratitude to my major supervisor Professor Doctor Fani Sousa and co-major supervisor Professor Doctor Ângela Sousa, for all the guidance, valuable advice and trust. I really appreciate all the dedication, the vast knowledge and scientific expertise, as well as all the criticisms and suggestions made during the development of this work.
I would like to express my sincere gratitude to Professor Doctor João Queiroz and to University of Beira Interior for the availability and provision of the necessary resources essential to the development of this research project.
I am extremely thankful to Patrícia Pereira, who with her special expertise provided me with invaluable advice, encouragement, and careful guidance. Your patience, support and friendship were crucial for the success of this work, I sincerely thank you.
I would also like to express a special thanks to Susana Ferreira who generously helped me on the analysis of my experimental design model. It was essential to rightly explore this field and to draw the right conclusions. I really appreciate her availability and sympathy whenever I contacted her.
Moreover, I also thank to all the people involved in Health Sciences Research Centre of the University of Beira Interior, especially to the Biotechnology and Biomolecular Sciences group for providing invaluable technical and administrative help, advice, support and feedback, particularly to Rita Martins and Marta Silva. Thanks for all the great moments, friendliness and support on the not so good times.
My heartfelt thanks to my friends, I appreciate your encouragement, support, and assistance. I will never forget those hours when we talked about our difficulties, and despite that we laugh about it. Your companionship made difficult times enjoyable.
To all my family, thanks for never give up on believing me, for understand my absence and for all of your kindness even when you can’t understand what I am doing so many hours closed in the lab. For you acceptance I thank you.
For their endless encouragement, patience, support, love and because they are who made all of this achievable, to my parents, Mário e Zita Afonso, I am eternally thankful to you both. To my brother, because I could not be around when you need me the most, thanks for understand. I love you.
Finally, I want to thank to Tiago, for all his support and availability whenever I needed. You kept me on the surface on the difficult times and you have shown me that when I want it enough, strength will come with the will. Thank you my love.
viii
ix
Resumo
Atualmente, mais de 30 milhões de pessoas sofrem de demência em todo o mundo e, sem tratamento visível num futuro próximo, os números tendem a aumentar rapidamente. De todas as doenças neurodegenerativas, a doença de Alzheimer (DA) é a mais predominante. Na Doença de Alzheimer há uma perda neuronal e sináptica generalizada que causa um declínio progressivo na memória e em outras funções cognitivas, conduzindo finalmente à demência. Esta doença neurodegenerativa está associada a dois tipos de depósitos proteicos, placas extracelulares β-amilóides (Aβ) e complexos neurofibrilares intraneuronais. Estudos recentes demonstraram que o cluster miR-29 pode diminuir a deposição das placas de Aβ atuando diretamente sobre a enzima que cliva os péptidos β-amilóides (BACE-1), a qual é responsável pela clivagem da proteína precursora e, consequentemente geração de espécies Aβ tóxicas. Estes estudos apresentam a possibilidade da utilização do pré-miR-29 como um novo alvo terapêutico no tratamento da DA, para qual é necessário garantir um elevado grau de pureza, estabilidade e integridade do miRNA. Assim, o principal objetivo deste estudo é o desenvolvimento de uma nova estratégia de cromatografia de afinidade com uma matriz O-fosfo-L-tirosina comparando duas metodologias diferentes – o desenho experimental e o método “tentativa/erro” - para obter o pré-miR29 com elevado grau de pureza e rendimento, visando a sua aplicação em terapia génica.
Palavras-chave
Cromatografia de afinidade, desenho experimental, método “tentativa/erro”, pre-miRNA29b-1, purificação.
xi
Resumo Alargado
Desde a descoberta de RNAs com actividade catalítica no início de 1980 até á investigação de pequenos RNAs de interferência, a compreensão biológica do RNA evoluiu de um simples intermediário entre o DNA e uma proteína, para uma molécula dinâmica e versátil que regula as funções dos genes e das células em todos os organismos.
Os pequenos RNAs não-codificantes representam um grande grupo de diferentes RNAs, que foram identificados em plantas e animais. Inicialmente, foram descobertos em
Caenorhabditis elegans, onde silenciavam genes específicos, mas atualmente sabe-se que eles
atuam no silenciamento de outros RNAs, reorganizam o DNA e atuam na regulação pós-transcricional do RNA mensageiro através de microRNAs endógenos. Particularmente, as moléculas de microRNA (miRNAs) são constituídas por duplas cadeias, cada uma com 15 a 21 nucleótidos que, ao se ligarem ao RNA mensageiro alvo, silenciam a tradução ou induzem a sua degradação. Devido às suas funções e ao facto de a sua expressão aparecer desregulada em várias doenças, os miRNAs representam um importante alvo terapêutico.
Atualmente, mais de 30 milhões de pessoas sofrem de demência em todo o mundo e, sem tratamento visível num futuro próximo, os números tendem a aumentar rapidamente. Está previsto que em 2030 o número de pessoas afetadas suba para 66 milhões e que em 2050 este ronde já os 115 milhões de pessoas. De todas as doenças neurodegenerativas, a doença de Alzheimer (DA) é a mais predominante sendo a principal causa de demência em pessoas idosas. O aparecimento exponencial destas doenças deve-se principalmente ao envelhecimento da população, à falta de progresso na correta identificação da doença e à falta de técnicas preditivas de diagnóstico. Este tipo de doenças representa um grande encargo para a sociedade, quer a nível económico como social, tornando-se urgente encontrar uma solução para este problema.
O desenvolvimento de estratégias terapêuticas para a DA requerem o conhecimento das principais causas e efeitos desta doença. Os pacientes apresentam uma perda neuronal e sináptica generalizada que causa um declínio progressivo na memória e em outras funções cognitivas, conduzindo finalmente à demência. Os sintomas acima referidos são maioritariamente provocados pela toxicidade de dois tipos de depósitos proteicos, placas extracelulares β-amiloides (Aβ) e complexos neurofibrilares intraneuronais. Estes últimos resultam de uma forma fosforilada da proteína tau, enquanto que as placas β-amiloides resultam da clivagem da proteína precursora amiloide (APP) que origina os pépidos-Aβ que podem agregar.
Recentemente, estas características patológicas foram reconhecidas como estando ligadas direta ou indiretamente à regulação da APP, da enzima que cliva os péptidos β-amiloides
xii
(BACE-1) e de genes fundamentais na evolução da doença de Alzheimer. Particularmente, estes avanços indicaram que em pacientes da DA a expressão da família mir-29 (miR29a, miR29b, miR29b e miR29c) está diminuída e que os níveis de BACE1 estão aumentados. Hebbert e a sua equipa de investigadores (2008) demonstraram que o cluster miR29a/b-1 assume um papel importante na evolução da doença, dado que baixos níveis do cluster miR29a/b-1 implicavam altos níveis da proteína BACE1. Estes estudos apresentaram a possibilidade da utilização do pré-miR-29 como um novo alvo terapêutico no tratamento da DA, sendo necessário garantir um elevado grau de pureza, estabilidade e integridade do miRNA. Assim, torna-se indispensável desenvolver um método de purificação fiável, específico e reprodutível, para simplificar o processo utilizado e aumentar a eficiência na obtenção de um miRNA específico.
Recentemente, a cromatografia de afinidade com aminoácidos tem sido estudada como uma alternativa aos métodos clássicos (métodos baseados no uso de fenol e/ou matrizes de sílica) para isolar o RNA, uma vez que permitem interações específicas com este ácido nucleico. Esta técnica de afinidade baseia-se na multiplicidade de interações naturais que ocorrem entre os aminoácidos e os ácidos nucleicos no ambiente celular. A seletividade deste método pode ser explicada pelo reconhecimento da estrutura individual envolvida na interação específica aminoácido/ácido nucleico.
Como está descrito na literatura, o reconhecimento da molécula de miRNA é feito por um complexo enzimático envolvido no processo de silenciamento – complexo RISC. Este apresenta uma cavidade aminoacídica conservada que possui no seu interior uma tirosina, crucial para que o reconhecimento e a ligação entre o miRNA e o complexo RISC ocorra. Assim, o objetivo deste estudo passa por explorar esta interação natural, utilizando uma matriz de agarose O-fosfo-L-tirosina para purificar a molécula de pré-miRNA29b-1 tendo em conta todo o seu potencial uso na terapêutica da doença de Alzheimer.
O desenvolvimento de métodos cromatográficos para a purificação de ácidos nucleicos é muitas vezes complexo e demorado. Geralmente, a otimização de um método é feita de acordo com as informações recolhidas após cada experiência realizada, baseando-se nos erros ou sucessos (método “tentativa/erro”) de cada ensaio. No entanto, o desenvolvimento de um processo cromatográfico não é apenas caracterizado pelos rendimentos e pela pureza obtidos, mas também tem que ter em conta a robustez do método e todos os constrangimentos económicos e ecológicos envolvidos. É necessário maximizar a eficiência dos ensaios realizados, para diminuir o desperdício e o custo. Os investigadores procuram realizar experiências que proporcionem a maior quantidade e pureza possível da molécula alvo com o menor número de ensaios realizados. Para tal, a utilização do desenho experimental em ambiente laboratorial surge como uma ferramenta importante para encontrar o melhor método de purificação.
xiii
Neste trabalho é então proposta a utilização do desenho experimental, seguindo o desenho Box-Behnken, no desenvolvimento de um método cromatográfico para purificar o pre-miR29b-1, utilizando a matriz O-phospho-L-tyrosine – explorando as interações naturais que ocorrem num ambiente celular. Por outro lado, também são discutidos os benefícios desta abordagem em comparação com a metodologia “tentativa/erro”.
xv
Abstract
Nowadays, over 30 million people suffer from dementia worldwide and, with no cure in sight, these numbers tend to increase very fast. Of all dementing disorders, Alzheimer's disease (AD) is the most predominant. In AD there is a widespread synaptic and neuronal loss that causes a progressive decline in memory and other cognitive functions ultimately leading to dementia. This neurodegenerative disease is associated with two types of protein deposits, extracellular amyloid-β (Aβ) plaques and intraneuronal neurofibrillary tangles (NFTs). Recent studies demonstrated that the miR-29 cluster can decrease the production of the Aβ plaques by acting directly on the β-amyloid cleavage enzyme (BACE-1), which is critical for the cleavage of amyloid precursor protein and the generation of toxic Aβ species. These studies raised the possibility of using pre-miR-29 as a novel target for therapeutic intervention on AD, being essential to guarantee the purity, stability and integrity of the miRNA. Hence, the main goal of this study is the development of a new affinity chromatographic strategy with an O-phospho-L-tyrosine matrix, comparing two different methodologies – experimental design versus “one at a time” method - to obtain the pre-miR29 with high purity degree and yield, envisioning their application in gene therapy.
Keywords
Affinity chromatography, experimental design, “one at a time” method, pre-miRNA29b-1, purification.
xvii
Table of Contents
CHAPTER 1 - INTRODUCTION ... 1
SECTION 1.1-INTERFERENCE RNA/ SMALL RNA ... 3
Subsection 1.1.1 - MicroRNAs ... 4
Subsection 1.1.2 - MicroRNAs and their potential as therapeutic product ... 6
SECTION 2–ALZHEIMER’S DISEASE ... 8
Subsection 2.1 – Alzheimer’s disease and miR-29 ... 11
SECTION 3-PURIFICATION OF PRE-MIR29 ... 12
Subsection 3.1 - One at a time method and Design of experiments ... 16
CHAPTER 2 -MATERIALS AND METHODS ... 19
SECTION 2.1-MATERIALS ... 19
SECTION 2.2–METHODS ... 20
Subsection 2.2.1 - Bacterial R. sulfidophilum DSM 1374 growth conditions ... 20
Subsection 2.2.2 - Lysis and small RNA isolation ... 20
Subsection 2.2.3 - Affinity chromatography ... 21
Subsection 2.2.4 - Agarose gel electrophoresis ... 22
Subsection 2.2.5 - RNA precipitation ... 22
Subsection 2.2.6 - cDNA synthesis... 22
Subsection 2.2.7 - Polymerase chain reaction ... 23
Subsection 2.2.8 - Polyacrylamide electrophoresis ... 23
CHAPTER 3 - RESULTS AND DISCUSSION... 25
SECTION 3.1-BACTERIAL R. SULFIDOPHILUM DSM1374 LYSIS ... 26
SECTION 3.2–PRE-MIR29B-1 PURIFICATION ... 27
Subsection 3.2.1 - Main interactions occurring between RNA and O-phospho-L-tyrosine agarose matrix ... 27
Subsection 3.2.2 - O-phospho-l-tyrosine affinity chromatography for pre-miR29b-1 purification using “one at a time” approach. ... 31
Subsection 3.2.3 - O-phospho-L-tyrosine affinity chromatography for pre-miR29b-1 purification using a design of experiments approach. ... 41
3.2.3.1 - Goodness of fit ... 44
3.2.3.2 - Residual plots ... 45
3.2.3.3 - Observed versus Predicted for each response ... 46
3.2.3.4 - Interaction plots ... 46
3.2.3.4 – Main effects ... 48
xviii
3.2.3.6 - ANOVA table ... 52
3.2.3.7 - Model validation ... 54
CHAPTER 4 - CONCLUSIONS ... 57
CHAPTER 5 - FUTURE TRENDS... 59
xix
List of Figures
Figure 1: Translation inhibition. ... 6
Figure 2: Therapeutic strategies to re-equilibrate miRNA levels. ... 7
Figure 3: Schematic representation of APP processing. ... 9
Figure 4: MiRNA network surrounding APP. ... 9
Figure 5: Summary of miR-29a/b-1 role on Alzheimer’s disease. ... 11
Figure 6: The Box-Behken design in three factors. ... 17
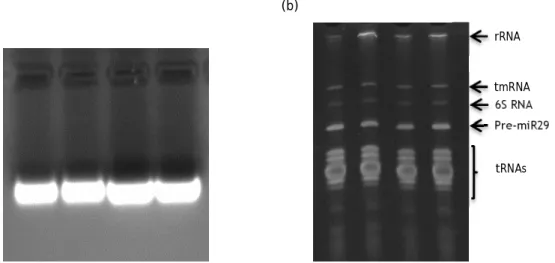
Figure 7: Agarose and polyacrylamide gel electrophoresis of four initial samples. ... 26
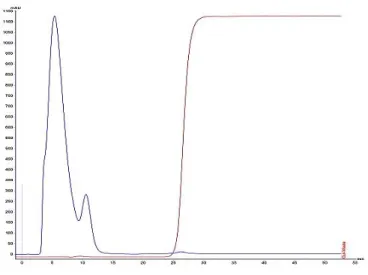
Figure 8: Chromatographic profile of RNAs elution. ... 27
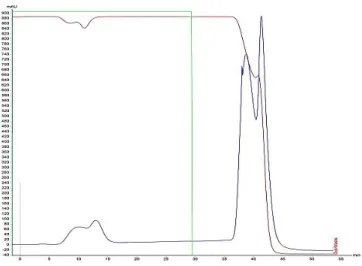
Figure 9: Chromatographic profile of RNAs elution. ... 28
Figure 10: P-Tyr ligand immobilized o and pre-miR29b-1. ... 29
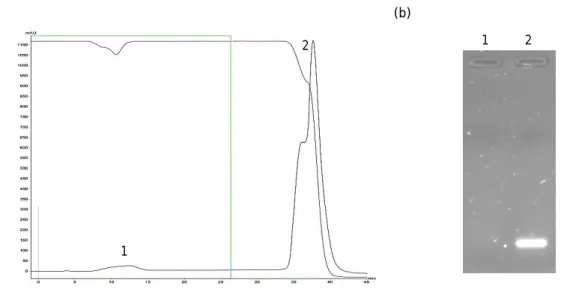
Figure 11: Chromatogram and agarose gel electrophoresis. ... 29
Figure 12: Chromatogram and agarose gel electrophoresis. ... 30
Figure 13: Chromatogram, agarose and polyacrylamide gel electrophoresis. ... 31
Figure 14: Chromatogram, agarose and polyacrylamide gel electrophoresis. . ... 32
Figure 15: Chromatogram and polyacrylamide gel electrophoresis (Run 1). ... 33
Figure 16: Chromatogram and polyacrylamide gel electrophoresis (Run 2). ... 34
Figure 17: Chromatogram and polyacrylamide gel electrophoresis (Run 3). ... 34
Figure 18: Chromatogram and polyacrylamide gel electrophoresis (Run 4). ... 36
Figure 19: Chromatogram and polyacrylamide gel electrophoresis (Run 5). ... 36
Figure 20: Chromatogram and polyacrylamide gel electrophoresis (Run 6). ... 37
Figure 21: Chromatogram and polyacrylamide gel electrophoresis (Run 7). ... 38
Figure 22: Chromatogram and polyacrylamide gel electrophoresis (Run 8). ... 38
Figure 23: Chromatogram and polyacrylamide gel electrophoresis (Run 9). ... 39
Figure 24: Chromatogram and polyacrylamide gel electrophoresis (Final Run). ... 40
Figure 25: Chromatogram and polyacrylamide gel electrophoresis (Central point). ... 43
Figure 26: Graphical representation of statistical coefficients. ... 44
xx
Figure 28: Observed versus predicted values. ... 46
Figure 29: Interactions plots. ... 47
Figure 30: Three-dimensional response surface plot and contour plot (R1). ... 50
Figure 31: Three-dimensional response surface plot and contour plot (R2). ... 51
Figure 32: Contour plots for the predicted responses. ... 54
Figure 33: Chromatographic profiles (model validation). ... 55
xxi
List of Tables
Table 1: Classes of small RNAs. ... 4
Table 2: De-regulated miRNA related to Alzheimer’s disease. ... 10
Table 3: Characteristics of miR-29 family members. ... 12
Table 4: Examples of commercially available kits to isolate microRNA. ... 13
Table 5: Affinity chromatographic methods to achieve RNA purification. ... 14
Table 6: Comparison of efficiency of BBD,CCD and DM. ... 17
Table 7: Box-Behnken design applied to chromatographic studies. ... 18
Table 8: Factors and levels introduced on BBD design. ... 41
Tables 9 and 10: Box-Behken design for three factors. ... 42
Table 11: Responses obtained for each run defined by BBD design. ... 43
Table 12: Statistical coefficients of the model. ... 44
Table 13: Interaction between factors relative to both responses. ... 48
Table 14: Summary of the main effects. ... 49
Table 15: ANOVA table for the % relative Recovery response. . ... 52
Table 16: ANOVA table for the % of relative Purity response. ... 53
Table 17: Optimum conditions settled by DoE for pre-miR purification. ... 54
Table 18: Responses obtained from the. ... 55
xxiii
List of Acronyms
AD Alzheimer’s Disease
Aß ß-amyloid peptides
ADDLs Amyloid β-Derived Diffusible Ligands
AGO Argonaute
APP Amyloid precursor protein
BACE1 ß-site APP-cleaving enzyme 1 or ß-secretase
BBD Box-Behnken design
bp Base pair
casiRNA(s) Cis-acting siRNA(s)
CCD Central composite design
C. elegans Caenorhabditis elegans
CI Confidence interval
cm Centimeter
DEPC Diethyl pyrocarbonate
DM Doehlert design
DNA Deoxyribonucleic acid
DoE Design of experiments
dsRNA Double-stranded RNA
EDTA Ethylenediaminetetraacetic acid
g Gram
G Gravitational constant
GC Gas chromatography
GC-FID Gas chromatography with flame ionization detector
GS-MS Gas chromatography–mass spectrometry
h Hour
HPLC High-pressure liquid chromatography
kb Kilobase
LC-MS Liquid chromatography – mass spectometry
Lin-4 Lineage-4 Lin-14 Lineage-14 M Molar mA Miliamper min Minute miR-29 MicroRNA29
xxiv
miRNA(s) MicroRNA(s)
mL Milliliter
mM Milimolar
mRNA Messenger RNA
MWCO Molecular Weight Cut Off or MWCO
natsiRNA(s) Natural antisense transcript derived siRNA(s)
NFTs Neurofibrillary tangles ng Nanogram nm Nanometer nt Nucleotides OD600 Optical density at 600 nm OVAT One-variable-at-a-time PC Paper Chromatography
PCR Polymerase chain reaction
pDNA Plasmid DNA
piRNA(s) Piwi-interacting RNA(s)
P-Tyr O-Phospho-L-Tyrosine
rasiRNA(s) Repeat-associated siRNA(s)
RISC RNA-induced silencing complex
RNA Ribonucleic acid
RNAi RNA interference
RNase(s) Ribonuclease(s)
rRNA(s) Ribosomal RNA(s)
rpm Revolutions per minute
R. sulfidophilum Rhodovulum sulfidophilum
s Second
sc pDNA Supercoiled pDNA isoform
scnRNA(s) Small-scan RNA(s)
shRNA Short hairpin RNAs
siRNA(s) Small interfering RNA(s)
sRNA(s) Small RNA(s)
SPE Solid-phase extraction
TAE Tris-acetate-EDTA
tasiRNA(s) Trans-acting siRNA(s)
TBE Tris-Borate-EDTA
tmRNA Transfer-messenger RNA
TRBP TAR RNA-binding protein 2, also known as TARBP2
Tris Tris(hydroximethyl)methylamine
xxv
Tyr Tyrosine
U Enzyme activity unit
UV Ultraviolet
µL Microlitre
µmol Micromol
1
Chapter 1
Introduction
Small non-coding RNAs represent a large group of different RNAs, that have been identified in plants and animals [1]. At first, Fire and co-workers (1998) found these molecules on
Caenorhabditis elegans where they silenced specific genes; but today it is known that they
act in order to silence RNA, silence interference RNA-mediated chromatin, rearrange DNA and act on post-transcriptional regulation of messenger RNA (mRNA) by endogenous microRNA (miRNA) [2, 3].
Particularly, miRNAs are 15-21 base duplexes that bind partially to the complementary sequences in target mRNA, silencing the translation or inducing its degradation [4]. Due to their functions, miRNAs represent a therapeutic target, reflected on the number of papers that discuss this theme.
Currently, it is known that over 30 million people suffer from dementia worldwide [5] and that by 2030, this number can reach 66 million people and increase to 115 million by 2050. Within these numbers, Alzheimer's disease (AD) is the most representative of dementia disorders, being the leading cause of dementia in the elderly people [6]. These numbers are mainly due to the aging of the population, the continuing lack of progress in identifying effective treatment modalities and the lack of predictive diagnostic techniques [7]. Actually, it was estimated that in 2010, the worldwide cost of dementia to society was US$604 billion/year, which clearly shows the enormous impact on socioeconomic conditions. Hence, it is of most importance to found a solution to this problem as soon as possible [7, 8].
In order to develop an AD treatment is essential to understand the principal features of this disease. Alzheimer’s patients demonstrate two main characteristic protein deposits: tau neurofibrillary tangles (NFTs) and β-amyloid plaques. While the NFTs are a hyper-phosphorylated form of tau, the β-amyloid plaques result from proteolytic cleavage of amyloid precursor protein (APP) that origin Aβ-peptides, which can aggregate [9]. Currently, these pathological features have been recognized as linked to deregulated microRNAs (present on AD brains) [10]. Most of these molecules are direct or indirectly implicated in the regulation of key genes involved in AD, including APP and as ß-site APP-cleaving enzyme 1 (BACE1) [9]. Several reports indicate that the expression of miR-29 family (miR-29a, miR-29b, and miR-29c) is altered in AD patients, being significantly decreased, and displaying abnormally high levels of BACE1 protein [9].
2
Particularly, the work of Hebert and co-workers (2008) showed that the decreased levels of the miR-29a/b-1 cluster implicated increased levels of BACE1 [11]. This finding raised the chance to use pre-miRNA29 as a therapeutic target. This way, it is essential to find an effective strategy to obtain pre-miRNA29 and to guarantee the purity, stability and integrity of the molecule.
The purification method has to be as reliable and specific as possible, in order to simplify the process used to obtain a specific miRNA. Recently, amino acid-based affinity chromatographic methods have been studied as an alternative to the classic methods (phenol and/or silica matrix based methods) to isolate RNA, as they allow specific nucleic acid purification [12-14]. This affinity technique is based on the exploitation of natural interactions that occur between amino acids and nucleic acids in the cellular environment. As it is described in the literature, miRNA recognition is made by an enzymatic RNA-induced silencing complex (RISC) that presents a conserved amino acidic pocket. In particular, it has been suggested that a conserved tyrosine of this pocket is crucial to induce the recognition and binding between RISC and miRNA. So, the aim of this study is to explore this natural interaction, using an O-phospho-L-tyrosine agarose matrix to purify pre-miRNA29b-1 regarding its potential use as Alzheimer’s therapeutics.
Taking into consideration the aforementioned, the present work can be divided into three main phases:
1. Extraction of small RNAs from Rhodovulum sulfidophilum DSM 1374; 2. Recovery of pre-miRNA29b-1 from the small RNAs samples;
3. Optimization of the purification step using different methods (one at a time and Box Behnken design).
3
Section 1.1 - Interference RNA / small RNA
Since the discovery of catalytic RNAs in the early 1980s and of RNA interference in the late 1990s, biological understanding of RNA has evolved from simply an intermediate between DNA and protein to a dynamic and versatile molecule that regulates the function of genes and cells in all living organisms [15].
Fire and co-workers (1998) have found that double strand RNA (dsRNA) introduced into
Caenorhabditis elegans (C. elegans) silenced the expression of a homologous target gene
more efficiently than the corresponding antisense RNA [3]. On another study performed by Zamore and co-workers (2000), they obtained the same interference response in vitro when long dsRNA was added to a Drosophila embryo extract, silencing the expression of a homologous gene by directing degradation of its mRNA [16, 17]. With the breakthrough discovery that genes could be silenced by interference RNA (RNAi), these small RNAs rapidly became the focus of studies on the mechanisms of their specific regulatory roles [1]. These shorter dsRNA found by Zamore and co-workers (2000) were named “small interference RNAs” (siRNAs). Similarly, they discovered small RNAs in vivo in Drosophila cells transfected with long dsRNA and in fly embryos and C. elegans injected with long dsRNA [16, 17].
With 19–31 nucleotides (nt) long, these non-coding RNAs behave as sequence-specific triggers for mRNA degradation, translation repression, heterochromatin formation and transposon control. They can be classified into different groups based on their origin or the components to which they are coupled: microRNAs (miRNAs), small-interfering RNAs (siRNAs), trans-acting siRNAs (tasiRNAs), small-scan RNAs (scnRNAs), cis-acting siRNAs (casiRNAs), natural antisense transcript derived siRNAs (natsiRNAs), repeat-associated siRNAs (rasiRNA) and Piwi-interacting RNAs (piRNAs) (Table 1) [1].
Briefly, miRNAs are 19 to 25 nt long and derived from hairpin-structured precursor, which facilitate translation repression in several organisms. SiRNAs are the products of long Dicer-processed dsRNAs that silence genes by cleaving their target mRNAs. They have been widely exploited as an exogenous tool to study gene function by acting over the mRNA in mammalian cells. They also mediate the innate immune response against RNA viral infection in different organisms [1]. Endo-siRNAs are composed by cis-acting siRNAs (casiRNAs), tasiRNas and natsiRNAs and induce post-transcriptional regulation of transcripts and transposons and transcriptional gene silencing [18]. TasiRNAs trigger mRNA degradation but function in trans, that is, their target transcripts are other than the original genes where tasiRNAs are derived [1, 18]. In response to stress (such high salt levels), plants and Arabidosis species produced natsiRNAs. On another hand the cis-acting siRNA comprise the bulk of endo-siRNAs, being 24 nt long that promote the heterochromatin formation by directing DNA methylation and histone modification at the loci from which they originate [18]. ScnRNAs were found in
4
genome rearrangement [1]. Longer than siRNAs, rasiRNAs are silence repetitive and mobile genetic elements in yeast, plants, and flies [18].
Table 1: Classes of small RNAs (adapted from [4])
Class Length (nt) Function
Small interfering RNA (siRNA) 19-21 Target mRNA cleavage.
MicroRNA (miRNA) 19-25 Regulation of mRNA stability, translational
repression.
Trans-acting siRNA (tasiRNA) 21-22 Post-transcriptional regulation, mRNA
cleavage. Natural antisense
transcript-derived siRNA (natsiRNA) 21-24 Regulation of stress-response genes.
Cis-acting siRNA (casiRNA) ~ 24 Chromatin modification.
Repeat-associated siRNA
(RasiRNA) 24-27
Transposon control transcriptional silencing.
Small-scan RNA (scnRNA) ~ 28 DNA elimination.
Piwi-interacting RNA (piRNA) 26-31 Transposon regulation.
The development of this field of investigation has raised different types of RNA-based therapeutics that extend the range of ‘‘drug-able’’ targets further than the existing pharmacological drugs [15].
Subsection 1.1.1 - MicroRNAs
MicroRNAs are the most studied small non-coding RNA molecules that are involved in post-transcriptional regulation of target genes [19].
Ambros and co-workers (1993) as well as Ruvkun and co-workers (1993) studies revealed that the Caenorhabditis elegans lineage-4 (lin-4) gene produces a 21-nucleotides RNA that recognizes complementary sites in lin-14 messenger [20-22]. Accordingly, RNA downregulates the translation of lin-14 during the transition from the first to the second larval stage of development [20-22]. Thus, Ambros and co-workers (1993) settled that larval development of the nematode C. elegans needs a small RNA to inhibit the expression of a protein-coding gene
5
[20]. Now, this little lin-4 RNA is known as the founding member of an abundant class of small regulatory RNAs called microRNAs or miRNAs [22].
MiRNA-directed gene regulation is becoming more important as more miRNAs and their regulatory targets and functions are discovered. There are several roles assigned to miRNA as the control of cell proliferation, cell death, fat metabolism in flies, the neuronal patterning in nematodes, the modulation of hematopoietic lineage differentiation in mammals and the control of leaf and flower development in plants [22].
With 19–25 nt long, mature miRNAs are single stranded RNA molecules derived from a 70–100 nt long hairpin-precursor named pre-miRNA. Usually, RNA polymerase II transcribe miRNAs from chromosomal DNA regions (intragenic or intergenic) into primary transcripts of various lengths (usually 1–3 kb) called pri-miRNAs ( Figure 1) [19]. The resulting pri-miRNA has his hairpin recognized by an RNase complex consisting in a RNase III-type enzyme Drosha and its cofactor DiGeorge syndrome critical region gene 8 (DGCR8) that cleaves each hairpin at ~11 nt from its base [19, 23]. This step releases an approximately 70 nt long stem-loop (hairpin structure) precursor of miRNA (pre-miRNA). The pre-miRNA is then transported from the nucleus to the cytoplasm [4, 19]. Once in the cytoplasm, the endoribonuclease protein Dicer – a different RNAse III enzyme – with its co-factors TRBP (TAR RNA-binding protein 2, also known as TARBP2) cleaves off the terminal loop, resulting in a mature double-stranded miRNA of variable length (~20–25 nt) [4, 19, 23].
After Dicer cleavage, the short RNA duplex is loaded into a multisubunit complex termed RISC (RNA-induced silencing complex) by an Argonaute (AGO) protein. There, one of the two strands is released and degraded – passenger strand (also referred to as miR*), whereas the other strand is incorporated into RISC - guide strand or miR [4]. This strand selection might be determined by the relative stability of the two ends of miRNA duplexes, thus, the strand less stable at the 5’ end is loaded into RISC. The miRNA strand is bound to a conserved basic pocket inside the complex RISC that, with four invariant amino-acid residues (Y529, K533, Q545 and K570), is positively charged [1]. After the selection of the guide strand, it targets RISC to mRNAs with partially complementary sequences and cleaves, degrades or suppresses translation of target mRNAs [4, 23]. These sequences are named of ‘seed’ region and are 2–8 nucleotides from the 5’-end of a miRNA. They are crucial for target recognition; hence, miRNAs that share the seed region but differ outside are frequently considered to form a ‘family’ of miRNAs with largely overlapping sets of targets [4].
6
Figure 1: Translation inhibition (adapted from [4]).
Subsection 1.1.2 - MicroRNAs and their potential as therapeutic product
The capacity to inhibit the expression of a specific mRNA is a great advantage that can be used as a therapeutic application to some diseases that have origin or are involved in deregulated levels of mRNA and miRNA or when the prevention of gene expression is required.
Several studies demonstrated that abnormal miRNA expression seems to characterize many diseases, thus, miRNA expression profiles are a potential application as diagnostic and prognostic tools or also therapeutic targets. Most of the existing methods for modulating the de-regulated levels of miRNAs are adapted from existing gene therapy and antisense technology [23].
Currently, there are two types of therapeutic strategies being explored in vivo: miRNA mimics and anti-miRNAs. The first strategy is used for miRNAs whose expression is reduced in the disease state, and the re-introduction of the mature miRNA into the proper tissue could provide a therapeutic benefit by restoring regulation of target gene(s). That is, they are used to down-regulate the expression of specific target proteins [19, 23]. So far, it is known that siRNAs resemble the mature miRNA duplex and are functionally interchangeable, relatively to RISC action against target mRNAs. Consequently, the introduction of miRNA-mimics molecules that mimic the Dicer-processed miRNA duplex is a potential method to increase a particular expression (Figure 2b) [23].
7
However, when the problem comes from the over-expression of a specific type of miRNA, a loss-of-function in miRNA should be created. Injecting a complementary RNA sequence that binds to a miRNA target will achieve its inactivation, blocking its activity. For that role, it was developed the “antagomirs”, which are RNA snippets with cholesterol molecules that facilitate the entrance of RNA into the cells (Figure 2a) [19].
Figure 2: Therapeutic strategies to re-equilibrate miRNA levels. (a) Therapeutic strategies to reduce the miRNA expression. 1) Inhibition of miRNA transcription by introducing siRNA directed against the genomic miRNA promoter which induces chromatin changes, such as histone acetylation (Ac). 2) Introduction of siRNA directed against the miRNA biogenesis components such as Drosha, reducing processed miRNA available for target gene silencing. 3) Antagomirs (modified antisense oligonucleotides), through complementary base pair interactions, can sequester and/or degrade the mature miRNA. They can also act against incoming viral miRNA. (b) Therapeutic strategies to increase miRNA expression. 4) The introduction of a synthetic miRNA mimic into the cytoplasm that can be processed and loaded into RISC by Dicer, can restore miRNA function. 5) RNA Pol II promoter can express an entire pri-miRNA, leaving open the possibility for tissue-specific or induced ectopic miRNA expression [23]. 1) 2) 3) 4) 5)
8
Section 2 –
Alzheimer’s Disease
Neurodegenerative diseases such Alzheimer’s disease (AD), Parkinson’s disease, Huntington’s disease among other, are becoming increasingly prevalent. Actually, it is estimated that neurodegenerative diseases affect nearly 30 million people worldwide [5]. The prevalence of neurodegenerative diseases is directly linked to the current trends: aging societies resulting from the increased life expectancies which cause more people living long enough to be affected, augmenting significant societal, emotional and economic burdens [24].
Particularly, AD is predicted to increase dramatically over the next 40 year; being a slowly progressing, age-related neurodegenerative disease, it already affects ~2% of the population in industrialized countries [25]. Alzheimer’s disease can be termed as Sporadic Alzheimer’s disease or Familial Alzheimer’s disease. The first type accounts for more than 90% of cases and it can take up to 20 years for the disease to develop. Adults of all ages can be affected, although most cases occur in people over the age of 65 years [26]. Otherwise, familial Alzheimer’s disease is a rare type caused by a genetic mutation, which appears sooner than the Sporadic type (40 – 50 years). Generally, it is diagnosed in families that have more than one member affected in more than one generation, and when it is indistinguishable from Sporadic form [26].
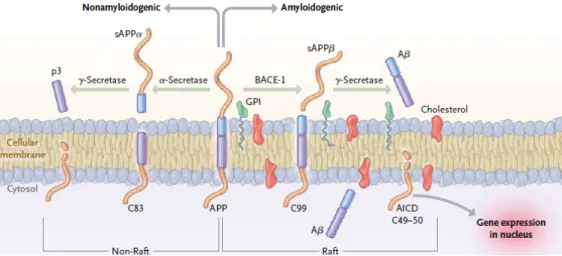
In general, Alzheimer’s disease affects cholinergic neurons being characterized by the accumulation of plaques formed of short ß-amyloid (Aß) peptides (derived from amyloid precursor protein (APP)), which occur primarily in 40mer and 42mer forms, designated Aβ40 and Aβ42 [7]) in the hippocampus region of the brain and by deposits of intraneuronal neurofibrillary tangles (NFTs) [5, 27], constituted by insoluble hyperphosphorylated forms of tau, which is a microtubule-associated protein [27]. Aß peptides are produced upon endoproteolytic cleavage of APP by ß-secretase, also known as ß-site APP-cleaving enzyme 1 (BACE1), which contributes to the formation of these plaques [5, 27]. The ß-secretase cuts APP first, producing the N-terminus of Aß and then the γ-secretase cleaves the C-terminal fragment to release the mature Aß peptide. On the other hand, a α-secretase acts within the Aß domain on APP, interrupting Aß formation (Figure 3) [28].
9 Figure 3: Schematic representation of APP processing [29].
Because γ-secretase produces several Aß peptides with heterogeneous C termini ranging from 38-43 nt long, and because ß-secretase is a site-specific protease that cleaves exactly between specific amino-acids of Aß, the last enzyme inhibition would decrease production of all forms of Aß peptides, including the pathogenic Aß42. Thus, this enzyme is recognized as a prime drug target for therapeutic inhibition of Aβ production in AD [5, 27, 30].
While a lot of efforts have been concentrated on deregulated proteins and protein-encoding genes with an important role on Alzheimer’s disease, more recently significant attention has been focused on miRNAs (Figure 4) [31].
Figure 4: MiRNA network surrounding APP, that affect direct or indirectly the APP processing and Aβ metabolism. Different types of Aβ species are produced, which differ in their degrees of toxicity. Aβ40 is the major species, while Aβ42 is the major pathologic species (adapted from [5]).
10
Several papers mention that the deregulation of miRNA expression plays a key role in AD pathogenesis [32]. MiRNAs stand out as a novel therapeutic, as in the case of APP, they regulate APP mRNA levels and have a role in alternative splicing. They also indirectly regulate APP processing via the β-secretase BACE1 that has been identified as a miRNA target, with the miRNA cluster containing miR-29a,-29b1,and-9 playing a crucial role [31].
In Table 2 are described some of the de-regulated miRNAs founded to have a role in the Alzheimer’s disease.
Table 2: De-regulated miRNA related to Alzheimer’s disease (adapted from [2, 25]).
miRNA
Upregulation (Up) or downregulation
(Down)
Target Pathological
implications Year [Ref.]
miR-9, miR-128 Up ND General neuropathology of AD. 2007 [33] miR-146a Up Complement factor H (CFH) and IL-1 receptor-associated kinase-1 (IRAK1). Sustained inflammatory response. 2008 [34] miR-107, miR- 29a/29b-1, miR-9, miR-15a, miR-19b Down BACE1 APP ( only miR-15a) Increased production of Aβ. 2008 [11, 35]
miR-106b Down APP Increased production
of Aβ. 2009 [36] miR-29a Down Neuron navigator 3 (NAV3). A putative compensatory mechanism against neurodegenerative events. 2010 [37] miR-15a Down Extracellular signal regulated kinase 1 (ERK1). Hyperphosphorylation of tau. 2010 [38] miR-485-5p Down BACE1 Increased production of Aβ. 2011 [39]
miR-124 Down PTBP1 Aberrant APP mRNA
11
Subsection 2.1 – Alzheimer’s disease and miR-29
As described on Table 2, Hebert and co-workers (2008) showed that specific loss of miRNA cluster miR-29a/b-1 was correlated with increased BACE1 expression in sporadic AD (Figure 5) and that the introduction of pre-miR-29 reduces secretion of Aβ peptides [5, 11]. These observations raised the opportunity to use pre-miR29 as a therapeutic product for AD, based on the hypothesis that decreasing the specific protein level itself is a protective therapeutic strategy [19].
The use of pre-miR instead of using the mature miRNA represents an advantage to the therapeutic process/purpose. Pre-miR molecule is longer than the mature form facilitating the purification step. Furthermore, in cellular environment the pre-miRNA is more easily recognized by cells, which will help the entrance and activity [41, 42].
Figure 5: Summary of miR-29a/b-1 role on Alzheimer’s disease (Adapted from [25]).
Recent studies have provided significant insights into the biology of the miR-29 family of miRNAs and now it is known that comprises four closely related members: miR-29a, miR-29b-1, miR-29b-2 and miR-29c [43]. All sharing identical sequences at nucleotide positions 2-8 of 5’ end and the same seed region, they highly overlap in predicted mRNA targeting as previously described [43, 44]. Some characteristics of miR-29 family members are described on the Table 3.
12
Table 3: Characteristics of miR-29 family members (adapted from [44]).
Characteristics Mature sequences
miR-29b-1 and miR-29b-2 Identical
miR-29a and miR-29c
More distantly removed from miR-29b, distinguished by only a single different nucleotide outside the seed sequence.
Bi-cistronic clusters
miR-29a/b-1 chromosome 7 of the human genome. Located on the antisense strand of
miR-29b-2/c Located on the antisense strand of
chromosome 1 of the human genome. Compartmentalization
miR-29b and miR-29c Concentrated in nucleus.
miR-29a Mainly cytoplasmatic.
Section 3 - Purification of pre-miR29
In order to use miR-29 as a therapeutic product it is important to ensure its purity, integrity and stability. Thus, the development of an efficient biotechnological process, namely the optimization of the extraction and purification methods is crucial to guarantee the miR-29 quality.
Although RNA is a sensitive molecule and has a very short half-life, once extracted from cells or tissues, is especially unstable due to the ubiquitous presence of RNases (RNA-degrading enzymes), which are present in aqueous buffers, labware and associated with human handling. These RNAses are difficult to inactivate as they do not require cofactors and because they are heat-stable and refold following heat denaturation. Therefore, RNA extraction relies on good laboratory and RNase-free techniques [12].
There are two commonly used methods to isolate RNA from natural sources (e.g. tissue samples, whole organisms, cell cultures, bodily fluids), namely a phenol-based extraction method and silica matrix or glass fiber filter-based binding method, often referred to as solid-phase extraction (SPE) [45]. Using phenol-based isolation procedures is possible to recover
13
RNA species with 10 to 200 nucleotides, and it is the recommended procedure for isolating total RNA from biological samples. This method uses a phenol-based reagent, such as TRIzol®/TRI Reagent®, to obtain a good quality total RNA (pure and intact) from a small amount of tissue [45]. The second method, solid-phase extraction, relies on using high salt or salt and alcohol to decrease the affinity of RNA for water and increase its affinity for the solid support used. This method is based on the formation of complexes between nucleic acids and the silica gel matrix, in the presence of chaotropic salts [45, 46]. The silica-based methods are less laborious and time-consuming (~30 minutes), need less manipulation, involve no pellet handling and therefore, result to a reproducible high RNA yield [45, 46].
Nowadays, there is a variety of commercially available methods for the isolation of samples enriched in small RNAs (supplied by Ambion, Stratagene, Roche, Sigma–Aldrich, Invitrogen; etc. (Table 4)) from which mirVana miRNA Isolation kit (Ambion) is the most used [47].
Table 4: Examples of commercially available kits to isolate microRNA.
Company Product Smal
RNAs Phenol Solid-phase extraction [Ref.] Ambion mirVana miRNA Isolation kit < 200 nt
Yes. Uses organic extraction (Acid-Phenol:Chloroform
extraction).
Yes. Uses two sequential filtrations with a glass-fiber filter. [48] Qiagen miRNeasy Micro Kit < 200 nt Yes. Phenol/guanidine-based lysis. Yes. Silica membrane–based purification. [49] Sigma-Aldrich mirPremier microRNA Isolation Kit Small RNAs, not specified nt
No. Employs a novel purification chemistry, without using hazardous organic extractions. Yes. [50] Stratagene Absolutely RNA miRNA Kit Small RNAs, not specified nt. Yes. Phenol/ guanidine-based lysis for cells, although for lysates prepared from cultured cells, phenol
extraction is not required. Yes. Employs silica-based fiber matrix. [51] Invitrogen Ambion® PureLink® miRNA Isolation Kit < 200 nt
No. No need for hazardous reagents such as phenol. Yes. Silica-based two-column system. [52] Roche High Pure miRNA Isolation Kit <100 nt
No. No need for organic solvent
extraction.
14
In addition to these commercial kits, further research has been performed in order to purify small RNAs. Many other methods are referred on literature, such as crush and soak method, electroelution using a dialysis bag, electroelution onto cellulose membrane, electrophoresis of RNA molecules onto diethylaminoethyl paper, centrifugal filtration through filter membranes or siliconized sterile glass wool and elution of RNAs from denaturing polyacrylamide gel electrophoresis. These are mostly time consuming, expensive and tedious methodologies [46]. To overcome these disadvantages, new techniques were explored, like the application of magnetic oligo(dT) beads for the purification of poly(A)+ RNA from total RNA sample, anion exchange HPLC to purify chemically synthetized RNAs oligonucleotides or size exclusion chromatography [46, 54]. Still, these methods are laborious and the use of synthetic RNAs represents a limitation [54].
In addition, several affinity chromatographic strategies have been developed in order to purify miRNAs (Table 5). Among which, it can be mentioned the association of biotinylated RNAs with streptavidin matrices, hybridization of poly-A sequences inside the target RNA to anchored oligo-U or oligo-dT, the immobilization of RNA aptamers with affinity for streptavidin or streptomycin, junction of RNAs with cyanogen bromide activated sepharose or the coupling of periodate-oxidized RNA with adipic acid dihydrazide-agarose beads [55]. Table 5 resumes some of the latest studies that have been done in order to separate RNAs using affinity chromatography as main method.
Table 5: Affinity chromatographic methods to achieve RNA purification.
Method Matrix RNA Advantages Disadvantages [Ref.]
Association of biotinylated RNAs with streptavidin-bearing matrices Streptavidin-agarose matrix Biotinylated RNAs High specificity; Streptavidin-agarose beads are
commercially available and the elution with biotin is done under mild
conditions.
Need RNA aptamers production; Use synthetic RNAs;
Aptamer tag insertion into an accessible region of the RNA can fail due
to misfolding. [55-57] Hybridization of poly-A sequences within the target RNA to anchored oligo-dT Oligo-dT cellulose poly(A) tail at the 3’end of pri-miRNA Available commercially. Specific method. Considerable amount of a given pri-miRNA does not
contain 5’ cap or poly(A) tail; miRNA samples need to be poly adenhylated. [58] High capacity affinity column with covalently linking an amino-modified RNA to a Sepharose support. Hi-Trap-NHS Sepharose converted on a alkyl-thiol column Amine-modified RNA Ease of performing the cystamine conversion of HiTrap columns; Reusable column. Low efficiency of direct coupling of RNA to matrix, hence, inefficient for large scale; Need
to modify the initial matrix for larger
efficiency; Synthetic RNA.
15
Even with all the progresses accomplished, there still is a long way to achieve a reliable, fast and robust method to get a good and substantial separation of a specific RNA. For example, the use of biotinylated synthetic miRNAs pulled-down on streptavidin beads presents high levels of background, because RNAs biotinylation errors can occur, also the biotin molecule stay permanently liked to RNAs and it always has impurities resulting from reaction [57]; some tagged RNAs do not cleave even after prolonged incubation which can significantly degrade the molecule and oligomeric RNA species formed during transcription can not be separated from the monomeric species [59, 60].
In order to overcome some existing drawbacks, over the last years, amino acid-based affinity chromatography has been exploited as a resource to achieve the isolation and purification of different nucleic acid, based on the natural occurrence of many different interactions between proteins and nucleic acids in biological organisms [61]. This selectivity can be explained by the recognition of the individual structure involved on amino acid/nucleic acid specific interaction [62].
First, amino acid affinity chromatography appears applied to the purification of plasmid DNA (pDNA) where histidine, arginine and lysine succeeded to isolate supercoiled pDNA isoform (sc pDNA). These studies proved that some specific interactions exist between those amino acid matrices and DNA [61]. With histidine affinity chromatography and using high salt concentration, the sc pDNA was efficiently isolated from other isoforms and host impurities, since this molecule stay strongly retained in column [12]. Although this matrix showed a good result, arginine and lysine affinity-chromatography represented a good alternative because the total retention is established with low salt concentration and species are eluted with a slight increase of ionic strength. Other study with this support allowed the 6S RNA purification with high selectivity, denoting that RNA can also be purified with amino acid-based chromatography, as well [61].
In the present work, the isolation of the miR-29 on an O-phospho-L-tyrosine matrix is proposed. This matrix was chosen given that inside the cell the miRNA binds to the complex RISC through a conserved tyrosine residue [63-65], essential to the right cleavage of mRNA.
As described on literature, the phosphorylated 5′-terminal nucleotide of the guide RNA is unpaired and stacks over a highly conserved basic pocket, anchoring to the aromatic ring of an invariant tyrosine (Tyr). This conserved Tyr has an essential role, as its absence attenuate mRNA cleavage activity [63, 64]. These studies raised the chance to explore this natural interaction, which is expected to occur as equal between the miRNA and the chromatographic matrix.
16
Subsection 3.1 - One at a time method and Design of experiments
The optimization of chromatographic methods for nucleic acid purification is often intricate and can be time consuming. Usually, the optimization is achieved by changing parameters one by one which is commonly called “one variable at a time” (OVAT)methodology or simply “one at a time” method [66]. However, purification step is not only defined by high yields and product purity. A separation step has also to take into account additional demands such process robustness, financial and ecological constraints. The need to maximize the efficiency of scientific experimentations, in order to minimize waste and cost, has caused researchers to do a set of experiments that give the most information possible with the fewest assays performed [67]. Thus, the experimental design appears as an important tool to help scientists to find the best purification method.
Although the classic theories of experimental design appear around the middle of twentieth century, it was on the past decade that they had an exponential growth as the number of papers increased [67]. Hibbert (2008) shows how this type of method has grew in the last few years and it is possible to see that “Design of Experiments” (DoE) is mostly applied on high-performance liquid chromatography (HPLC) and gas chromatography (GC) systems [67]. The DoE methodology is a multivariate statistical analysis that allows evaluating multiple variables which affect a particular process, instead one at a time [68]. With it, the multivariate data can be fitted to an empirical function, usually linear or quadratic, which can provide information about the system [67].
Most chromatographic studies performed with DoE can be classified as either method validation robustness studies or optimizing method conditions [67]. Typically, the user has to define the factors of study (normally from two to four factors) like mobile phase composition, gradient parameters, pH, temperature, injection volume or flow rate. Then, the minimum and maximum values for each factor in the experimental domain should be set. These values represent the design levels needed to establish the group of experiments to be done when the multivariate technique is employed [67, 69]. The majority of the designs used to determine response surfaces are the full and fractional factorial designs, the central composite design, Box–Behnken, Doehlert and mixture designs. Factorial designs acquire more importance when it is necessary to investigate the most important factors or which do not significantly affect the experimental responses [69]. However, central composite designs are commonly used also for optimization, even when Box–Behnken or Doehlert designs, with greater efficiency, might be better [67].
The Box-Behnken design is a three-level incomplete factorial design, which means that has three levels or more and can be used on problems with three or more factors (Figure 6). This design consists in three parts of four runs. Within each part, two factors are arranged in a full
17
two-level design, while the level of the third factor is set at zero. The points lie on the surface of a sphere centered at the origin of the coordinate system and tangential to the midpoint of each edge of the cube [67, 69].
Figure 6: The Box-Behken design in three factors. In red, within of the design, are the optional numbers of center-points. This design is useful when experiments at the extreme levels are undesirable or impossible (adapted from [70]).
As this design does not contain combinations where all the factors are at their higher or lower levels, it may be advantageous for assays under extreme conditions, for which are predicted unsatisfactory results. Thus, this design is not indicated for experiments that need to evaluate the responses at the vertices of the cube, that is, at the extreme levels [71].
Ferreira and co-workers (2007) promoted the use of Box–Behnken designs over central composite design and mostly over the three-full factorial designs where the efficiency is compromised when the factor number is higher than 2 [71]. The efficiency of a model can be obtained by the number of coefficients in the estimated design, divided by the number of experiments. Table 6 shows the different efficiencies for Box-Behken designs, central composite design and Doehlert design [71].
Table 6: Comparison of efficiency of Box-Behken designs (BBD), central composite design (CCD) and Doehlert design (DM) (adapted from [71]).
Factors Number of
coefficients
Number of experiments Efficiency
CCD DM BBD CCD DM BBD
2 6 9 7 -- 0.67 0.86 --
3 10 15 13 13 0.67 0.77 0.77
4 15 25 21 25 0.60 0.71 0.61
18
So far, Box–Behnken design has been employed for the determination of critical conditions in extraction steps, derivatization reactions and also separation steps in chromatographic methods like paper chromatography (PC), gas chromatography with flame ionization detector (GC–FID), gas chromatography–mass spectrometry (GC–MS), liquid chromatography – mass spectrometry (LC-MS) and HPLC. The Table 7 summarizes these applications of this design in optimization of chromatographic methods [69].
Table 7: Box-Behnken design applied to chromatographic studies (adapted from [67, 71]).
Chromatographic
technique Sample Analyte Optimized process
GC-ECD Wine 2-4-6 TCA, 2-4-6 TBA Extraction step
HPLC -- Aliphatic aldehydes Derivatization step
GC-MS Sediments Organochlorine pesticides Extraction step
Hydrophobic
interaction C-DAD -- Organic acids --
GC-FID Castor oil Fatty acid composition Extration step
HPLC Pharmaceutical
tablets Captopril Separation step
GC-MS -- Aminoglycoside antibiotics Derivatization
reaction
PC -- Aminoacids hydroxamates Separation step
In this present work, the Box-Behnken design was used to achieve the optimization of the purification method. A method to purify pre-miR29b-1 was also developed, using a new matrix – O-phospho-L-tyrosine – exploiting the natural interactions that occur on a natural environment. This brings the advantage of purify the pre-miR29b-1 from other small RNAs present on the sample from a previous extraction. As the Box Behnken design represents a useful technique to optimize a purification step, here it will be discussed the benefits compared to the “one at a time” methodology.
19
Chapter 2
Materials and Methods
Section 2.1 - Materials
For Rhodovulum sulfidophilum DSM 1374 culture, it was used tryptone and yeast extract from Bioakar (Beauvais, France), CaCl2.2H2O, NaCl and K2HPO4 from Panreac (Barcelona, Spain), MgSO4, glucose, KH2PO4 and FeSO4.7H2O from Sigma-Aldrich (St Louis, MO, USA), kanamycin and H3BO3 obtained from Thermo Fisher Scientific Inc. (Waltham,USA) and agar was from Pronalab (Mérida, Yucatán). The reagents used to cell lysis were β-Mercaptoethanol, sodium acetate and chloroform acquired from Merck (Whitehouse Station, USA), isopropanol from Thermo Fisher Scientific Inc. (Waltham,USA) and guanidinium thiocyanate salt and sodium citrate from Sigma-Aldrich (St Louis, MO, USA). All solutions were freshly prepared using 0.05 % Diethyl pyrocarbonate (DEPC) treated water. DEPC was purchased in Fluka (Sigma-Aldrich - St Louis, MO, USA). The matrix O-phospho-L-tyrosine agarose was purchased from Sigma-Aldrich (St Louis, MO, USA) and the salts used on buffers, Tris(hydroximethyl)methylamine (Tris) and ammonium sulfate, were bought from Nzytech (Lisboa, Portugal) and VWR (Radnor, Pennsylvania, USA) respectively. All buffers where filtered through a 0.20 µm pore size membrane (Schleicher Schuell, Dassel, Germany). All the materials used in the experiments were RNase-free.
20
Section 2.2 – Methods
Subsection 2.2.1 - Bacterial R. sulfidophilum DSM 1374 growth conditions
The RNA used in this study was obtained from the marine photosynthetic bacterium R.
sulfidophilum DSM 1374 strain, it being acquired a high production of RNAs enriched in small
RNAs and particularly pre-miR29b-1. This bacterium was previously transformed by heat-shock with pBHSR1-RM vector (genetically modified with pre-miR29b-1 sequence). The host selection was made considering that it does not produce RNases and that it selectively secretes the several nucleic acids species [72]. For pre-cultivation, a stride from a selective plate (5 g/L yeast extract, 10 g/L glucose, 20 g/L NaCl, 4.1 g/L MgCl2, 10 g/L polypeptone and 15 g/L agar supplemented with 1 mg/L ZnSO4.H2O, 10 mg/L MnO4S.4H2O, 10 mg/L FeSO4·7H2O and 30 µg/mL kanamycin) was inoculated into a 250 mL shake flask at 30 ºC and 250 rpm with 50 mL culture medium (10 g/L tryptone, 500 mg/L yeast extract, 1 g/L KH2PO4, 4 g/L K2HPO4, 30 g/L NaCl, 10 g/L glucose supplemented with 1 g/L (NH4)2SO4, 0.2 g/L MgSO4, 0.05 g/L CaCl2.2H2O and 30 µg/mL kanamycin). All liquid medium were also supplemented with a salt solution (5.56 g/L FeSO4.7H2O, 3.96 g/L Cl2CuH4O2, 5.62 g/L CoSO4.7H2O, 0.34 g/L CuCl2.2H2O, 0.58 g/L ZnSO4.7H2O, 0.6 g/L H3BO3, 0.04 g/L NiCl2.6H2O and 0.06 g/L Na2MoO4.2H2O dissolved on 0.5 N HCl), for 100 mL of medium was added 100 µL of salt solution. Cell growth was suspended in the exponential phase, ~ 2.6 OD600 (optical density of the culture medium at a wavelength of 600 nm). All fermentations where started with the appropriate amount of pre-culture, calculated to have an initial OD600 of approximately 0.2 in 100 mL of culture medium (present on a 500 mL shake flasks). After 72 h, all cells were harvested, recovered by centrifugation and stored at -20 ºC.
Subsection 2.2.2 - Lysis and small RNA isolation
Small RNAs samples were obtained by using the acid guanidinium thiocyanate–phenol– chloroform method based on what Chomczynski and Sacchi (2006) described [73]. The bacterial pellets (from 100 mL of culture medium) were resuspended by vortexing in 20 mL of 0.8 % NaCl solution and centrifuged at 6000 G during 10 min at 4 ºC. The resulting pellets were resuspended by successive pipeting using 5 mL of Solution D (4 M guanidiniumthiocyanate, 25 mM sodium citrate, pH 4.0, 0.5% (w/m) N-laurosylsarcosine (sarcosyl) and 0.1 M β-mercaptoethanol) to achieve cell lysis. After incubating on ice for 10 min, 10 mL of water-saturated phenol and 1 mL of 2 M sodium acetate (pH 4.0) are gently added and mixed to the previous mixture. This step allows the precipitation of cellular debris, genomic DNA and proteins. The small RNAs were then isolated by adding 2 mL of chloroform/isoamyl alcohol (49:1) followed by a vigorously mixing (until two immiscible
21
phases were obtained), 15 min on ice and a 20 min centrifugation at 10 000 G and 4 ºC. The aqueous phase was recovered and concentrated by the addition of 5 mL of isopropanol (-20 ºC), followed by a centrifugation step (10 000 G for 20 min at 4 ºC). The obtained pellet, which contains sRNA, was resuspended in 1.5 mL of Solution D by vortexing and concentrated again by adding 1.5 mL of isopropanol (-20 ºC). After the centrifugation of 10 min at 10 000 G and 4 ºC, was added 2.5 mL of 75% ethanol to the resulting pellet to wash all the sRNAs present and were incubated at room temperature for 10 min, followed by a 5 min centrifugation at 10 000 G (4 ºC). Pellets were air-dried and then dissolved in 1 mL of 0.05 % DEPC-treated water. Finally, the RNA concentration and purity was determined using a Nanodrop spectrophotometer and realizing an agarose gel electrophoresis.
Subsection 2.2.3- Affinity chromatography
Based on the natural interactions that occur between tyrosine and siRNas on a natural environment, this type of chromatography was performed with the samples obtained after small RNAs extraction from Rhodovulum sulfidophilum DSM 1374 cells. Affinity chromatography was performed in an AKTA Avant system with UNICORN™ 6.1 software (GE Healthcare, Sweden). A 20 mL column was packed with the commercial O-phospho-L-tyrosine agarose gel. This support is characterized as a cross-linked 4% beaded agarose matrix with an 1-atom spacer and an extent of labelling between 5 and 15 µmol/mL. The column was differently equilibrated, from 2 to 1.2 M (NH4)2SO4 in 10 mM Tris–HCl (pH 7.5) buffer, depending on the experiments performed. It was used a flow rate of 1 mL/min and the sample was injected into the column using a 200 µL loop at the same flow rate and buffer concentration of the equilibrium step. All the chromatographic process was monitored at 260 nm. After elution of unbound species with the initial equilibrium buffer, the ionic strength of the buffer was decreased stepwise in a range of 1.4 M to 0.2 M of (NH4)2SO4 in 10 mM Tris–HCl (pH 7.0) buffer, according to the experiments performed at the time. Finally, the column was washed, removing tightly bound RNA species by changing to simple 10 mM Tris–HCl (pH 7.0) buffer. All peaks were pooled according to the obtained chromatograms. The pooled fractions were then concentrated and desalted, using RNA precipitation after a PD-10 desalting column (GE Healthcare) or only using the Vivaspin concentrators (Vivascience). The PD-10 column isolates the salt molecules from the miRNA sample based on different sizes, using the gel filtration chromatography principle. The sRNA molecules elute first, because they are selectively excluded from entering the porous gel phase, being collected for further analysis. On the other hand, salt molecules will penetrate the pore volume and therefore they elute after the large molecules. At the end, all samples were reserved (at -20 ºC) for further analysis.
![Table 1: Classes of small RNAs (adapted from [4])](https://thumb-eu.123doks.com/thumbv2/123dok_br/18178755.874291/30.892.120.732.238.645/table-classes-small-rnas-adapted.webp)
![Figure 1: Translation inhibition (adapted from [4]).](https://thumb-eu.123doks.com/thumbv2/123dok_br/18178755.874291/32.892.189.673.101.498/figure-translation-inhibition-adapted-from.webp)

![Table 3: Characteristics of miR-29 family members (adapted from [44]).](https://thumb-eu.123doks.com/thumbv2/123dok_br/18178755.874291/38.892.163.693.145.635/table-characteristics-mir-family-members-adapted.webp)