http://dx.doi.org/10.1590/1980-57642018dn12-030007
Pattern of anxiety, insecurity, fear, panic
and/or phobia observed by quantitative
electroencephalography (QEEG)
Valdenilson Ribeiro Ribas1, Renata Guerra Ribas2, Jean de Almeida Nóbrega3, Marcília Vieira da Nóbrega3, Juliana Azevedo de Andrade Espécie4, Murilo Tolêdo Calafange4,
Clenes de Oliveira Mendes Calafange4, Hugo André de Lima Martins1
ABSTRACT. Stress is a response in which an individual wants to have more control over a situation. A constant state of stress is called anxiety. Some patients deny symptoms. An instrument can help arrive at a diagnosis. Objective: Using TQ-7 QEEG, this study aimed to evaluate the association of symptoms of anxiety, insecurity, fear, panic and phobia with hot temporals defined as Beta (15-23 Hz) >17% and High-Beta waves (23-38 Hz) >10% at T3 and T4. Methods: Five hundred and forty-three patients of both genders with ages ranging from 16-59 years were evaluated, divided into two groups: Control (without hot temporals: n=274) and Case Group (with hot temporals: n=269). The Chi-square test was used (p-values ≤0.05). Results: There was a significant association (p-value <0.001) between the symptoms related to amygdala activation, expressed in the temporals (Beta >17% and High-Beta >10%). (Anxiety, T3=89.6% – T4=88.8%; T3=92.6% – T4=93.3%), (Fear, T3=80.7% – T4=84.4%; T3=82.9% – T4=95.9%), (Insecurity, T3=82.2% – T4=81.4%; T3=69.5% – T4=97.8%), (Panic, T3=52.4 – T4=72.5%; T3=90.3% – T4=74.0%), (Phobia, T3=17.5% – T4=22.7%; T3=19.7% – T4=27.1%), when compared to the respective controls (Beta control, T3=8.4%, 10.2%, 21.2%, 1.1%, 0.4% and T4=11.3%, 4.4%, 23.0%, 2.6%, 1.1%) (High-Beta control, T3=4.0%, 6.9%, 6.2%, 0.4%, 0.0% and T4=17.5%, 6.2%, 3.3%, 4.0%, 0.7%). Conclusion: Anxiety, insecurity, fear, panic and phobia are observed by QEEG when the levels of total Beta >17% and High-Beta waves >10% at T3 and T4.
Key words: anxiety, fear, panic, phobia, quantitative electroencephalography (QEEG).
PADRÃO DE ANSIEDADE, INSEGURANÇA, MEDO, PÂNICO E/OU FOBIA OBSERVADO NO EXAME DE ELETROENCEFALOGRAFIA QUANTITATIVA (QEEG)
RESUMO. O estresse é uma resposta a uma situação na qual, um indivíduo quer ter mais controle. Um estado de estresse constante é chamado de ansiedade. Alguns pacientes negam sintomas. Um instrumento pode auxiliar um diagnóstico.
Objetivo: Utilizando o QEEG TQ-7, este estudo objetivou avaliar a associação dos sintomas de ansiedade, insegurança, medo, pânico e/ou fobia com a categoria de temporais quentes definidos como Beta (15-23 Hz) >17% e Beta-Alta (23-38 Hz) >10% em T3 e T4. Métodos: Foram avaliados 543 pacientes de ambos os gêneros na faixa etária de 16-59 anos, divididos: Controle (sem temporais quentes: n=274) Grupo estudado (com temporais quentes: n=269). Foi utilizado o teste qui-quadrado (p-valor ≤0.05). Resultados: Houve associação significativa (p-valor <0.001) entre os sintomas relacionados à ativação da amigdala, expressos nos temporais (Beta >17% e Beta-Alta >10%). (Ansiedade, T3=89,6% – T4=88,8%; T3=92,6% – T4=93,3%), (Medo, T3=80,7% – T4=84,4%; T3=82,9% – T4=95,9%), (Insegurança, T3=82,2% – T4=81,4%; T3=69,5% – T4=97,8%), (Pânico, T3=52.4% – T4=72.5%; T3=90.3% – T4=74.0%), (Fobia, T3=17,5% – T4=22,7%; T3=19,7% – T4=27,1%), quando comparados aos respectivos controles (Beta controle, T3=8,4%, 10,2%, 21,2%, 1,1%, 0,4% e T4=11,3%, 4,4%, 23,0%, 2,6%, 1,1%) e (Beta-Alta Controle, T3=4,0%, 6,9%, 6,2%, 0,4%, 0,0%; T4=17,5%, 6,2%, 3,3%, 4,0%, 0,7%). Conclusão: Ansiedade, insegurança, medo, pânico e fobia são observados no QEEG, quando Beta >17% e Beta-Alta >10% em T3 e T4.
Palavras-chave: ansiedade, medo, pânico, fobia, eletroencefalografia quantitativa (QEEG).
This study was conducted at the Universidade Federal de Pernambuco Ringgold Standard Institution. Neuropsiquiatria e Ciências do Comportamento, Recife, PE, Brazil.
1Universidade Federal de Pernambuco Ringgold Standard Institution – Pós-Graduação em Neuropsiquiatria e Ciências do Comportamento, Recife, PE, Brazil. 2Cérebro
e Tecnologia Neurofeedback Recife (CTNR) – Cursos/Pesquisas, Jaboatão dos Guararapes, PE, Brazil. 3Universidade Federal de Campina Grande Ringgold Standard
Institution – Electronic Engineering, Campina Grande, PB, Brazil. 4Universidade Federal de Pernambuco Ringgold Standard Institution – Psychology, Recife, PE, Brazil.
Valdenilson Ribeiro Ribas. Universidade Federal de Pernambuco Ringgold Standard Institution – Pós-Graduação em Neuropsiquiatria e Ciências do Comporta-mento – Av. Prof. Moraes Rego, 1235 – 50670-901 Recife PE – Brazil. E-mail: [email protected].
A
nxiety is an emotional state with physiological1 orpsychological components.2 As part of the normal
spectrum of human experiences, it is a driving force behind human performance.3 However, it becomes
pathological when it is dysfunctional in proportion to the situation that triggers it, or when there is no reason for its existence.4
Some factors have been listed as having relevant roles in the etiology of pathological anxiety. These include dissatisfaction at work,5 a feeling of restlessness
and stressful environments at home or work6 and, above
all, repetitive thoughts such as the habit of complaining (in the sense of lamentation),7 over-analyzing,
criticiz-ing excessively, continuously judgcriticiz-ing and always think-ing about the future and the past.8,9
Hence, it seems important to understand that path-ological anxiety is a multifactorial disease,10 because
there are psychological and/or neurophysiological com-ponents. Psychological components include low control by psychic defenses (rationalization, reactive forma-tion, sublimaforma-tion, projecforma-tion, regression, transference and displacement),11,12 which can be measured using
the Rorschach Projective test.13,14 Neurophysiological
components, on the other hand, include low functional reserves (vitamins, proteins, amino acids and lipids) at the level of neuroglia (astrocytes, oligodendrocytes and/or Schwann cells)15 causing a low baroreflex rate,16
alterations in the physiological response observed by peripheral temperature17 and adrenal exhaustion.18
Thus, when one thinks of measuring anxiety from the physiological point of view, some professionals do so by adrenal response controlled by the autonomic nervous system (sympathetic and parasympathetic). The central nervous system has received prominence only in the neurochemical context, that is, in relation to neurotransmitters.
Hence, this study aimed to demonstrate that there is an expected pattern that identifies anxiety through brain electrical activity using quantitative electroen-cephalography (QEEG), which can help physicians and other healthcare professionals diagnose subjects and, consequently, to choose the best treatment.
METHODS
Subjects
Five hundred and forty-three patients of both genders aged between 16 and 59 were evaluated at the Recife Brain and Neurofeedback Clinic (CTNR) under standard conditions at a temperature of 20±2°C. In this cross-sectional, experimental, exploratory study, all the evalu-ations were performed in a single exam using QEEG of
the TQ-7 neurofeedback system. The inclusion criterion was confirmation of a clinical diagnosis of anxiety by a physician, according to the Diagnostic and Statistical Manual of Mental Disorders (DSM V) criteria:
A) Excessive anxiety and worry, occurring on most days over more than six months and linked to events and activities (e.g. work and school performance);
B) Worry is difficult to control;
C) Anxiety and worry are associated with three (or more) of the following symptoms (with at least some symptoms being present on most days in the last six months): restlessness or a feeling of being on edge, get-ting tired easily, difficulty concentraget-ting, irritability, muscle tension, and sleep disturbances (difficulty falling or staying asleep and having unsatisfying sleep);
D) Physical symptoms, worry or anxiety cause clini-cally significant distress or impairment in social, occu-pational, or other activities;
E) The disturbance cannot be attributed to a gen-eral medical condition, substance use or other mental disorder.
Patients under 16 years old were not included in this study.
Characterization of the TQ-7 method
The TQ-7 is an evaluation method called Trainers’ QEEG, which is in version 7,19 a component of The
Learning Curve (TLC) technique, based on a protocol of 6 categories (disconnected, hot temporal lobes, reversals or asymmetry, blocking, locking, filtering and processing). It is described in the study: “The Learning Curve in Neurofeedback of Peter Van Deusen: a Review Article,” published in this journal, Dementia & Neuro-psychology in 2016.19,20
The TLC Assessment or Trainers’ QEEG (TQ) method19 is enabled through the Q-wiz amplifier and
the Bioexplorer program.20,21 The Q-wiz has four
simul-taneous 24-bit channels and a maximum sampling rate of 512 samples per second; each channel has a high pass filter of 0.2 Hz and the signals are analyzed by a pro-gram called Bioexplorer. Bioexplorer was developed by CyberEvolution Inc. for real time biological signal acqui-sition, processing, display, recording and playback. It permits the user to create a setup (or ‘design’) graphically in order to process the raw signals from the Q-wiz ampli-fier by interconnecting different processing, display and audio objects for biofeedback.21 The processing objects
thresholds, graphical trends, power spectrum, audio and MIDI playback, video player and flash game play-ers, all of which are controlled by processing objects.21
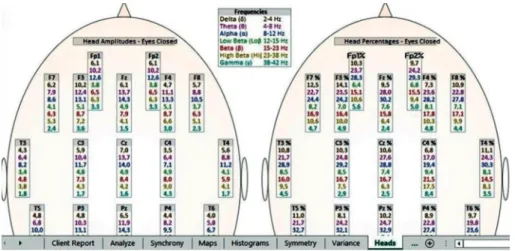
The patterns investigated are related to the acti-vation of T3 and T4 temporal electrodes of the 10-20 EEG system, where values between 14 and 17% of beta waves (15-23 Hz) and a maximum of 10% of high-beta waves (23-38 Hz) are expected20 (Figure 1 and Figure
2). When values above these percentages are observed, the condition is called hot temporal lobe according to the investigative standard of The Learning Curve (TLC) in neurofeedback by Peter Van Deusen19,20 (Figure 3
and Figure 4). In these cases, one would expect to find symptoms of anxiety, fear, insecurity, panic and/or pho-bia.20 During the evaluation using the TQ-7 method, the
electrodes are placed according to the rules of the 10-20 system.22 The evaluation is performed with eyes closed,
eyes open, and open performing a task.23 The task of
each standard site is designed to activate the site and is measured using an algorithm that calculates the total percentage of each frequency band of brainwaves.23 To
assess the C3, C4, T3 and T4 sites, the evaluator tells a story for the patient to remember the details; F3, F4,
P3 and P4 are activated when the respondent is asked to remember several sequences of numbers; the F7, F8, T5 and T6 sites are activated by interpreting a text; the Fz, Pz, Cz and Oz sites are activated when the patient thinks about their plans for the following day; and the Fp1, Fp2, O1 and O2 sites are evaluated by counting the number of times the letter ‘a’ appears in a short text.19,21
A maximum of 30% of beta (15-23 Hz) and high-beta (23-38 Hz) waves is still expected at all major points of the 10-20 EEG system, compared to the sum of the percentages of the average and slow waves, especially in the posterior area of the brain, specifically at P3, P4, T5, T6, O1 and O2.20,23 Values above 30% indicate a type of
anxiety linked to issues of worry and indicate a pattern of brain electrical activity related to difficulty reducing activation for nocturnal rest.23
The groups
This cross-sectional study was performed in subjects with ages ranging from 16 to 59 years divided into two groups: the Control Group was made up of male and female patients without hot temporal lobes (n=274)
Figure 1. Percentage expected quantity of beta waves (15-23 Hz) and Beta-Alta (23-38 Hz) at the T3 and T4 points of the 10-20 electroencephalography system in a summary statistical distribution (TQ-7 analyze page), expressed in black color, representing the control group.
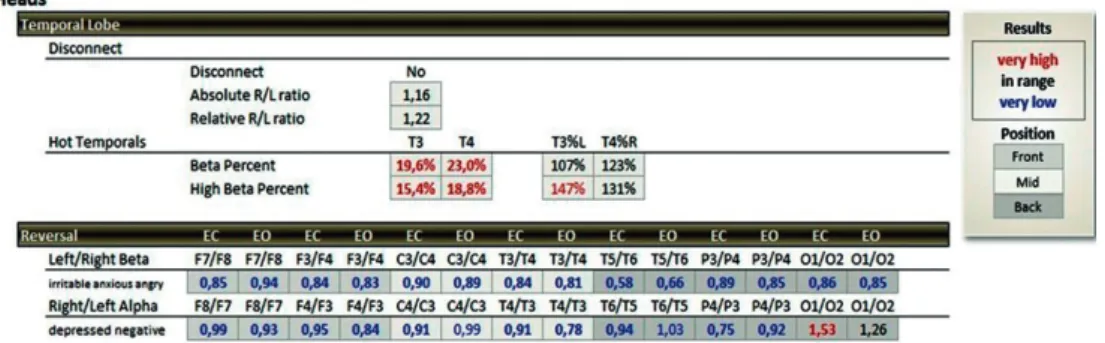
Figure 3. Percentage quantity above the expected beta wave (15-23 Hz >17%) and Beta-High (23-38 Hz >10%) at the T3 and T4 points of the 10-20 electroencephalography system in a summary statistical distribution (TQ-7 analyze page), expressed in red color,
representing the group studied (hot temporal lobes).
Figure 4. Percentage quantity above the expected beta wave (15-23 Hz >17%) and Beta-High (23-38 Hz >10%) at the T3 and T4 points of the 10-20 electroencephalography system in a broad statistical distribution (TQ-7 heads page), expressed in red color, representing the group studied (hot temporal lobes).
and the Case Group comprised patients of both genders with hot temporal lobes (n=269).
We used the following equation to calculate the sam-ple size for an infinite population:
n =
z
2
* P * Q
e
2Where
n = sample size;
z = 1.96 (according to table of area under normal curve for the given 95% confidence level);
P = 0.5 = 50% to succeed;
Q = 0.5 = 50% of failure;
e = estimate of the percentage of the true value; e2= 5% (for an expected estimate of 5% of the true value).
Data analysis
The data were analyzed using the Chi-square test with significance set for p-values ≤0.05. The results are expressed as frequencies and percentages and repre-sented in a contingency table.
RESULTS
Phobia (73/269: 27.1%) (Table 4), when compared to the respective controls (T3=4.0%, 6.9%, 6.2%, 0.4%, 0.0% (Table 2); T4=17.5%, 6.2%, 3.3%, 4.0%, 0.7%) (Table 4).
DISCUSSION
This study found an association between the symptoms of anxiety, fear, insecurity, panic and phobia, and the
category of hot temporal lobes (T3 and T4) of the TLC technique using the TQ-7 method.
Although, these findings corroborate data gathered in the experiments of Van Deusen (1994-2001) apud
Ribas et al. (2016),20 not all patients present these five
symptoms simultaneously; there are patients exhibiting from four to only one of the symptoms described above. This phenomenon, which allows differentiation between
Table 1. Evaluation of symptoms according to group: Percent of Beta (15-23 Hz) wave in left temporal lobe (T3).
Variables
Group
p-value Control (Less than 17%) Hot temporal lobes (More than 17%)
n % N %
Total 274 100.0 269 100.0
Anxiety Yes 23 8.4 241 89.6 p** <0.001*
No 251 91.6 28 10.4
Fear Yes 28 10.2 217 80.7 p** <0.001*
No 246 89.8 52 19.3
Insecurity Yes 58 21.2 221 82.2 p** <0.001*
No 216 78.8 48 17.8
Panic
Yes 3 1.1 141 52.4
p** <0.001*
No 271 98.9 128 47.6
Phobia Yes 1 0.4 47 17.5 p** <0.001*
No 273 99.6 222 82.5
*Significant difference at 5.0%. **Pearson Chi-square test.
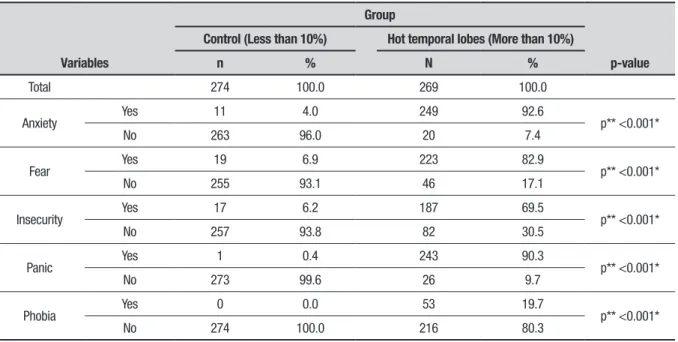
Table 2. Evaluation of symptoms according to group: Percent of High Beta (23-38 Hz) wave in left temporal lobe (T3) .
Variables
Group
p-value Control (Less than 10%) Hot temporal lobes (More than 10%)
n % N %
Total 274 100.0 269 100.0
Anxiety Yes 11 4.0 249 92.6 p** <0.001*
No 263 96.0 20 7.4
Fear Yes 19 6.9 223 82.9 p** <0.001*
No 255 93.1 46 17.1
Insecurity Yes 17 6.2 187 69.5 p** <0.001*
No 257 93.8 82 30.5
Panic Yes 1 0.4 243 90.3 p** <0.001*
No 273 99.6 26 9.7
Phobia Yes 0 0.0 53 19.7 p** <0.001*
No 274 100.0 216 80.3
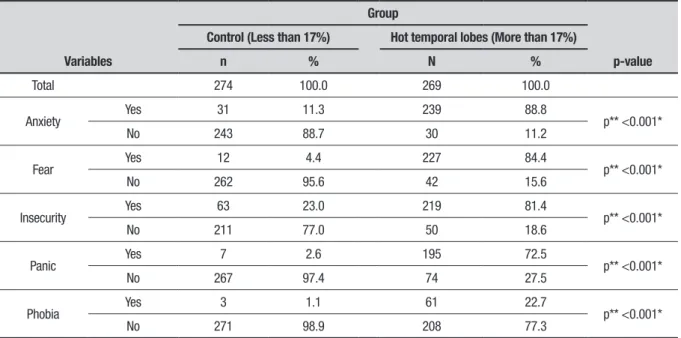
Table 3. Evaluation of symptoms according to group: Percent of Beta (15-23 Hz) wave in left temporal lobe (T4).
Variables
Group
p-value Control (Less than 17%) Hot temporal lobes (More than 17%)
n % N %
Total 274 100.0 269 100.0
Anxiety
Yes 31 11.3 239 88.8
p** <0.001*
No 243 88.7 30 11.2
Fear Yes 12 4.4 227 84.4 p** <0.001*
No 262 95.6 42 15.6
Insecurity Yes 63 23.0 219 81.4 p** <0.001*
No 211 77.0 50 18.6
Panic Yes 7 2.6 195 72.5 p** <0.001*
No 267 97.4 74 27.5
Phobia Yes 3 1.1 61 22.7 p** <0.001*
No 271 98.9 208 77.3
*Significant difference at 5.0%. **Pearson Chi-square test.
Table 4. Evaluation of symptoms according to group: Percent of High Beta (23-38 Hz) wave in left temporal lobe (T4).
Variables
Group
p-value Control (Less than 10%) Hot temporal lobes (More than 10%)
n % N %
Total 274 100.0 269 100.0
Anxiety Yes 48 17.5 251 93.3 p** <0.001*
No 226 82.5 18 6.7
Fear Yes 17 6.2 258 95.9 p** <0.001*
No 257 93.8 11 4.1
Insecurity Yes 9 3.3 263 97.8 p** <0.001*
No 265 96.7 6 2.2
Panic Yes 11 4.0 199 74.0 p** <0.001*
No 263 96.0 70 26.0
Phobia Yes 2 0.7 73 27.1 p** <0.001*
No 272 99.3 196 72.9
*Significant difference at 5.0%. **Pearson Chi-square test.
the perceptions of the symptoms, seems to be related to the difference between the levels of functioning of psychic defense mechanisms that allow lower levels of anxiety and stress, even with the support of auxiliary egos or placebos of the masses, such as superstitions, rituals and faith expressed in religious spaces.24
Thus, it seems relevant to make the following anal-ogy: just as the DSM-5 considers the etiology of
mul-tifactorial mood disorder (psychological, environmen-tal, biological and/or genetic),25 one can imagine that
anxiety control can also be achieved via multifactorial forms (psychological, amygdalae, adrenal and cognitive concentration). The example mentioned in the previ-ous paragraph, about psychic defense mechanisms, can explain the control of anxiety psychologically.11,26
previous paragraph, emerged as follows: the neurologist Sigmund Freud observed that his patients presented ways of thinking and acting that reduced their levels of anxiety and stress, which he generically called psychic defense mechanisms. He then classified them as ratio-nalization, reactive formation, sublimation, fixation, repression, regression, projection, denial, and transfer, among others.27
However, if individuals do not have a sound family structure that allows them to acquire these defenses to protect them from the persistent discomforts of anxi-ety, the neurochemical and electrical functioning of the autonomic and central nervous systems is eventually affected.
The human physiological response to stress was fully adapted to protect people from danger28 during the life
of our ancestors when they had to flee from danger-ous animals. It is a fight or flight reaction,29 when the
body needs strength to protect itself from danger. The activation of the temporal lobes, specifically T3 and T4, seems to indicate an excessive activation of the amygdalae.30
The amygdalae act as a sensor of threats or a lack of control, communicating the need for a reaction to the hypothalamus. The hypothalamus, in turn, releases corticotropin-releasing hormone (CRH), which binds to the adenohypophysis that then produces the adre-nocorticotrophic hormone (ACTH). ACTH binds to the adrenal cortex and adrenal medulla.31
Beta waves begin to appear in humans when they are between 5 and 6 years of age and have generators in different locations.32 Low-beta waves (12-15 Hz) are
generated in the thalamic nuclei and cortex, especially in the sensorimotor area,33 whereas beta waves (15-23
Hz) and high-beta waves (23-38 Hz) are generated in the cortex.34 Low-beta and beta waves indicate that
the individual is conscious and processing, whereas high-beta waves are responsible for alerting the indi-vidual through fear, anxiety and hypervigilance.35
The response to anxiety through the amygdala can be observed by excess beta waves (15-23 Hz) above 17% and by excess high-beta waves (23-38 Hz) above 10% throughout the brain, specifically, in temporal lobes (T3 and T4).20
To understand the control of adrenal anxiety, it seems relevant to understand its anatomical and func-tional formation. The adrenal cortex is divided into three parts. The glomerulosa produces mineralocor-ticoids, a class of steroid hormones, with aldosterone being the main hormone of this class. Aldosterone has the function of controlling the metabolism of water and
sodium in blood plasma.36 The fasciculata produces
glu-cocorticoids, with cortisol being the most important.37
Thirdly, the reticularis (innermost region) produces sex hormones, such as estrogen, progesterone, testosterone and dehydroepiandrosterone (DHEA).38,39
The inner region, the adrenal medulla, produces cate-cholamines (Dopamine, Noradrenaline and Adrenaline). The production of catecholamines begins with the action of the enzyme tyrosine hydroxylase, a cytosolic enzyme only found in cells that contain catecholamines, which adds a hydroxyl to the compound tyrosine to form dihy-droxyphenylalanine (DOPA). This first step of hydrox-ylation is the main control point in the synthesis of noradrenaline. Next, norepinephrine is converted into adrenaline by the phenylethanolamine-N-methyl trans-ferase enzyme in the adrenal gland.40,41
Adrenaline is an important hormone in the response to stress because it increases glucagon concentration, which stimulates an increase in glucose and blocks insu-lin production thereby increasing heart rate, decreasing gastrointestinal motility, causing mydriasis, and increas-ing muscle energy. Thus, the adrenal gland controls the activation of the state of alert. However, if it remains activated or if it works constantly with a low functional reserve (amino acids, proteins, vitamins, minerals, lipids and complex carbohydrates), it can evolve to exhaustion, impairing the control of anxiety.18
Thus, even though this study found an association between anxiety, fear, insecurity, panic and phobia with high activation of the amygdalae expressed in the T3 and T4 regions, it is recognized that it is not the only region that can measure or control anxiety.
Another way to identify an anxious brain that was not investigated in this study but may be the subject of future studies is the excessive activation of the pos-terior region of the brain, indicating that the subject is thinking a lot about the past, analyzing, criticizing or judging. This is because most blood flow will certainly be in the posterior region of the brain as blood enables the firing of active neurons after the second (Krebs cycle) and the third stage of cellular respiration (oxidative phosphorylation) with conversion of energy sources: carbohydrates, proteins and lipids into adenosine tri-phosphate and exothermic energy.42
These findings are very relevant because they may allow physicians to use the QEEG examination to com-plement their clinical diagnosis of anxiety. This is espe-cially true in those patients who are not very self-aware or who have difficulty reporting their complaints,
mak-ing them more susceptible to heart attack or stroke due to their high levels of untreated anxiety.
Author contributions. All authors contributed
signifi-cantly to, and approved, the content of this manuscript.
REFERENCES
1. Harris SR, Kemmerling RL, North MM. Brief virtual reality therapy for public speaking anxiety. Cyberpsychol Behav. 2002;5(6):543-50. 2. Zimmermann T, Pabst S, Bertram A, Schiffer M, de Zwaan M. Differences
in emotional responses in living and deceased donor kidney transplant patients. Clin Kidney J. 2016;9(3):503-9.
3. Gola KA, Shany-Ur T, Pressman P, Sulman I, Galeana E, Paulsen H, et al. A neural network underlying intentional emotional facial expression in neurodegenerative disease. Neuroimage Clin. 2017;14:672-8. 4. Polo-Kantola P, Aukia L, Karlsson H, Karlsson L, Paavonen EJ. Sleep
quality during pregnancy: associations with depressive and anxiety symptoms. Acta Obstet Gynecol Scand. 2017;96(2):198-206. 5. Newbury-Birch D, Kamali F. Psychological stress, anxiety, depression,
job satisfaction, and personality characteristics in preregistration house officers. Postgrad Med J. 2001;77(904):109-11.
6. Denton M, Zeytinoglu IU, Davies S, Lian J. Job stress and job dissatis-faction of home care workers in the context of health care restructuring. Int J Health Serv. 2002;32(2):327-57.
7. Marks I, Lader M. Anxiety states (anxiety neurosis): a review. J Nerv Mental Dis. 1973;156(1):3-18.
8. Suliman WA, Halabi J. Critical thinking, self-esteem, and state anxiety of nursing students. Nurse Educ today. 2007;27(2):162-8.
9. MacLeod AK, Tata P, Kentish J, Jacobsen H. Retrospective and prospective cognitions in anxiety and depression. Cogn Emot. 1997; 11(4):467-79.
10. Bandelow B, Torrente AC, Wedekind D, Broocks A, Hajak G, Rüther E. Early traumatic life events, parental rearing styles, family history of mental disorders, and birth risk factors in patients with social anxiety disorder. Eur Arch Psychiatry Clin Neurosci. 2004;254(6):397-405.
11. Stuteville JR. Psychic defenses against high fear appeals: A key marketing variable. J Marketing. 1970:39-45.
12. Mijolla A. International Dictionary of Psychoanalysis, Volume 2: G-Pr: Macmillan Reference USA; 2005.
13. Van Kolck OL. Testes projetivos gráficos no diagnóstico psicológico. Arq Bras Psicol. 1984;37(3):171-2.
14. Formiga NS, Mello I. Testes psicológicos e técnicas projetivas: uma inte-gração para um desenvolvimento da interação interpretativa indivíduo-psicólogo. Psicol Ciênc Prof. 2000;20(2):12-9.
15. Ferrans CE, Zerwic JJ, Wilbur JE, Larson JL. Conceptual model of health-related quality of life. J Nurs Scholarsh. 2005;37(4):336-42. 16. Sleight P, La Rovere MT, Mortara A, Pinna G, Maestri R, Leuzzi S, et al.
Physiology and pathophysiology of heart rate and blood pressure vari-ability in humans: is power spectral analysis largely an index of baroreflex gain? Clin Sci. 1995;88(1):103-9.
17. Gagge AP, Stolwijk J, Hardy J. Comfort and thermal sensations and associated physiological responses at various ambient temperatures. Environ Res. 1967;1(1):1-20.
18. Marik PE. Adrenal-exhaustion syndrome in patients with liver disease. Int Care Med. 2006;32(2):275-80.
19. Ribas VR, Ribas RMG, de Oliveira DCL, Regis CLS, do Nascimento Filho PC, Sales RSR, et al. The Functioning of the Brain Trained by Neuro-feedback with Behavioral Techniques from a Learning Curve Perspective. J Psychol Psychother Res. 2016;3(2):12-9.
20. Ribas VR, Ribas RdMG, Martins HAL. The Learning Curve in neuro-feedback of Peter Van Deusen: A review article. Dement Neuropsychol. 2016;10(2):98-103.
21. Ribas VR, De Souza MV, Tulio VW, Pavan MS, Azzolin G, Ribas RMG, et al. Treatment of Depression with Quantitative Electroen-cephalography (QEEG) of the TQ-7 Neuro-feedback System Increases the Level of Attention of Patients. J Neurol Disord. 2017;5:3. DOI: 10.4172/2329-6895.1000340.
22. Homan RW, Herman J, Purdy P. Cerebral location of international 10-20 system electrode placement. Electroencephal Clin Neurophysiol. 1987;66(4):376-82.
23. Van Deusen P, Guerra-Ribas R, da Silva E, Lima da Silva T, Ribas V, editors. Tratamento de paciente com depressão pela técnica The Learning Curve-TLC em Neurofeedback: estudo de caso. IV Congresso de Biomedicina e Farmácia da Faculdade ASCES; 2014.
24. Alvarado KA, Templer DI, Bresler C, Thomas-Dobson S. The relation-ship of religious variables to death depression and death anxiety. J Clin Psychol. 1995;51(2):202-4.
25. Association AP. DSM-5: Manual diagnóstico e estatístico de transtornos mentais: Artmed Editora; 2014.
26. Freud A. The ego and the mechanisms of defence: Karnac Books; 1992. 27. Vaillant GE. Adaptive mental mechanisms: Their role in a positive
psychology. Am Psychol. 2000;55(1):89.
28. Kroemer G, Mariño G, Levine B. Autophagy and the integrated stress response. Mol Cell. 2010;40(2):280-93.
29. Piccini I, Fehrmann E, Frank S, Muller FU, Greber B, Seebohm G. Adren-ergic Stress Protection of Human iPS Cell-Derived Cardiomyocytes by Fast Kv7.1 Recycling. Front Physiol. 2017;8:705.
30. Othmer E, Othmer JP, Othmer SC. Brain functions and psychiatric disor-ders: A clinical view. Psychiatr Clin North Am. 1998;21(3):517-66. 31. Porzionato A, Macchi V, Rucinski M, Malendowicz LK, De Caro R.
Natri-uretic peptides in the regulation of the hypothalamic-pituitary-adrenal axis. Int Rev Cell Mol Biol. 2010;280:1-39.
32. Lindsley DB. Electrical potentials of the brain in children and adults. J Gen Psychol. 1938;19(2):285-306.
33. Khanna P, Carmena JM. Beta band oscillations in motor cortex reflect neural population signals that delay movement onset. Elife. 2017; 6:e24573.
34. Rowe DL, Cooper NJ, Liddell BJ, Clark CR, Gordon E, Williams LM. Brain structure and function correlates of general and social cognition. J Integ Neurosci. 2007;6(01):35-74.
35. Price J, Budzynski T. Anxiety, EEG patterns, and neurofeedback. Intro-duction to quantitative EEG and neurofeedback: Advanced theory and applications. 2009:453-70.
36. Biglieri EG, Kater CE. Mineralocorticoids in congenital adrenal hyper-plasia. J Steroid Biochem Mol Biol. 1991;40(4-6):493-9.
37. Findling JW, Aron DC, Tyrrell JB. Glucocorticoids & Adrenal Androgens: Basic & Clinical Endocrinology. Stamford, CT: Lange Medical Boods; 1997.
38. Bassett MH, White PC, Rainey WE. A role for the NGFI-B family in adrenal zonation and adrenocortical disease. Endocr Res. 2004;30(4):567-74. 39. Davies W. SULFATION PATHWAYS: The steroid sulfate axis and its
relationship to maternal behavior and mental health. J Mol Endocrinol. 2018;61(2):T199-T210
40. Axelrod J. The formation, metabolism, uptake and release of noradren-aline and adrennoradren-aline. The clinical chemistry of monoamines: Elsevier Amsterdam; 1963:5-18.
41. Eisenhofer G, Kopin IJ, Goldstein DS. Catecholamine metabolism: a contemporary view with implications for physiology and medicine. Phar-macol Rev. 2004;56(3):331-49.
42. Bespalova SV, Tolpygo KB. [Excitation of the hydrogen bond by the energy of hydrolysis of adenosine-5’-triphosphate]. Biofizika. 1998;43(3): 484-9.
43. Davidson RJ, Kabat-Zinn J, Schumacher J, Rosenkranz M, Muller D, Santorelli SF, et al. Alterations in brain and immune function produced by mindfulness meditation. Psychosom Med. 2003;65(4):564-70. 44. Damsa C, Kosel M, Moussally J. Current status of brain imaging in