Corn agronomic traits and recovery of nitrogen from
fertilizer during crop season and off-season
Luis Felipe Garcia Fuentes(1), Luiz Carlos Ferreira de Souza(1), Ademar Pereira Serra(2),
Jerusa Rech(1) and Antonio Carlos Tadeu Vitorino(1)
(1)Universidade Federal da Grande Dourados, Faculdade de Agronomia, Rodovia Dourados-Itahum, Km 12, Cidade Universitária, Caixa Postal 533, CEP 79804-970 Dourados, MS, Brazil. E-mail: lufegafu@hotmail.com, luizsouza@ufgd.edu.br, jerusarech@hotmail.com, antoniovitorino@hotmail.com (2)Embrapa Gado de Corte, Avenida Rádio Maia, no 830, Zona Rural, CEP 79106-550 Campo Grande, MS, Brazil. E-mail: ademar.serra@embrapa.br
Abstract – The objective of this work was to evaluate corn agronomic traits in a cultivation subjected to different N rates, during the fall–winter (off-season) and spring–summer crop seasons, and N recovery from fertilizer. The experiment was set up in a randomized complete block design with four replicates, in a 5x2 factorial arrangement, with the following treatments: five N topdressing rates – 0, 30, 60, 90, and 120 kg ha-1 –, using urea as source; and two crop seasons, fall–winter and spring–summer. The following variables were determined: plant height, height of the first ear insertion, number of grains per ear, diameter and length of ear, 1,000-grain weight, N concentration in the leaves and grains, grain-protein concentration, grain yield, N recovery from fertilizer, and soil-N supply. Nitrogen rates in the fertilizer in the fall–winter season had no effect on grain yield, although corn agronomic traits showed a greater reliance on fertilizer-N rates in that season than in the spring–summer, which is a season associated to a greater capacity of soil-N supply to plants. The quantification of soil-N supply enabled knowing the nutrient dynamics during the fall–winter and the spring–summer seasons, which may be useful to guide N fertilization of corn.
Index terms: Zea mays, N-fertilizer management, plant nutrition, soil fertility, soil-N supply.
Características agronômicas do milho e recuperação de
nitrogênio do fertilizante durante a safra e a safrinha
Resumo – O objetivo deste trabalho foi avaliar características agronômicas do milho em um cultivo submetido a diferentes doses de N, nas safras de outono–inverno (safrinha) e primavera–verão, e a recuperação do N do fertilizante. O experimento foi disposto em blocos ao acaso, com quatro repetições, em arranjo fatorial 5x2, com os seguintes tratamentos: cinco doses de N em cobertura – 0, 30, 60, 90 e 120 kg ha-1 –, com uso de ureia como fonte; e duas estações de cultivo, outono–inverno e primavera–verão. As seguintes variáveis foram determinadas: altura de planta, altura da inserção da primeira espiga, número de grãos por espiga, diâmetro e comprimento da espiga, massa de 1.000 grãos, concentração de N nas folhas e nos grãos, concentração de proteína nos grãos, produtividade de grãos, recuperação de N do fertilizante e suprimento de N pelo solo. As taxas de N do fertilizante na estação outono–inverno não influenciaram a produtividade de grãos, embora as características agronômicas do milho tenham apresentado maior dependência do N do fertilizante naquela estação do que na primavera–verão, que é uma estação associada a uma maior capacidade do solo de fornecer N para as plantas. A quantificação do suprimento de N pelo solo permitiu saber a dinâmica do nutriente durante a safrinha e a safra de primavera–verão, o que pode ser útil para guiar a fertilização nitrogenada do milho.
Termos para indexação: Zea mays, manejo da adubação nitrogenada, nutrição de plantas, fertilidade do solo, suprimento de N pelo solo.
Introduction
Nitrogen use efficiency in cereals is quite low
– 33% on average (Raun & Jonhson, 1999). As reported by Bruulsema et al. (2009), the “4R nutrient stewardship” (right rate, right source, right place, and
right time) is necessary to make decisions regarding the N-fertilization aiming at social, economic, and
environmental benefits.
losses from urea through NH3 volatilization is a major
problem, decreasing the N use efficiency from this
source even in acid soils, since urease activity increases pH in the vicinity of fertilizer particles (Hawkesford et al., 2012). This fact, added to other N losses that may occur, can result in little N recovery from fertilizers, if the nutrient losses are not minimized.
Water deficits also decrease fertilizer-N recovery by
corn (Fosu-Mensah & Mensah, 2016), and this can be an important constraint for grain yield, especially in the off-season crops. In Brazil, most corn cultivations are performed during the off-season (fall–winter), and N fertilizers are commonly avoided in this season due
to their expensive cost and low efficiency. In order to
improve the cost effectiveness of N fertilizer, corn agronomic performance under different N rates during the off-season should be more studied to improve N fertilizer recommendations. In this sense, the amount of N exported through harvest, the remaining N in the soil, and the expected grain yield should all be considered to improve the recovery of N from the fertilizer and avoid soil-N depletion over time.
The objective of this work was to evaluate the effects of N fertilizer rates on corn agronomic traits and on recovery of N from the fertilizer, during the fall–winter and spring–summer crop seasons.
Materials and Methods
This research was carried out in a Latossolo Vermelho (Rhodic Hapludox), according to Santos et al. (2013), with a clayey texture and clay mineralogy constituted mainly by Al/Fe oxy-hydroxides. The experimental site is located in the municipality of Dourados, in the state of Mato Grosso do Sul, Brazil (22°13'16"S, 54°48'2"W, at 430 m altitude). Soil samples were collected (0–0.20-m depth) in January 2015,
before the establishment of the experiment, to define
the fertilizer rates and determine the soil chemical and physical properties (Claessen, 1997): 5.54 pH (CaCl2);
28.38 g dm-3 soil organic matter; 12.8 mg dm-3 P; 1.5
cmolc dm-3 K+; 5.34 cmolc dm-3 Ca2+; 2.01 cmolc dm-3
Mg2+; 6.5 cmol
c dm-3 H+Al; 0 cmolc dm-3 Al3+; 8.8 cmolc
dm-3 sum of base; 15.3 cmol
c dm-3 cations exchange
capacity; 57.7% base saturation; and 531, 249, and 220 g kg-1 clay, silt, and sand, respectively.
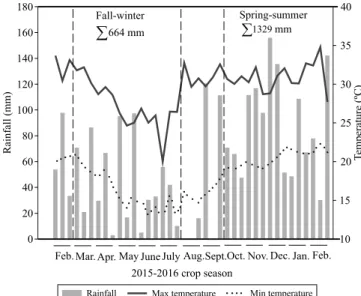
Data on rainfall and on maximum and minimum temperatures, in the experimental site, are shown in
Figure 1. In the fall–winter season, corn was cultivated
in the field from March to July 2015; and, in the spring–
summer season, from October to February (2015/2016).
According to the classification of Köppen-Geiger
(Koeppen, 1948), the region has a tropical climate (Cwa), with rainy summer and dry winter.
The experiment design was set up in a randomized complete block design, with four replicates, and the treatments were placed in a 5x2 factorial arrangement
consisting of five N top-dressing rates – 0, 30, 60, 90,
and 120 kg ha-1 –, using urea as N source, and two crop
seasons – fall–winter and spring–summer. N-fertilizer rates above 120 kg ha-1 were not tested because of their
high costs and usually low economic returns. The N rates were applied at the V5 development stage (plant
with five leaves). In order to increase the N use efficiency
and minimize the NH3–N volatilization, N-fertilizer
rates were incorporated down to 0.05 m depth, 0.10 m apart from the plant rows. The experimental units had 30 m2, and mechanized operations were performed
with a 112-HP wheel tractor.
Before the experiment implementation, the area was cultivated in a no-till system, with a rotation of soybean, in spring–summer, and corn in the fall–winter season, since October 1, 2005. The corn cultivar BR 473 was sown on February 11th, 2015, and on October
7th, 2015, in soil managed in conventional tillage. The
harvesting occurred on June 17th (fall–winter season)
and on February 6th, 2016 (spring–summer season).
Planting was performed with 6 seeds m-1, and the plant
rows were spaced at 1.00 m from each other, resulting in 60,000 plants per hectare. The fertilizer was applied at 8 cm soil depth in the seeding rows, at 16 kg N ha-1,
50 kg K2O ha-1, 50 kg P2O5 ha-1, 0.9 kg Zn ha-1, and
0.9 kg B ha-1.
Weed control was done with 0.7 L ha-1 nicosulfuron
and 3.0 L ha-1 atrazine which were sprayed on weed
in the beginning of their vegetative stage (two leaves completely opened), at corn vegetative growth (V2),
The harvest occurred on June 17th, 2015, and on
February 6th, 2016. The following variables were
determined at harvest: plant height, height of the first ear
surface to the basis of the flag leaf, in the beginning of the reproductive stage (R1), while the height of the first
ear insertion was measured from the soil surface to the primary ear node. Leaf-N and grain-N concentrations were determined following the method described by Malavolta et al. (1997), and grain-crude-protein concentration was obtained by the multiplication of grain-N concentrations by the factor 6.25.
Soil-N supply (%) was determined dividing the grain-N concentrations in the unfertilized plots (GNCu, g kg-1) by the ones in the fertilized plots (GNCf,
g kg-1). The recovery of N from the fertilizer (RNF)
was calculated following the methodology reported by Raun & Johnson (1999), according to the equation:
RNF(%)=100
(
GNCf−GNCu)
NFA; where NFA is theN-fertilizer applied rate (kg ha-1).
The variables evaluated in the experiment were subjected to the analysis of variance and, when
significant, their data were fitted to regression
equations, with the aid of SPSS software (SPSS Inc., 2007). Principal components analysis (PCA) was calculated to explain the structure of the variance and covariance in the original variables. The variance contained in each principal component (PC) is expressed by eigenvalues of the standard matrix, in which the higher eigenvalues are associated with
PC-1; the second higher eigenvalues, with PC-2; until the minor eigenvalue, which is associated with
the last PC. Therefore, the first principal component
(PC-1) explains the most variance of the original
variables. The loading significance was determined
according to Collins & Ovalles (1988), and PC loadings, or correlations between original variables
and the first two PCs, had to be greater than a selection
criterion (SC) for acceptation. The selection criterion
proposed by Collins & Ovalles (1988) was defined as
SC=0 50.
(
PC eigenvalue)
0 5. .Results and Discussion
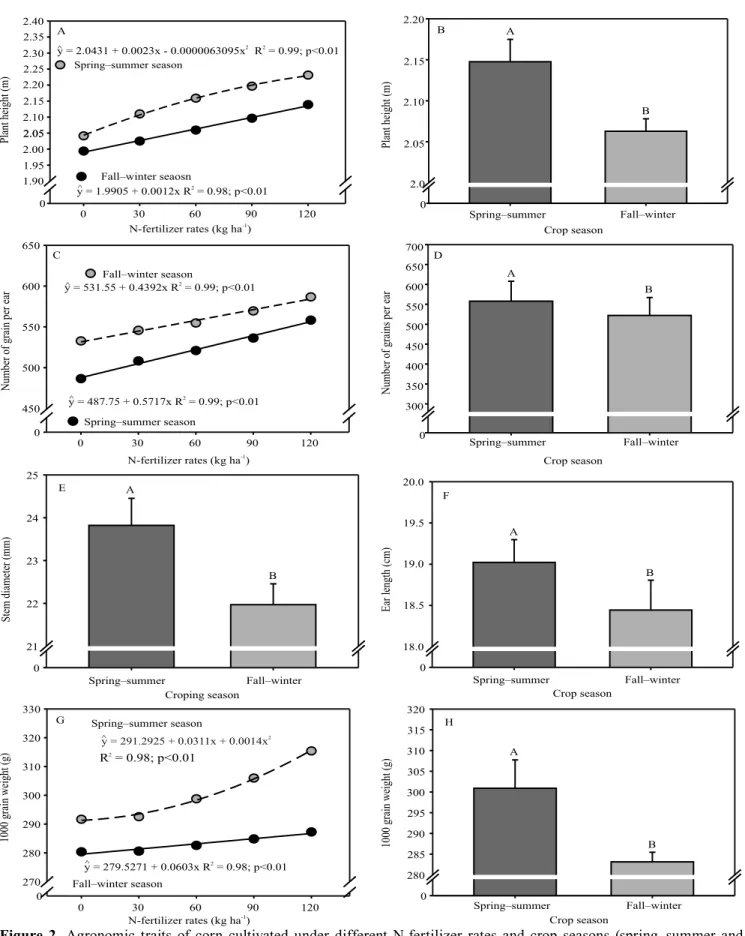
Plant height was higher in the spring–summer than in the fall–winter season, and increased with the application of N-fertilizer. The number of grains per ear was also affected by the N rates, but the crop seasons had no effect on it. However, there was effect on the stem diameter and ear length, and the spring– summer crop season resulted in higher stem diameter, ear length, and 1,000-grain weight (Figure 2).
The increase of plant growth in the spring–summer season was associated with better weather conditions of temperature andrainfall (Figure 1). The fall–winter season was relatively dry (664 mm), while the spring– summer was rainy (1,329 mm). Furthermore, worse agronomic traits were observed in the fall–winter, mostly due to the lower temperature in this period, which reduces plant growth and, consequently, the
photosynthesis efficiency (Dohleman & Long, 2009;
Bergamaschi et al., 2010; Chen et al., 2013).
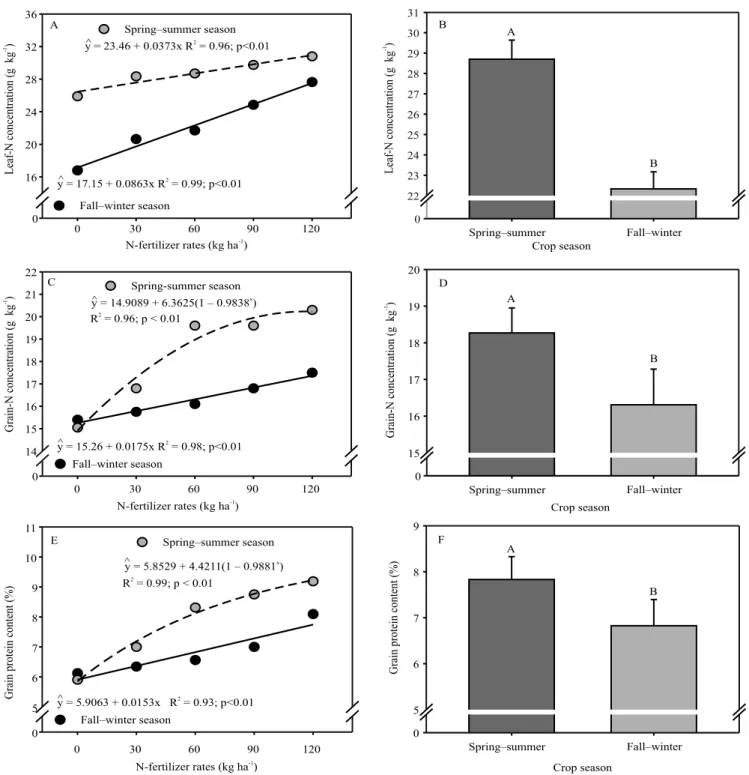
Leaf-N, grain-N and grain-protein concentrations increased with the N application rates (Figure 3), and they were all greater in the spring–summer than in the fall–winter season. Irrespective of the yield potential of the corn cultivar, decreased N supply results in proportional reduction of photosynthesis, PEP-carboxylase, and RuBisCO activities (Uribelarrea et al., 2009), which consequently decreases CO2 fixing
capacity and grain protein concentration.
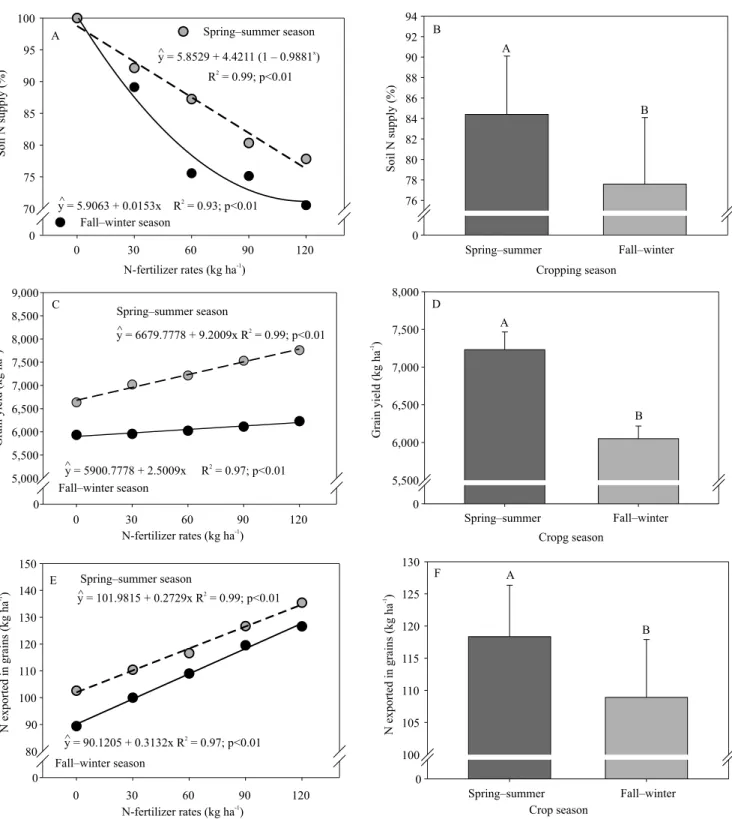
Soil-N supply reduced linearly with N-fertilizer rates, in both crop seasons (Figure 4). The evaluation of soil-N supply enabled a greater understanding of the N dynamics in the evaluated seasons, which might be useful to reduce the corn reliance on N-fertilizer rates. Most N recommendations for this crop do not take soil-N supply into consideration, which could possibly reduce the amount of N-fertilizer required by the crops.
Figure 1. Decennialrainfall, maximum and minimum air
The proportion of N uptake from the soil and accumulated in the grain decreased 23.72% with the rate of 120 kg N ha-1, in comparison to N
0. Most
of the N uptake by corn came from the soil natural supply, and less than 36.90% came from the fertilizer. Even at the high-N rate of 120 kg ha-1, the minimum
proportion of soil-N in the grain was 75%. This greater importance of soil-N supply for corn mineral nutrition agrees with those reported by Raun & Johnson (1999).
The recovery of N from the fertilizer was lower in the spring–summer than that of the fall–winter
Figure 3. Nitrogen concentrations in leaves and grains, and grain-protein content in corn cultivation subjected to different
(Table 1). In both crop seasons, the recovery of N from the fertilizer ranged from 25.99 to 36.90%, which is within the range of 20–50% generally reported for this variable (Francis et al., 1993). Corn planted in the fall–
winter season showed a greater reliance on N-fertilizer than that planted in the spring–summer. The amount of N supplied by the soil to the grains, with the N rate of 0 kg ha-1, was 89.29 kg N ha-1. Conversely, in
Figure 4. Soil-N supply, 1,000 grain weight, and grain yield of a corn cultivation subjected to different N-fertilizer rates and
the spring–summer season, it was 102.18 kg N ha-1.
Higher mineralization rates occur in the spring– summer season, which increases the N supply by the soil, and decreases the recovery of N from the fertilizer. Moreover, the higher recovery of N from the fertilizer, in the fall–winter season, can be associated with lower losses of NH3-N and NO3-N by leaching,
since the higher-soil moisture in the spring–summer (Figure 1) can increase them due to the greater water
translocation through the soil profile.
Ideal conditions for the soil organic matter mineralization (SOM) are temperatures in the soil ranging from 40 to 60ºC, soil-water capacity of 50– 70%, pH 6–7, and a good soil aeration (Potrich et al., 2014). These conditions can not be achieved in the fall–winter season in tropical climate because of the dry winter (Figure 1).
The application of 120 kg N ha-1 resulted in a 5%
increase of grain yield in the fall–winter season (Figure 4), whereas, in the spring–summer season, it grain yield increased 17%, in comparison the to absence of N-fertilizer. Grain yield in the spring– summer was 19.5% higher than in the fall–winter, which may be associated to better weather conditions (rainfall and temperature) in the spring–summer season. Nevertheless, grain yield average in the fall–winter season was greater than the Brazilian grain yield average for the off-season (5,713 kg ha-1)
(Acompanhamento…, 2016).
Corn small response to N-fertilizer rates in the
fall–winter season justifies the cultivation of this crop
without any expense with N-fertilizer, which is usually done in Brazil. However, the continue cultivation without N fertilizations may deplete SOM over time and, consequently, the soil-N supply (Davis et al., 2003). Nonetheless, the absence of N-fertilizer rates in the fall–winter season can be considered a sustainable
alternative, especially if crop rotation is applied with Leguminosae plants, which can improve the soil-N
supply due to N fixation in the spring–summer (Sainju
et al., 2016).
The exportation of N to grains increased 32.11% with the increase of N application rates from 0 to 120 kg ha-1, in the spring–summer season. In the fall–winter
season, this increase was of 41.70%. Exportation of soil-N to grains ranged from 90.12 to 101.98 kg N ha-1,
confirming that soil-N supply is the greatest N source
for corn. In all occasions, the amount of N exported to grains was greater than the applied rate of N-fertilizer . In both crop seasons, most variance in the evaluated variables could be attributed to two principal components (Table 2). Most PC loadings
were significant, according to the selection criterion defined by Collins & Ovalles (1988), except for stem diameter. The first two PC explained 57.56 and 53.82%
of the variance for the fall–winter and spring–summer seasons, respectively.
First PC in the fall–winter season was positively correlated to plant height (PH), ear length (EL), ear diameter (ED), number of grain per ear (NGE), corn grain yield (GY), 1,000-grain weight (1,000GW), leaf-N concentration (LNC), grain-N concentration (GNC), grain-protein concentration (GPC), and
Table 1. Recovery of N from fertilizer in the fall–winter
and spring–summer seasons of corn cultivation(1).
N-fertilizer rates (kg ha-1)
Recovery of N from fertilizer (%) Difference of seasons (%) Fall–winter Spring–summer
0 - -
-30 35.88Aa 27.92Ba 7.96
60 37.95Aa 23.27Ba 14.68
90 33.91Aa 27.06Ba 6.84
120 30.98Aa 28.00Aa 2.98
(1)Means followed by equal letters, lowercase in the columns and uppercase in the lines, do not differ, by Tukey’s test, at 5% probability.
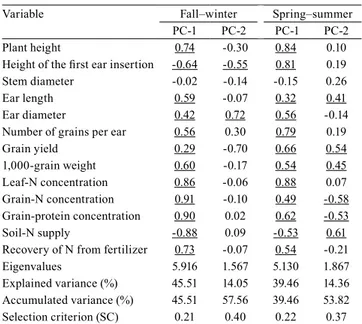
Table 2. Correlations between variables and the first
two principal components (PC) in the fall–winter and spring–summer seasons of a corn cultivation(1).
Variable Fall–winter Spring–summer
PC-1 PC-2 PC-1 PC-2
Plant height 0.74 -0.30 0.84 0.10
Height of the first ear insertion -0.64 -0.55 0.81 0.19
Stem diameter -0.02 -0.14 -0.15 0.26
Ear length 0.59 -0.07 0.32 0.41
Ear diameter 0.42 0.72 0.56 -0.14
Number of grains per ear 0.56 0.30 0.79 0.19
Grain yield 0.29 -0.70 0.66 0.54
1,000-grain weight 0.60 -0.17 0.54 0.45 Leaf-N concentration 0.86 -0.06 0.88 0.07 Grain-N concentration 0.91 -0.10 0.49 -0.58 Grain-protein concentration 0.90 0.02 0.62 -0.53
Soil-N supply -0.88 0.09 -0.53 0.61
Recovery of N from fertilizer 0.73 -0.07 0.54 -0.21
Eigenvalues 5.916 1.567 5.130 1.867
Explained variance (%) 45.51 14.05 39.46 14.36 Accumulated variance (%) 45.51 57.56 39.46 53.82 Selection criterion (SC) 0.21 0.40 0.22 0.37 (1)Underlined values had dominant PC loadings, according to the signifi
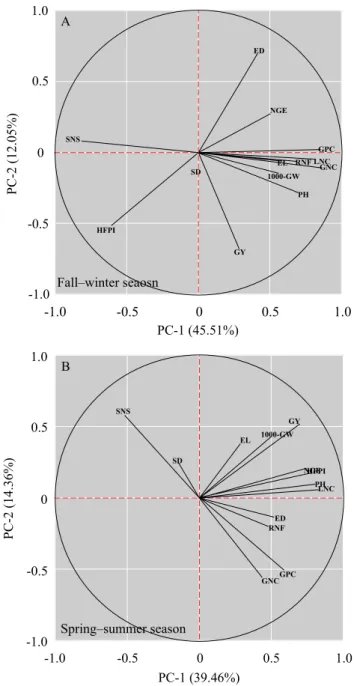
recovery of N from the fertilizer (RNF). And it was
negatively correlated to the height of first ear insertion
(HFEI) and soil-N supply (SNS) (Figure 5 A). The
first PC in the spring–summer season was positively
correlated to PH, HFEI, EL, ED, NGE, GY, 1,000GW, LNC, GNC, GP and RNF, and negatively correlated to SNS.
In the comparisons between the crop seasons, PC-1 in fall–winter and spring–summer showed similarity of variation structures among the variables, with just one exception for HFEI. However, PC-2 did not show any agreement among the variability, and was in the fall–winter season positively correlated with ED, and negatively correlated with HFEI and GY. In the spring–summer season, PC-2 showed a positive correlation with EL, GY, 1,000GW, and SNS.
Ambiguous relationships among variables are expected due to the less than 100% variability of the PC. Nevertheless, some important patterns were
observed in the first two principal components, in
both crop seasons. In the fall–winter season, PC-1 was directly related to most of the variables, and inversely
related to SNS. PCA analyses confirmed the greater
reliance of corn cultivated on the recovery of N from the fertilizer in the fall–winter season. These analyses
also confirmed that soil-N supply was lower in the
fall–winter, and that the higher-soil-N supply in the spring–summer season decreased the crop reliance on the N-fertilizer rates.
Conclusions
1. Top-dressing with N-fertilizers can be avoided in
the fall–winter season due to the absence of a profitable
response of corn grain yield.
2. The amount of N exported to corn grains is higher than the N-fertilizer rates applied, regardless of the season, since soil-N supply is the major source of the nutrient for corn.
3. In the fall–winter season, the agronomic traits of corn rely more on N-fertilizer rates than in the spring– summer season.
4. The knowledge on soil-N supply in the different crop seasons should be used to guide N-fertilizer rates for corn cultivation.
Acknowledgments
To Conselho Nacional de Desenvolvimento
Científico e Tecnológico (CNPq) and to Fundação
de Apoio ao Desenvolvimento do Ensino, Ciência e Tecnologia do Estado de Mato Grosso do Sul (Fundect/
Figure 5. Scatted diagrams for the first two principal
MS), for financial support; and to Consejo Nacional de
Ciencia y Tecnologia (Conacyt), for the scholarship to
the first author.
References
ACOMPANHAMENTO DA SAFRA BRASILEIRA [DE] GRÃOS: safra 2015/16: quarto levantamento, v.3, n.4, jan. 2016.
BERGAMASCHI, H.; DALMAGO, G.A.; BERGONCI, J.I.; KRÜGER, C.A.M.B.; HECKLER, B.M.M.; COMIRAN, F. Intercepted solar radiation by maize crops subjected to different tillage systems and water availability levels. Pesquisa Agropecuária Brasileira, v.45, p.1331-1341, 2010. DOI: 10.1590/ S0100-204X2010001200001.
BRUULSEMA, T.; LEMUNYON, J.; HERZ, B. Know your fertilizer rights. Crops and Soils, v.42, p.13-18, 2009.
CHEN, C.; BAETHGEN, W.E.; ROBERTSON, A. Contributions of individual variation in temperature, solar radiation and precipitation to crop yield in the North China Plain, 1961–2003.
Climatic Change, v.116, p.767-788, 2013. DOI: 10.1007/s10584-012-0509-2.
CLAESSEN, M.E.C. (Org.). Manual de métodos de análise de solo. 2.ed. rev. e atual. Rio de Janeiro: Embrapa-CNPS, 1997.212p. COLLINS, M.E.; OVALLES, F.A. Variability of northwest Florida soils by principal component analysis. Soil Science Society of America Journal, v.52, p.430-1435, 1988. DOI: 10.2136/sssaj1988.03615995005200050042x.
DAVIS, R.L., PATTON, J.J.; TEAL, R.K.; TANG, Y.; HUMPHREYS, M.T.; MOSALI, J.; GIRMA, K.; LAWLES, J.W.; MOGES, S.M.; MALAPATI, A.; SI, J.; ZHANG, H.; DENG, S.; JOHNSON, G.V.; MULLEN, R.W.; RAUN, W.R. Nitrogen balance in the Magruder plots following 109 years in continuous winter wheat. Journal of Plant Nutrition, v.26, p.1561-1580, 2003. DOI: 10.1081/PLN-120022364.
DOHLEMAN, F.G.; LONG, S.P. More productive than maize in the midwest: How does Miscanthus do it? Plant Physiology, v.150, p.2104-2115, 2009. DOI: 10.1104/pp.109.139162.
FOSU-MENSAH, B.Y.; MENSAH, M. The effect of phosphorus and nitrogen fertilizers on grain yield, nutrient uptake and use
efficiency of two maize (Zea mays L.) varieties under rain fed condition on Haplic Lixisol in the forest-savannah transition zone
of Ghana. Environmental Systems Research, v.5, art.22, 2016. DOI: 10.1186/s40068-016-0073-2.
HAWKESFORD, M.; HORST, W.; KICHEY, T.; LAMBERS, H.; SCHJOERRING, J.; MOLLER, I.S; WHITE, P. Functions of macronutrients. In: MARSCHNER, P. (Ed.). Marschner's mineral nutrition of higher plants. 3rd ed. Amsterdam: Elsevier,
2012. p.135-151. DOI: 10.1016/B978-0-12-384905-2.00006-6.
KOEPPEN, W. Climatología: con un estudio de los climas de la
tierra. México: Fondo de Cultura Económica, 1948. 478p.
MALAVOLTA, E.; VITTI, G.C.; OLIVEIRA, S.A. de. Princípios, métodos e técnicas de avaliação do estado nutricional. In: MALAVOLTA, E.; VITTI, G.C.; OLIVEIRA, S.A. de. (Ed.).
Avaliação do estado nutricional de plantas: princípios e aplicações. 2.ed. Piracicaba: Potafos, 1997. p.115-230.
PAN, B.; LAM, S.K.; MOSIER, A.; LUO, Y.; CHEN, D. Ammonia volatilization from synthetic fertilizers and its mitigation strategies: A global synthesis. Agriculture, Ecosystems and Environment, v.232, p.283-289, 2016. DOI: 10.1016/j.agee.2016.08.019.
POTRICH, D.C.; MARCHETTI, M. E.; POTRICH, D.C.; ENSINAS, S.C.; SERRA, A.P.; SILVA, E.F. da; SOUZA, N.H. de. Decomposição de resíduos culturais de cana-de-açúcar submetidos a diferentes doses de nitrogênio. Semina: Ciências Agrárias, v.35, p.1751-1760, 2014. DOI: 10.5433/1679-0359.2014v35n4p1751.
RAUN, W.R.; JOHNSON, G.V. Improving nitrogen use efficiency
for cereal production. Agronomy Journal, v.91, p.357-363, 1999. DOI: 10.2134/agronj1999.00021962009100030001x.
SAINJU, U.M.; LENSSEN, A.W.; ALLEN, B.L.; STEVENS, W.B.; JABRO, J.D. Nitrogen balance in response to dryland crop rotations and cultural practices. Agriculture, Ecosystems and Environment, v.233, p.25-32, 2016. DOI: 10.1016/j. agee.2016.08.023.
SANTOS, H.G. dos; JACOMINE, P.K.T.; ANJOS, L.H.C. dos; OLIVEIRA, V.A. de; LUMBRERAS, J.F.; COELHO, M.R.; ALMEIDA, J.A. de; CUNHA, T.J.F.; OLIVEIRA, J.B. de. Sistema brasileiro de classificação de solos. 3.ed. rev. e ampl. Brasília: Embrapa, 2013. 353p.
SPSS Inc. SPSS for Windows, Version 16.0. Chicago, 2007. URIBELARREA, M.; CRAFTS-BRANDNER, S.J.; BELOW,
F.E. Physiological N response of field-grown maize hybrids
(Zea mays L.) with divergent yield potential and grain protein concentration. Plant Soil, v.316, p.151-160, 2009. DOI: 10.1007/ s11104-008-9767-1.