ABCD Arq Bras Cir Dig
Original Article
2018;31(1):e1343
DOI: /10.1590/0102-672020180001e1343
DIABETES REMISSION RATE IN DIFFERENT BMI GRADES
FOLLOWING ROUX-EN-Y GASTRIC BYPASS
Taxa de remissão do diabete em diferentes IMCs após bypass gástrico em Y-de-Roux
Daniel COELHO1, Eudes Paiva de GODOY1, Igor MARREIROS1, ViniciusFernando da LUZ2, Antônio Manuel Gouveia de OLIVEIRA3,
Josemberg Marins CAMPOS4, Silvio da Silva CALDAS-NETO4, Mirella Patrícia Cruz de FREITAS1
From the 1Serviço de Obesidade e Doenças
Relacionadas, Hospital Universitário Onofre Lopes, Universidade Federal do Rio Grande do Norte, Natal, RN; 2Departamento de
Anestesiologia, Universidade Federal do Rio Grande do Norte, Natal, RN; 3Departamento de
Farmácia, Universidade Federal do Rio Grande do Norte, Natal, RN; 4Universidade Federal de
Pernambuco, Recife, PE (1Service of Obesity and
Related Diseases, University Hospital Onofre Lopes, Federal University of Rio Grande do Norte, Natal, RN; 2Department of Anesthesiology,
Federal University of Rio Grande do Norte, Natal, RN; 3Department of Pharmacy, Federal University
of Rio Grande do Norte, Natal, RN; 4Federal
University of Pernambuco, Recife, PE), Brazil
HEADINGS - Type 2 diabetes mellitus. Gastric bypass surgery. Obesity. Metabolic surgery. Non-severe obesity.
ABSTRACT - Background: Type 2 diabetes mellitus has a high long-term remission rate after laparoscopic Roux-en-Y gastric bypass (LRYGB), but few studies have analyzed patients with BMI<35 kg/m2. Aim: To compare glycemic control after LRYGB between BMI 30-35 kg/m2 (intervention group or IG) and >35 kg/m2 patients (control group or CG) and to evaluate weight loss, comorbidities and surgical morbidity. Methods: Sixty-six diabetic patients (30 in IG group and 36 in CG group) were submitted to LRYGB. Data collected annually after surgery were analyzed with generalized estimating equations. Results: Average follow-up was 4.3 years. There was no statistical difference between groups using complete remission American Diabetes Association criteria (OR 2.214, 95%CI 0.800-5.637, p=0.13). There was significant difference between groups using partial remission American Diabetes Association criteria (p=0.002), favouring the CG group (OR 6.392, 95%CI 1.922-21.260). The higher BMI group also had lower HbA1c levels (-0.77%, 95%CI -1.26 to -0.29, p=0.002). There were no significant differences in remission of hypertension, dyslipidemia and surgical morbidity, while weight was better controlled in the IG group. Conclusion: No differences were found in diabetes complete remission, although greater partial remission and the lower levels of glycated hemoglobin in the BMI >35 kg/m2 group suggest a better response among more obese diabetic patients with LRYGB. In addition, both groups had important metabolic modifications at the expense of low morbidity.
RESUMO - Racional: Diabete mellito tipo 2 apresenta alta taxa de remissão em longo prazo após derivação gástrica em Y-de-Roux (DGYR), mas poucos estudos analisaram pacientes com IMC <35 kg/m2. Objetivo: Comparar o controle glicêmico de pacientes após DGYR entre IMC 30-35 kg/m2 (grupo intervenção ou GI) e >35 kg/m2 (grupo controle ou GC) e avaliar a perda de peso, comorbidades e morbidade cirúrgica. Método: Sessenta e seis pacientes diabéticos (30 no grupo GI e 36 no GC) foram submetidos à DGYR. Dados foram coletados anualmente após a operação e analisados com equações de estimativa generalizada. Resultados: A média de seguimento foi 4,3 anos. Não houve diferença estatística entre os grupos usando critérios de remissão completa da American Diabetes Association (OR 2,214, 95%IC 0,800-5,637, p=0,13). Houve diferença significativa entre os grupos usando critérios de remissão parcial da American Diabetes Association (p=0,002), favorecendo o grupo GC (OR 6,392, 95%IC 1,922-21,260). O grupo com IMC maior também teve menores níveis de HbA1c (-0,77%, 95%IC -1,26 a -0,29, p=0,002). Não houve diferença significativa na remissão de hipertensão, dislipidemia e morbidade cirúrgica, enquanto o peso foi melhor controlado no grupo GI. Conclusão: Nenhuma diferença foi encontrada na remissão completa do diabete, embora maior remissão parcial e menores níveis de hemoglobina glicada no grupo com IMC >35 kg/ m2 sugiram melhor resposta entre diabéticos mais obesos com DGYR. Além disso, ambos os grupos tiveram importantes modificações metabólicas às custas da baixa morbidade.
Correspondence:
Daniel Coelho
E-mail: danielcirurgiadigestiva@gmail.com
Financial source: none Conflict of interest: none
Received for publication: 14/11/2017 Accepted for publication: 23/01/2018
DESCRITORES - Diabete melito tipo 2. Derivação gástrica em Y-deRoux. Obesidade. Cirurgia metabólica. Obesidade não grave.
INTRODUCTION
I
mprovement or complete remission of type 2 diabetes mellitus (T2DM) has been frequently observed with the advent of surgery for obesity. Complete remission rates of around 71.6% have been reported in studies of patients with obesity grade 2 or 3 after laparoscopic Roux-en-Y gastric bypass (LRYGB)2,24. Despite the evidence of the effectiveness of bariatric surgery in thetreatment of T2DM, its role as a primary therapeutic option for its control in grade 1 obese patients has not yet been defined. The literature regarding this patient population is based on a small number of case series, but results have been encouraging1,8,11,12,15-17,20,22,26,31.
The baseline BMI has been considered a predictive factor of T2DM control
post-LRYGB in morbid obesity patients in some publications, but prospective studies including grade I obese patients are scarce7,10,11,18,19,30. A recent meta-analysis did not find a
significant difference in remission rates between diabetics with BMI less than 35 kg/m2 and BMI of 35 kg/m2 or more28.
There are only two prospective studies comparing LRYGB with differing BMI groups including BMI below 35 kg/m2,
and no significant differences were found26,29.Almost all
these articles describe Asian patients, so the results may not be the same in Western countries.
The objective of this study was to compare glycemic control by analyzing complete remission rate, partial remission rate and rate of insulin use after LRYGB in grade I obese patients and in grade II or III obese individuals from Brazil and also to analyze weight loss, modification in associated metabolic co-morbidities and surgical morbidity.
METHOD
The data was collected prospectively from 66 patients with T2DM who underwent LRYGB from January 2006 to December 2014 retrospectively analyzed.This study was approved by the Research Ethics Committee of Hospital Onofre Lopes, with no requirement for informed consent. Some of these patients had been included in a previous prospective study on LRYGB treatment of T2DM patients with BMI between 30-35 kg/m2. Diagnostic criteria of
T2DM were according to American Diabetes Association consensus5. Patients were included if they were between
18- 65 years-old, both genders, had been submitted to LRYGB surgery and had a diagnosis of T2DM at least two years before surgery. The participants were divided into two groups based on initial body mass index (BMI): lower (BMI <35 kg/m2, intervention group or IG), with 30
patients, and higher (BMI >35 kg/m2, control group or CG),
with 36 patients. In addition, patients with BMI <35 kg/m2
were tested for anti-Gad and anti-islet autoimmunity and excluded if any of the tests were positive.
All patients underwent the same technique of LRYGB by a group of three experienced laparoscopic bariatric surgeons. A 20 ml gastric pouch was created using three cartridges of blue 45 mm laparoscopic linear staplers. A 100 cm biliopancreatic limb and a 150 cm antecolic alimentary limb were formed. Two single layer anastomoses were manually made. Patients were encouraged to ambulate early and were fed a liquid diet on the first postoperative day if there were no complications. They were discharged on the second if they mentioned no symptoms and glycemia levels were controlled. Intraoperative and/or postoperative insulin pump was installed according to the capillary blood glucose and changes in infusion were performed according to the evolution.
The primary outcome was T2DM remission according to the ADA criteria3, fasting blood glucose (FBG) <100 mg/
dl and hemoglobin A1c (HbA1c)<6.0% without medication. Partial T2DM remission was defined as FBG <125 mg/dl and HbA1c<6.5% without medication. Data were obtained at follow-up visits on anthropometric measures including weight, BMI, total weight loss (TWL), excessive residual weight (ERW) and excessive weight loss (%EWL), and biochemical variables were determined, including FBG, HbA1c, total cholesterol (TC), LDL-cholesterol (LDL), HDL-cholesterol (HDL) and triglycerides (TG). HbA1c was measured by immunoturbidimetry. Both HbA1c and FBG were used to adjust medication.
Statistical analysis
Data are expressed as absolute and relative frequencies or mean±SD, as appropriate. Baseline characteristics of groups were compared using Student’s t-test and the Chi-square test or Fisher’s exact test. For the comparison of groups over time, a GEE model with an AR1 correlation structure
and robust standard errors was used. For the analyses of T2DM remission and partial remission, the binomial family and the logic link were used; for all remaining variables the Gaussian family and the identity link were used. All analyses were adjusted by gender, age at the time of surgery and the baseline value of the dependent variable. For HbA1c and FBG, the analyses were further adjusted by the natural logarithm of the duration of diabetes and by medication use. FBG, TC, HDL, TG, weight, ERW and TWL were log-transformed to obtain normal distributions. Results were presented as point estimates and 95% confidence intervals (CI) of the odds ratio of CG to IG for T2DM remission, of the ratio of CG/IG for log-transformed variables, and of the difference CG-IG for variables in linear scale. Statistical significance was assumed at a two-tailed p-value of less than 0.05. Statistical analysis was performed with the Stata release 11 software (Stata Corporation, College Station, TX, USA).
RESULTS
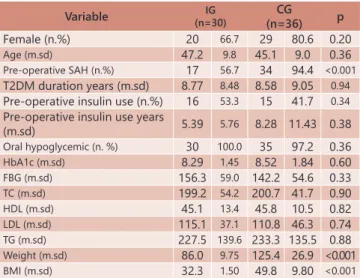
Sixty-six patients were included in this study, 30 with a BMI<35 kg/m2 and 36 >35 kg/m2. Baseline data are shown in
Table 1. The groups were fairly similar in all variables except that the group with greater BMI had higher prevalence of arterial hypertension in addition to increased weight, BMI and excessive weight loss. The duration of follow-up was similar between groups: 4.32±1.78 years in IG and 4.34±2.06 years in CG (p=0.97).
TABLE 1 - Baseline characteristics of two groups
Variable (n=30)IG CG
(n=36) p
Female (n.%) 20 66.7 29 80.6 0.20
Age (m.sd) 47.2 9.8 45.1 9.0 0.36
Pre-operative SAH (n.%) 17 56.7 34 94.4 <0.001
T2DM duration years (m.sd) 8.77 8.48 8.58 9.05 0.94
Pre-operative insulin use (n.%) 16 53.3 15 41.7 0.34
Pre-operative insulin use years
(m.sd) 5.39 5.76 8.28 11.43 0.38
Oral hypoglycemic (n. %) 30 100.0 35 97.2 0.36
HbA1c (m.sd) 8.29 1.45 8.52 1.84 0.60
FBG (m.sd) 156.3 59.0 142.2 54.6 0.33
TC (m.sd) 199.2 54.2 200.7 41.7 0.90
HDL (m.sd) 45.1 13.4 45.8 10.5 0.82
LDL (m.sd) 115.1 37.1 110.8 46.3 0.74
TG (m.sd) 227.5 139.6 233.3 135.5 0.88
Weight (m.sd) 86.0 9.75 125.4 26.9 <0.001
BMI (m.sd) 32.3 1.50 49.8 9.80 <0.001
SHA=systemic arterial hypertension; BMI=body mass index; FBG=fasting blood glucose; TC=total cholesterol; LDL=low-density lipoprotein cholesterol; HDL=high-density lipoprotein cholesterol; TG=triglyceride; T2DM=type 2 diabetes mellitus
There was no significant difference between groups in
ADA complete remission: the odds ratio of remission in CG vs. IG was 2.214 (95% CI 0.800-5.637, p=0.13). However, the
partial remission rate was significantly higher (p=0.002) in
CG (O.R 6.392, 95%CI 1.922-21.260). HbA1c levels over time
were significantly different between groups, with levels in CG
on average 0.77% lower (95% CI -1.26% to -0.29%, p=0.002).
There was no difference in the rate of insulin use before and
There was no difference between groups in the other
biochemical parameters (Table 2).
TABLE 2 - Differences over time between groups in biochemical variables
Variable n Difference IC 95% p
HbA1c % 49 -0.769 -1.251 -0.287 0.002
FBG dif % 52 93.1 83.3 104.2 0.21
TC dif % 48 95.4 86.1 105.8 0.37
HDL dif % 37 92.3 84.3 101.0 0.08
LDL mg/dl 23 -9.04 -28.57 10.48 0.36
TG dif % 37 93.7 80.0 109.7 0.42
All analyses adjusted gender, age and variable initial evaluation. HbA1c and FBG further adjusted by log T2DM duration and use of medication. Log transformation for FBG, TC, HDL and TG. FBG=fasting blood glucose; TC=total cholesterol; LDL=low-density lipoprotein cholesterol; HDL=high-density lipoprotein cholesterol; TG=triglyceride; dif%=CG average/IG average x 100
There was a statistically significant difference in the excessive weight loss between groups (p>0.05), with total weight loss (TWL) higher in CG (p<0.001, Table 3), but there
were no severe nutritional deficiencies in either group. At last
evaluation, no patients in IG had obesity while 86.1% of patients in CG continued having some degree of obesity.
TABLE 3 - Differences over time between groups in anthropometric variables
Variable n Difference IC 95% p
Weight dif % 54 103.4 93.1 114.9 0.53
TWL % 57 20.7 13.1 28.3 <0.001
ERW dif % 52 106.4 96.0 268.0 0.07
% EWL % 57 -0.08 -0.20 0.05 0.22
% ERW % 57 0.08 -0.05 0.20 0.22
Weight variation kg 57 0.093 0.051 0.136 <0.001
BMI dif % 54 109.1 96.0 123.9 0.18
All analysis adjusted by gender and age. Weight, ERW and BMI further adjusted by the logarithm of baseline value. Weight, ERW and BMI were log transformed. dif %=average CG/average IG x 100; TWL=total weight loss; ERW=excessive residual weight; EWL=excessive weight loss
There was no mortality in either group. There was no
significant difference between the groups related to the main
surgical complications (Tables 4 and 5).
TABLE 4 - Surgical complication rates
Complication Group BMI <35 Group BMI>35 p
(n=30) (n=36)
Leakage 1 3 0.62
Bleeding 0 0
-Myocardial infarction 0 1 1
Anastomosis stenosis 1 3 0.62
Sepsis 2 1 0.58
Hypertensive crisis 0 1 1
PE 0 1 1
Total complications 4 10 0.22
BMI=body mass index; PE=pulmonary embolism
TABLE 5 - Consequences of morbidity
Complication Group BMI<35 Group BM >35 p
(n=30) (n=36)
ICU admission 4 8 0,54
Reoperation 3 3 1
Readmission 7 11 0.7
BMI=body mass index; ICU=Intensive Care Unit
DISCUSSION
This study found differences between the groups in T2DM remission according to the partial ADA criteria and no difference in complete remission3. Remission rates can
vary widely depending on the criteria used. For example, remission rates according to ADA criteria are very different than rates published previously by Buchwald in their meta-analysis23. Recent studies have shown lower remission rates
when the ADA criteria are used, reaching about 40%, lower than the rates presented in previous studies5,25. Despite
the ongoing discussion about the real usefulness of the ADA remission criteria27, they still remain the most popular
among studies. This study showed somewhat lower levels of remission in both groups, which can be explained by different follow-up times or severity of disease. Despite the statistically significant difference between groups in HbA1c levels on follow-up, the complete remission criteria did not show difference between groups, possibly because the study was underpowered. Persistent obesity in CG could also explain this difference, by maintaining a greater insulin resistance in this group, “not appearing” in the more stringent complete remission criteria due to underpower, while “being evident” in the partial remission rate and HbA1c differences. Alternatively, a lower partial remission rate and higher glycated hemoglobin levels in the group with lower BMI could be interpreted as evidence of more severe residual disease in patients who did not achieve complete remission. All patients in this group had BMI <30 in the last evaluation, which could lead to adequate control of insulin resistance, so more serious residual disease could be a consequence of worse function of beta cells. Unfortunately, insulin resistance was not measured in this study.This was retrospective, but there are only two comparative prospective studies about this subject: one covered only three patients in the BMI below 35 kg/m2 group and the other study found no difference
in T2DM remission rates between groups after 36 months of follow-up26,29. This last study, with a method similar to
ours, included 20 patients in the group with BMI <35 kg/ m2, found a difference in complete remission rates in 12
and 24 months and no difference using partial remission in all follow-up intervals, the exact opposite to these results. However, that difference in complete remission rate was not found at the end of follow-up at 36 months. That study had much higher remission rates in the morbidly obese patients than this one and can explain this difference in results. Another study compared mini gastric bypass between different degrees of BMI and found no statistically significant difference in remission rates. However, there are limitations for traditional bypass comparison by the peculiarities of this surgical technique21.
In a recent review, Ngiam KY et al.24 used the change
avoiding terminology such as postoperative“cure”. Instead, the main result should be the extent of the real benefit of good glycemic control in these patients15.
Most patients in our sample had advanced T2DM, as characterized by long periods of preoperative T2DM, the frequency of insulin use and high preoperative average FBG levels and HbA1c. One of the most frequently cited factors as a predictor of T2DM remission is its preoperative duration6. However, our analyses were adjusted to control
for differences between groups in all those variables. Although controversial, postoperative glycemic control has been related to the amount of weight loss in morbidly obese patients. Some studies have found an association9,14 and others no association4,13. Lakdawala M et
al, studying obese grade I patients, found the weight loss to be a predictive factor of diabetes control in this group of patients15. Additionally, Chikunguwo SM found weight
regain to be related to T2DM recurrence studying morbidly obese patients4. The evidence suggests that weight loss has
some role in diminishing peripheral insulin resistance and it can have some implication while comparing groups with diverse initial BMI. Patients with higher BMI lost higher total adipose tissue during the same period, as demonstrated by the different weight loss between the groups. However the proportional weight loss (%EWL) values were similar and it is not known which weight loss is more closely related with peripheral insulin resistance decrease, if absolute or relative. This can be a reason for different response between the groups when hypothetically, CG should have had milder diabetes, “masked” by a higher peripheral insulin resistance, which disappeared after surgery, or higher adipose loss, explaining the better results found in CG. This could be a bias related to comparing similar groups before surgery, but not equal in all aspects.
We found no difference in the control of hypertension or dyslipidemia between the groups. The same result was reported21, but there is scarce information on patients
with lower BMI because the focus in these studies is on diabetes remission. We see no reasonable explanation for any difference in the rates of control of dyslipidemia between the groups. However, the absence of difference in hypertension remission rates is possibly due to lack of statistical power, because the BMI >35 kg/m2 group had a
higher preoperative hypertension rate since surgery should be more effective in control of this co-morbidity in this group than in the BMI <35 kg/m2 group.
This study was a retrospective analysis of prospectively collected data based on a small sample and presenting mid-term results. However, it was comparative and included patients operated in the same period by the same group of surgeons. Therefore, despite its limitations, the results are possibly more realistic than non-comparative, short-term results published in most of the previous series.
Studies of specific subgroups and outcomes more directly related to cardiovascular events and long-term mortality and compared to the best possible clinical treatment are necessary, offering safe identification of the best candidates for surgical treatment.
CONCLUSION
There were better results in diabetes control in group with BMI >35 kg/m2 comparing with patients with BMI between
30 and 35 kg/m2 reflected by better partial remission rate
and glycated hemoglobin levels. These differences could be
explained by more severe residual post-surgical diabetes.
Both groups had significant impact in diabetes control with
low morbidity, highlighting the potential of this treatment in patients with lower BMI.
REFERENCES
1. Boza C, Munoz R, Salinas J, Gamboa C, Klaassen J, Escalona A, et al. Safety and efficacy of Roux-en-Y gastric bypass to treat type 2 diabetes mellitus in non-severely obese patients. Obes Surg [Internet]. 2011;21(9):1330–6. 2. Buchwald H, Avidor Y, Braunwald E, Jensen MD, Pories W, Fahrbach K, et al. Bariatric surgery: a systematic review and meta-analysis. JAMA [Internet]. 2004;292(14):1724–37.
3. Buse JB, Caprio S, Cefalu WT, Ceriello A, Del Prato S, Inzucchi SE, et al. How do we define cure of diabetes? Diabetes Care [Internet]. 2009;32(11):2133–5.
4. Chikunguwo SM, Wolfe LG, Dodson P, Meador JG, Baugh N, Clore JN, et al. Analysis of factors associated with durable remission of diabetes after Roux-en-Y gastric bypass. Surg Obes Relat Dis [Internet]. 2010;6(3):254–9. 5. Diagnosis and classification of diabetes mellitus. Diabetes Care [Internet].
2010;33 Suppl 1:S62–9.
6. Dixon JB, Chuang LM, Chong K, Chen SC, Lambert GW, Straznicky NE, et al. Predicting the Glycemic Response to Gastric Bypass Surgery in Patients With Type 2 Diabetes. Diabetes Care [Internet]. 2012; Available from: http://www.ncbi.nlm.nih.gov/pmc/articles/PMC3526207/pdf/20.pdf 7. Dixon JB, Hur K-Y, Lee W-J, Kim M-J, Chong K, Chen S-C, et al. Gastric bypass in Type 2 diabetes with BMI < 30: weight and weight loss have a major influence on outcomes. Diabet Med [Internet]. 2013 Apr;30(4):e127–34. 8. Fellici AC, Lambert G, Lima MM, Pareja JC, Rodovalho S, Chaim EA, et al. Surgical treatment of type 2 diabetes in subjects with mild obesity: mechanisms underlying metabolic improvements. Obes Surg [Internet]. 2015;25(1):36–44.
9. Hamza N, Abbas MH, Darwish A, Shafeek Z, New J, Ammori BJ. Predictors of remission of type 2 diabetes mellitus after laparoscopic gastric banding and bypass. Surg Obes Relat Dis [Internet]. 2011;7(6):691–6. 10. Hayes MT, Hunt LA, Foo J, Tychinskaya Y, Stubbs RS. A model for predicting
the resolution of type 2 diabetes in severely obese subjects following Roux-en Y gastric bypass surgery. Obes Surg [Internet]. 2011;21(7):910–6. 11. Huang CK, Shabbir A, Lo CH, Tai CM, Chen YS, Houng JY. Laparoscopic Roux-en-Y gastric bypass for the treatment of type II diabetes mellitus in Chinese patients with body mass index of 25-35. Obes Surg [Internet]. 2011;21(9):1344–9.
12. Huang CK. [Effectiveness and safety of laparoscopic Roux-en-Y Gastric bypass in treating type 2 diabetes mellitus in non-morbidly obese patients]. Zhongguo Yi Xue Ke Xue Yuan Xue Bao [Internet]. 2011;33(3):272–6. 13. Jurowich C, Thalheimer A, Hartmann D, Bender G, Seyfried F, Germer
CT, et al. Improvement of type 2 diabetes mellitus (T2DM) after bariatric surgery--who fails in the early postoperative course? Obes Surg [Internet]. 2012;22(10):1521–6.
14. Kadera BE, Lum K, Grant J, Pryor AD, Portenier DD, DeMaria EJ. Remission of type 2 diabetes after Roux-en-Y gastric bypass is associated with greater weight loss. Surg Obes Relat Dis [Internet]. 2009;5(3):305–9. 15. Lakdawala M, Shaikh S, Bandukwala S, Remedios C, Shah M, Bhasker AG.
Roux-en-Y gastric bypass stands the test of time: 5-year results in low body mass index (30-35 kg/m(2)) Indian patients with type 2 diabetes mellitus. Surg Obes Relat Dis [Internet]. 2013;9(3):370–8.
16. Lanzarini E, Csendes A, Gutierrez L, Cuevas P, Lembach H, Molina JC, et al. Type 2 diabetes mellitus in patients with mild obesity: preliminary results of surgical treatment. Obes Surg [Internet]. 2013;23(2):234–40. 17. Lee WJ, Chong K, Chen CY, Chen SC, Lee YC, Ser KH, et al. Diabetes
remission and insulin secretion after gastric bypass in patients with body mass index <35 kg/m2. Obes Surg [Internet]. 2011;21(7):889–95. 18. Lee WJ, Chong K, Chen JC, Ser KH, Lee YC, Tsou JJ, et al. Predictors of diabetes remission after bariatric surgery in Asia. Asian J Surg [Internet]. 2012;35(2):67–73.
19. Lee WJ, Hur KY, Lakadawala M, Kasama K, Wong SK, Chen SC, et al. Predicting success of metabolic surgery: age, body mass index, C-peptide, and duration score. Surg Obes Relat Dis [Internet]. 2013;9(3):379–84. 20. Lee WJ, Hur KY, Lakadawala M, Kasama K, Wong SK, Lee YC. Gastrointestinal
metabolic surgery for the treatment of diabetic patients: a multi-institutional international study. J Gastrointest Surg [Internet]. 2012;16(1):45–51; discussion 51–2.
21. Lee WJ, Wang W, Lee YC, Huang MT, Ser KH, Chen JC. Effect of laparoscopic mini-gastric bypass for type 2 diabetes mellitus: comparison of BMI>35 and <35 kg/m2. J Gastrointest Surg [Internet]. 2008;12(5):945–52. 22. Li Q, Chen L, Yang Z, Ye Z, Huang Y, He M, et al. Metabolic effects of
bariatric surgery in type 2 diabetic patients with body mass index < 35 kg/m2. Diabetes Obes Metab [Internet]. 2012 Mar;14(3):262–70. 23. Mas-Lorenzo A, Benaiges D, Flores-Le-Roux JA, Pedro-Botet J, Ramon
JM, Parri A, et al. Impact of different criteria on type 2 diabetes remission rate after bariatric surgery. Obes Surg [Internet]. 2014;24(11):1881–7. 24. Ngiam KY, Lee WJ, Lee YC, Cheng A. Efficacy of metabolic surgery on
25. Pournaras DJ, Aasheim ET, Sovik TT, Andrews R, Mahon D, Welbourn R, et al. Effect of the definition of type II diabetes remission in the evaluation of bariatric surgery for metabolic disorders. Br J Surg [Internet]. 2012;99(1):100–3.
26. Proczko-Markuszewska M, Stefaniak T, Kaska L, Sledzinski Z. Early results of Roux-en-Y gastric by-pass on regulation of diabetes type 2 in patients with BMI above and below 35 kg/m2. Pol Przegl Chir [Internet]. 2011;83(2):81–6.
27. Ramos-Levi A, Sanchez-Pernaute A, Matia P, Cabrerizo L, Barabash A, Hernandez C, et al. Diagnosis of diabetes remission after bariatic surgery may be jeopardized by remission criteria and previous hypoglycemic treatment. Obes Surg [Internet]. 2013;23(10):1520–6.
28. Ramos-Levi AM, Matia P, Cabrerizo L, Barabash A, Sanchez-Pernaute A, Calle-Pascual AL, et al. Statistical models to predict type 2 diabetes remission after bariatric surgery. J Diabetes [Internet]. 2014;6(5):472–7.
29. Xu L, Yin J, Mikami DJ, Portenier DD, Zhou X, Mao Z. Effectiveness of laparoscopic Roux-en-Y gastric bypass on obese class I type 2 diabetes mellitus patients. Surg Obes Relat Dis [Internet]. 2015;
30. Yin J, Xu L, Mao Z, Zhou X, Zhu Z, Chen X, et al. Laparoscopic Roux-en-Y Gastric Bypass for Type 2 Diabetes Mellitus in Nonobese Chinese Patients. Surg Laparosc Endosc Percutan Tech [Internet]. 2014; Available from: http://dx.doi.org/10.1097/sle.0000000000000068