A Work Project, presented as part of the requirements for the Award of a Masters Degree in Management from the NOVA – School of Business and Economics.
EDP InovCity: Electricity Feedback with Smart Meters through TV
João da Gama Cidraes Machado da Franca Masters Student Number 740
A Project carried out on the Strategy course, under the supervision of: Professor Luis Catela Nunes
2 Abstract
In this work project I propose an innovative service – Electricity Feedback with Smart Meters through TV – to be considered as an additional test in the residential electricity use feedback trials currently being conducted in EDP’s InovCity project. My proposal is based on relevant past and current research studies, both Portuguese and international, which explain and support the proposed operationalization and characteristics of this new service. Furthermore, a careful analysis about the segmentation framing, the best market entry strategy and the consequences of adopting a joint venture with cable TV operators, is also provided. Finally, I present a SWOT analysis and highlight critical issues affecting the effectiveness of feedback which require further research.
Keywords TV
Smart meter Feedback
3 Index
1. Introduction Page 4
2. Methodology Page 6
2.1 Review of Past and Current Feedback Trials Page 6
3. Proposal Page 11
3.1 Product/service operationalization and characteristics Page 13
3.2 Survey Results Page 16
3.3 Segmentation Page 18
3.4 Joint Venture/Strategic alliance Page 19
3.5 SWOT Analysis Page 20
4. Conclusion Page 23
5. References Page 26
4 1. Introduction
According to the Electric Power Research Institute (EPRI) on its Guidelines for Designing Effective Energy Information Feedback Pilots: Research Protocols,
nowadays we are living in an era where Smart Grid technologies have been revolutionizing and gaining space in the electricity industry. Moreover, this rapidly increasing technology grants customers with enhanced and timely information about their electricity consumption levels and costs.
So, in 2010 EDP Distribuição – the designated energy distribution operator in Portugal –, launched a new project named InovCity, which consists in a pilot project to test the differences in overall community consumption, by combining the adoption of a smart grid infrastructure with the introduction of smart meters. This project is currently in trials in the city of Évora, which aims to serve 31,000 householders by providing to each home an energy box to measure the energy consumption in a real-time frame. Besides providing the current and continuous feedback of electricity utilization, other objectives of this program are: data transmission through a computer or in-home displays; a better integration of renewable energies and electrical vehicles; or a greater capacity to spot and solve flaws or any problem in the energy supplying network.
EDP Distribuição saw the use of these new technologies as a “vehicle” to eliminate some inefficiency problems and, at the same time, modernize its line of products and services:
1- the company and householders would be able to track the information about customers’ consumption patterns in the low voltage network;
2- problems occurring in the network could be rapidly noticed and solved electronically, not only when clients complained or informed the company.
In what concerns the “audience”, the introduction of such technologies in both residential and business customers’ properties brings them the ability to make current
5 and frequent evaluations about their electricity consumption, thus, it is a demanding tool
for wiser and more informed decisions about their expenditure patterns. Also, it may be considered as a possibility to become an energy micro-producer, bringing additional income to those willing to take advantage on that activity.
Nowadays, the InovCity’s project is carrying some trials which consist in implementing and testing new equipments (such as real-time displays, also known as tablets) and services (e.g. consumption warnings and advices, or tariff simulations to compare with those commonly used with the “old fashion” meters). However, since this is a pilot project, there is still “room” available to introduce new products/services.
In this way, the purpose of this work project is to develop a concrete proposal for EDP, so that the company faces it as a possibility to be included in InovCity’s further trials, always with the intent to improve the results and solve some remaining problems. In order to present such solution, I will provide international and national researches that sustain the success of the proposal I am recommending. Additionally, I will carefully introduce the characteristics I consider essential to be part of the new product or service, as well as evaluate its pros and cons against the ones already used in trials, plus the consequences it will bring to the company as a whole.
6 2. Methodology
This section will be used to support the choice of a new product or service for EDP’s InovCity project, by presenting international research findings on the usage of feedback to enhance energy savings. Therefore, I will use the results from the EPRI study on
Residential Electricity Use Feedback: A Research Synthesis and Economic Framework
and the AECOM’s Energy Demand Research Project: Final Analysis (EDRP). I will end this chapter by mentioning which InovCity’s intervention products are currently used to have a clearer insight on what can be changed and what must be kept in the new proposal.
2.1 Review of Past and Current Feedback Trials
I will begin developing this section by focusing on the EPRI report. The choice behind it can be explained by the fact that this report presents a valuable survey, as it collects all the data from the most recent international studies about the smart meters’ topic, besides offering a methodological framework which facilitates the comprehension on how feedback is important to enhance energy conservation.
EPRI’s report focuses on the household electricity consumption demand and feedback, and their relationship from two different perspectives: behavioral processes dimension and an economic framework (for the purposes and objectives of this work project I will dismiss the interpretation of the economic framework).
In its study, EPRI analyzed several past studies to assess the effectiveness of feedback as a measure to induce residential electricity savings. To better understand the findings and conceptualization of this research, feedback can be defined as “the transmission of evaluative or corrective information about an action, event, or process to the original or controlling source” (Feedback 2009). This report, which focuses on the residential sector, further defines feedback as household-specific electricity consumption
7 information. In order to be effective in encouraging a conservation behavior, feedback
needs to “show that actual conservation is below the level the person wants to achieve” (Seligman et al., 1981, p. 105), which means people need some sort of goal to “accept” the feedback’s effect. The same authors also points out that “feedback has a motivational effect because it leads people implicitly or explicitly to set goals for themselves that they then try to achieve” (Seligman et al., 1981, p. 104), referring that even if the goal is not explicit, feedback may lead consumers to choose an involuntary reference to achieve their objectives.
Other researchers (van Raaij and Verhallen 1983), however, refer that feedback efficiency results from a Three Stage Process (see Figure 1). In the first stage – Learning phase –, consumers understand and perceive what are their consumption patterns and depending on the effectiveness and “quality” of feedback, they become aware on how their specific actions affect their consumption levels. The second step, or the Habit Formation phase, households start little by little changing their action behaviors – at a first glance to test the effects of feedback and then, over time, to keep a low consumption level – and eventually those changes may carry on and becoming a habit, even if afterwards feedback is removed. According to Darby, a behavior sustained for a period over 3 months will become habit (Darby 2006). In the last phase, Internalization of Behavior, once the behavior of saving energy becomes a habit, users tend also to change and adapt their attitude to this new trend. However, this conceptual model may not be applied to other habit change measures (like economic incentives) after withdrawal feedback (van Raaij and Verhallen 1983 and Katdev and Johnson 1987).
EPRI’s report also introduces a categorization methodology with six different categories to transmit consumer’s feedback, from which the first four are related to indirect
8
feedback – occurs after consumption – and the other two are recognized as direct feedback – provided in real-time or near real-time (Darby 2000):
1- Standard-billing – traditional invoice using monthly kWh, corresponding cost, other charges and the amount due. It is an effective billing because it lacks comparative statistics or any detailed information about the temporal aspects of consumption; 2- Enhanced billing – monthly energy report that uses comparative statistics, such as
between the current month’s expenditures and kWh consumption to those of other months or cumulative and year-to-date statistics. Average energy conservation effect from 7 previous studies shows a reduction of 9%;
3- Estimated feedback – statistical techniques to disaggregate total bill into a detailed invoice by major appliances and devices, and can be provided as a one-off report or as an ongoing service. Average energy conservation effect from 2 previous studies shows a reduction of only 4%;
4- Daily or weekly feedback – self-read reports by customers or daily/weekly consumption reports provided by the energy supplier. Average energy conservation effect from 5 previous studies shows a reduction of 8%;
5- Real-time feedback – requires the use of a real-time display (RTD), which shows consumption level related to the corresponding cost ($/kWh rate), and some even show visual cues when prices reach a specific level. Average energy conservation effect from 12 previous studies shows a reduction of 7%;
6- Real-time plus – systems that illustrate the electricity consumption disaggregated by appliance type, over historic periods (daily, weekly or monthly), and the usage is expressed in kWh, $ or CO2 emissions. It is possible to remotely activate any device and control them via Internet from PCs, handheld services or mobile phones.
9 Average energy conservation effect from 5 previous studies shows a reduction of
12%;
From a generic perspective of the referred studies, one perceive the difference between indirect and direct feedback is that the first type methods are simpler, thus less expensive (in terms of technology used), nevertheless they may catch the interest and awareness from users with savings going up to 10%, but this type of feedback may not be enough if used alone. On the other hand, real-time feedback seems to be much more complex and effective, though more expensive. In fact, results show an energy conservation ranging between 5-15% (Darby 2006).
To conclude, the EPRI research summarizes the past studies’ achievements (Darby 2000, Fischer 2007, IPSOS Mori 2007, Abrahamse et al., 2005) and shows some insights that feedback is also more effective when: it is provided frequently and as soon after the consumption behavior as possible; it is clearly and simply presented; it is customized to the household’s specific circumstances; it is provided relative to a meaningful standard of comparison; it is provided over an extended period of time; includes appliance-specific consumption breakdown (some studies); it is interactive (some studies). Consequently, my choice for a new product or service will rely on providing a direct feedback support, so that the information transmitted leads to higher energy conservation values.
Another study used to support my decisions is EDRP. It is a study conducted recently in Great Britain to assess the impact on customers’ behaviors when providing different evaluations about their energy consumption. To do so, AECOM used four different energy suppliers (EDF, E.ON, Scottish Power and SSE) to perform the tests, between 2007 and 2010, with the introduction of 10 different interventions distributed by 60,000 households, from which 18,000 were tested with smart meters. It is also important to
10 mention that the samples’ size is great enough to assure the tests results’ significance,
even more when the study was evaluated and audited by several remarkable institutions, whose results are public, as well as the fact that based on those results a national roll-out has been made. In this study, the most relevant findings of each intervention with and without smart meters were:
Energy efficiency advice and historic feedback (on paper or TV/web-based) – two different interventions but with similar results. Energy savings were up to 5% in both cases and they were more effective when provided simple, with short statements and over a period of time, as well as when combining with an RTD;
Benchmarking – only used in the SSE trial and without smart meters or RTDs. Energy consumption reduction was about only 1%, although, it was perceptible that those who consume less than the benchmark group tend to increase consumption;
Customer engagement using commitment to reduce consumption – this intervention did not affect consumption, however savings increased as customers became aware of the trial;
Smart meters – EDF and E.ON’s tests show that a smart meter can only by itself lead to consumption reduction. However, as seen in EDF’s trial, customers argued they could benefit more if engagement and information provision were better given when installing the meters;
RTD devices – just by itself, an RTD could increase savings up to 3%, though the results might double or triple if used with other smart meter interventions (7% with advice incentives in EDF trial). Surveys show that households value more cost information than kW and that CO2 emissions are not useful. Also, portability and spending features by device were seen as real benefits to save energy;
11 Heating controller integrated with RTD – no modification in electricity consumption
was verified;
Time of use tariff/incentive – consumers were encourage to deviate from the periods of peak demand (more expensive ones). The habit shift was more intensive in weekends and the total change effect was up to 10%, specially in smaller households (1 or 2 people) and where information was more clear and simple;
Web-based interventions – it has potential benefits, however none of the trials could spot and measure any energy reduction, probably due to lack of engagement with the websites by users.
In what concerns the usage of TV to pass on energy feedback, general EDF’s trial results show an energy consumption reduction of 5.6% during the first year and that only the first two information screens tended to be used.
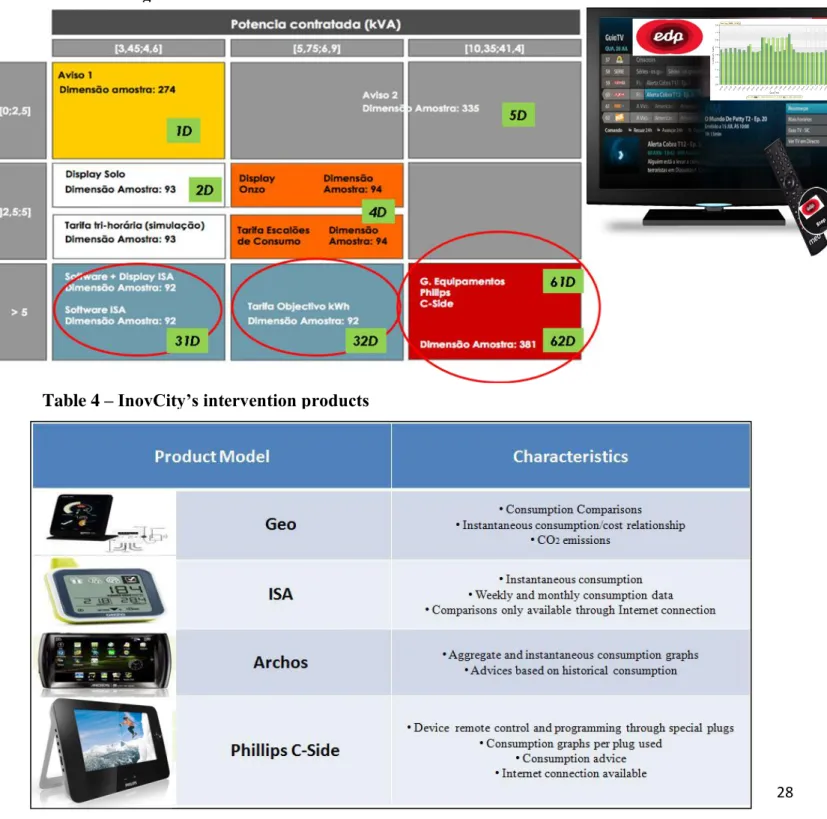
In what concerns InovCity’s intervention products, EDP has been performing its feedback impact tests with and without the aid of RTD’s to better understand how people react to the information given. There are four different devices used in trials, each one with different characteristics, some are more complex than others, so that each target segment has the right tablet addressed. Their individual features are discriminated in table number 4 of the appendix to better understand the differences among them. 3. Proposal
The aim of this work project is to develop and present a strategy plan for a new energy feedback product or service with potential to be tested and included in the InovCity’s project development.
In order to materialize the proposal, I will now briefly explain the steps to be taken, in this chapter, that I consider crucial to achieve the success of this work: 1- operationalization and characteristics – in this section I will clarify and describe how
12 does the proposal work, by giving the choice among two different procedures and then
provide the latent characteristics to be integrated in the proposal, always carefully supporting each choice taken; 2- survey results – in this section I will perform a detailed analysis about the results I have received from a survey I developed for a Portuguese sample, with the intention to evaluate people’s reaction and opinion about the product/service I am proposing; 3- segmentation – this part will be focused in addressing the proposal to the right target segments, based on a segmentation framework given by EDP; 4- joint venture/strategic analysis – in this step, two different market entry strategies will be enlightened to explain which one should EDP adopt, depending on the company’s intentions about the target market to be approached and the number of strategic partner(s) chosen; 5- SWOT analysis – this last section will be used to express the possible consequences the new product/service will bring to EDP, either when comparing it with the products already being tested in the trials, as well as what may happen to the company if adopting this new venture.
Furthermore, by running the pilot project for almost 2 years, EDP has been receiving enough feedback to perceive which parts of InovCity are not working well and needing improvement. The entity in charge for analyzing and managing the feedback resulting from this experience is the consultancy company Qmetrics. From a meeting that myself had with its staff, along with the rest of the university crew who are also studying this project, they gave us some general insights about what the people of Évora are stating about the program. More specifically, people are not satisfied with the outcomes of InovCity and mainly complaining about the complexity of both the operational system and the gadgets (the tablet displays) used to provide the information data of their energy spending. So, the development of the new proposal has also to “bear in mind” these
13 factors affecting the actual products used, so that the same problems or difficulties are
avoided.
3.1 Product/service operationalization and characteristics
The proposal I have developed for this work project consists in materializing the idea of providing energy spending feedback via TV to householders. In order to accomplish that, I suggest that the way to implement this new service/product involves the creation of a strategic alliance/joint venture between EDP and one or more channel operators in Portugal.
My idea for this service to be easily implemented is focused either on: developing a special program inserted in an interactive menu that is already provided by the operator, or creating a special channel for EDP where the energy consumption information of each user is transmitted in a private way.
The service itself doesn’t require much innovation or investment to be put in practice. In fact, the way it works is very simple (see Figure 9): data is collected and stored in the energy box (EB) and then transferred via online – one of EB’s tools – to the operator’s set-top box (usually it is mandatory to have this device to use the whole operator’s services – TV, games, Internet, etc.), to provide the information gathered so far in the interactive menu or EDP’s individual channel.
Based on both international and national research – through EPRI study, EDRP and the questionnaire I have performed to Portuguese people –, the provision of electricity spending feedback through TV has proved to be a good alternative when comparing with the RTDs now used in InovCity. However, the characteristics present in such product must be well chosen so that the same problems, when using the service, don’t occur and consequently affect the users’ motivation. In that way and based on the other products’ skills that proved to be successful, I have selected 10 different characteristics
14 that I find relevant and essential to be present in my proposal, so that it achieves the
proposed objectives:
User-friendly – the service and the products used to provide the consumption feedback information must be really simple to utilize and must not create any usage constraints to anyone, plus they should grant only the necessary and desired information in a clear, simple and short way. Basically, the user must only get what he really wants in the simplest and easiest way;
EDP button (see Figure 10) – in order to ease the access of each person’s information, it should be incorporated a specific button on the operator’s remote control that addresses the user to the information menus directly and pretty straightforward, avoiding any obstacles or difficulties. It should also be available all time, even if the user is using other services’ applications;
2-3 information menus – as proved in the EDRP research, people only check the first two information menus that appear on the screen. So the whole householder’s consumption data must be integrated in only two menus, at most three, which should swop automatically every 10 seconds or when pressing one of the side’s button;
Consumption measured in € or €/kWh – as seen in the general conclusions of the English case, as well as in the Portuguese survey, people value more if their consumption costs are shown and measured in € or the relation between pounds/€ they have spent per kilo watts per hour, so that they can also receive the information in a “scale” they understand, thus, use it to take wiser and better decisions about their consumption patterns;
Time frame per week or month – one of the EDRP’s study conclusions is that people want to check their billings in a time frame that is not so short or so long, while the Portuguese people, who participated in the pilot survey, mostly desire
15 their electricity spending to be shown in a weekly or monthly basis. Thus, I find
those two consumption periods the most useful for users, whilst the daily period should not be present in the new service;
Homologous comparisons – this feature is already present in some of the actual products used in the project, still, consumers recognize it brings a great level of utility to them in perceiving the consumption differences with the same period in the previous year. Therefore, it must be kept available to clients;
Over-consumption warning – people need to know and be aware when their level of expenditure is exceeding an ideal consumption pattern, so that they do not incur in an unexpected costly bill by the end of the month. The ideal consumption pattern can be easily illustrated by drawing a line at the same graphic of the weekly or monthly electricity consumption data, therefore enabling a direct, simple and clear evaluation. Its calculation can be derived from the new algorithm that is being studied by a colleague for the InovCity project, with the intent to discover a pattern that is as close as possible to the real users’ consumption;
SMS warning – people may not be checking every day or week how much they have been consuming, hence, EDP should send a SMS warning to each householder informing them about the availability of their bill in the interactive menu or channel and catch their attention to take a look and use the service available;
Number of customer support – new technological products or services usually have some working flaws that must be rapidly solved, so that people keep using them. So, in every menu or information related with the service there must be present the direct number of the customer support in case of any doubt, difficulty or problem related with the service to increase the client’s satisfaction and motivation towards it;
16 Pin code – whenever accessing the electricity consumption information, the user
must be asked to introduce a safety code, because this is the simplest way to protect and keep the data private. The code must only be asked when the user is entering the interactive menu or channel, and not when is swopping the information menus. 3.2 Survey Results
Besides the use of results from international investigation to support the adoption of such measure, I have performed a survey to Portuguese people in order to better know their willingness to accept and use a service like the one I am proposing. This can be supported by the fact that in case of implementation of such proposal, those are the ones that will use it and not the foreign people, who actually have cultural differences. More specifically, I conducted a pilot survey with a total of 8 questions addressed to a convenience sample of 15 people (from the whole country) with an age range between 25 and 55 years old, carefully selected by being the person who really pays the electricity bill - once those are the ones that may decide, in theory, to adhere and use a service like the one I am presenting –, as well as I guaranteed total privacy of each participant’s answers.
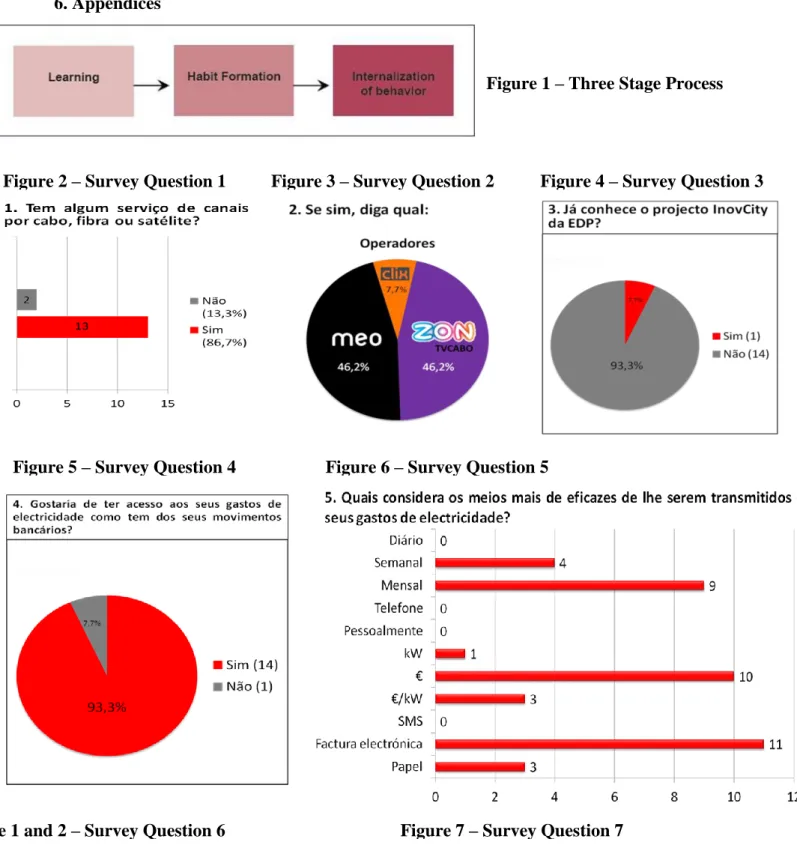
In the first question (see Figure 2), I asked the participants if they have any channel contract by cable, fiber or satellite – 13 out of 15 answered positively showing that the majority are subscribers of a channels’ operator.
The second question (see Figure 3) was only addressed to those that have a channels’ subscription, with the intent to know their distribution by operator. Results show that 46.2% either have Zon or Meo, while only 7.7% uses Clix.
In question number 3 (see Figure 4), I tested the general public knowledge about EDP’s Inovcity project existence. The inquiries show a great sign of ignorance about this initiative, as 14 people stated they haven’t ever heard about it. This may lead to three
17 possible conclusions: 1- people don’t get interested for this type of initiatives; 2- weak
awareness strategy by EDP to people outside the project; 3- EDP’s strategy to keep the program “low profile” so that if it is not successful, the brand image in not harmed. The forth question (see Figure 5) was developed to perceive people’s willingness to use a service that would track their energy costs in a similar way as they can do with their bank account movements. Answers were significantly positive as 14 people confirmed they would like to have access to such service.
In the following question (see Figure 6), I questioned people about which characteristics they valued more when their bills were received and gave them the chance to choose among 3 different ones. In terms of time-space information people value more the monthly (9) and the weekly (4) basis to transmit their consumption data, while the way participants worth more to receive the bills is through an electronic (11) or paper (3) billing and not through any of the other means (personally, phone or SMS). Also, it was possible to find out that the most desired way to evaluate the energy costs is using € (13) or €/kWh (3).
The sixth question (see Table 1 and 2) was used to evaluate the level of interest (between 1 and 10 where the higher the vote, the higher the level of interest) in having and using the TV feedback service provided by a channels’ operator. The answers show a positive mean (6.4), thus a positive level of interest. However, as the sample size may be considered small, perhaps if it was higher the mean could be even higher, bearing the fact that only 4 votes are below the mid value 5, while 9 votes are above this mark. Question number 7 (see Figure 7) was applied to infer if people were keen on adhering to an operator, in case it may start providing such service in its operations. Data shows that about 47% consider the usage of electricity billing through TV is possibly a surplus
18 to join an operator, while more than 33% confirmed it is a positive characteristic and the
other 20% replied that it is not a decisive factor to subscribe a specific operator.
In the last question (see Figure 9), I intended to deduce the willingness of the sample to pay for a service like the one I am presenting. 9 people signaled no intention to pay for such service, 4 expressed they could pay up to 2€ and only two other were willing to pay no more than 4€.
3.3 Segmentation
When a product or service is launched, the producer or service provider must address it to the right target population, so that only those that may want or can use it will be aware, thus a segmentation process must be undertaken by grouping customers within a segment according to similar needs, habits or attitudes that can be addressed through marketing strategies. Therefore, in order to achieve maximum accuracy one should match the new product/service with the appropriate segments, present in a segmentation sketch of the whole population.
For this work project, I will use the segmentation scheme (see Table 3) provided by EDP which relates the population segments according to two variables: electricity consumption and contracted power, in order to address the choice of the right real-time display to be used by each segment (according to EDP, this was the most efficient way to study the market segments). Firstly, I suggest that the company targets segment 6D (1 and 2), because this is the one that combines the highest values of both consumption and power, thus has the right to use the best display which has access to the Internet. As that tablet has web access, target people may also have an operator’s subscription of TV channels, as well as if they have the highest values of electricity spending, they may have higher incomes. In a broader sense, EDP should also target segment 3D (1 and 2) which is also characterized by using the highest consumption level, but the acquired
19 power levels are lower than segment 6D. Therefore, target people of this segment may
also have Internet access, since the display used (ISA) has also net wireless connection, and consequently may have an operator’s TV channel package.
These two segmentation assumptions have already been supported by EDP’s marketing staff that is controlling InovCity trials’ results, in a meeting we had in last November. 3.4 Joint Venture/Strategic alliance
The best entry market strategy for EDP to implement such service is through the development of a joint venture or a strategic alliance with one or more channel operators. A joint venture entails establishing a firm or a product that is jointly owned by two or more otherwise independent companies, as well as a strategic alliance refers to cooperative agreements in which two companies agree to cooperate on a particular task (developing a new product).
If EDP wants to develop an exclusive agreement with one of the market operators (Vodafone, Meo, Zon, Clix or Cabovisão), the most typical approach is a 50/50 joint venture/strategic alliance in which there are two parties owning a 50% stake in the company. So there must be a team of managers composed by personnel from both companies that share the operating control of this new venture.
However, if EDP seeks a wider strategy to target as much customers as possible, it must develop an alliance with more than one operator to serve a greater number of clients. In that case, EDP should develop its own specific team to control and manage the service and operations with all other partners involved. Then, the venture should belong 50% to EDP and the other stakes should be, therefore, equally divided by all other parties involved in the process.
20 3.5 SWOT analysis
When launching a new product or service, an effective way to measure its advantages and disadvantages is performing a SWOT analysis. It evaluates the strengths and weaknesses of the new invention by comparing it with the previous ones or the ones that are similar, and also determines the opportunities and threats that launching it will bring to the company, not only to its internal structure but also to its positioning in the market where it operates.
In terms of strengths, the new service will be better when comparing with the existing one in:
Increased approach to customers – the new service will be easier and simpler to access, because people can be watching TV, or any other service, and by clicking on just a button they will have direct access to this service, and do not have to buy or use any other product to assess their personal electricity information;
Adequate information – the users will only receive and get access to the information they desire and it will be transmitted in the most simple, clear and concise way possible;
Increased commodity – one the aims of this service is to provide to each customer more comfort, satisfaction and pleasure when checking their energy consumption so that they keep using it and get constantly motivated to improve their habits;
Lower time response to problems – by integrating a phone number for a customer support service in every information menu that users are able to navigate, will diminish the time response to any problem or flaw they may face when using the new service, as well as if it is a new problem, then in further similar failures technicians will know how to solve it;
21 Data privacy – with the introduction of a pin code when entering the interactive
menu or the information channel will protect the householder’s personal information, because only those who know it can enter and check the data;
Technology updates – this new service has the ability to easily switch the using software or the visualizing format by integrating automatic, constant and frequent updates through the operator’s set-top box;
Economies of scope – nowadays, channel operators offer a wide range o services that really go beyond TV channels – Facebook, recording TV programs in computers, mobile phones or tablets, games, video club, music, etc – because they have already developed a technological platform that provides the ability to create any service at a reduced cost, where the intended content for a new service just needs to be adapted. So, integrating an energy feedback service wouldn’t require as much investment as if EDP would have if developing it by itself.
Focusing just on weaknesses, the new service will bring some problems or won’t have some features the actual products used in trials have, like:
Lower precision of data’s time-frame – the service now available enables the users to verify their consumption in a daily basis. However, in my proposal such period is not offered because, according to recent research, people don’t value such short period of analysis;
No consumption data of each device – by connecting a plug to a desired equipment, the RTD can give its consumption data, which is not possible when using the new service;
No remote control of any equipment – the use of those plugs can also provide the ability to remotely turn on/off a certain equipment whenever wanted and can be also
22 previously programmed to work without any supervision. As my proposal doesn’t
able and integrate the use of that kind of plugs, this feature is also not present;
No CO2 data – one of the main conclusions of the EDRP research case is that users do not value any CO2 consumption information, thus it is not provided in the new service, though it may be easy to calculate.
Looking at the advantages or opportunities that my proposal may bring to EDP, we have:
New market – if EDP adopts the technology I am proposing, it will be a major step to enter into a new market (TV market) which in Portugal is increasing and becoming a new trend – according to this year’s accounts statement of the two main players in the business, Meo and Zon, clients’ number has increased about 33% reaching more than 1 million and 1,554 million respectively;
First-mover advantage – by entering a new market where none of the competitors is present will grant EDP the ability to develop a strong position and avoiding competition, and probably will assume a monopolistic position;
Shared risk – this is one of the consequences resulting from the creation of a strategic alliance/joint venture to launch a cooperation product – the investment and costs (specially fixed costs), as well as the responsibility of developing the new product are shared by both companies, so that in the case of success or failure the risk is shared;
Market knowledge of the partner – by launching a product with a company already operating in the target market grants EDP the opportunity to access the knowledge and expertise of the other company about that market, for instance, about consumption patterns or demographic tendencies;
23 Visibility and reputation – entering in a trendy market associated with an already
established and successful company would definitely increase EDP’s visibility and reputation.
Finally, launching this new product or service in the market, through a strategic alliance, may bring some threats to EDP, such as:
Increased current and permanent consumption – according to the EDRP study, consumers that have a low level of energy consumption below the ideal consumption pattern (one of the characteristics of the new service), may increase their current and permanent consumption which goes against the primary objectives of the InovCity project of reducing energy consumption levels;
Image erosion – in the long-term, EDP’s image and service usage may be harmed by the easiness and constant presence in the users’ TV, as they may not value it as much as they possibly do when the service is launched;
Decision autonomy reduction – the implementation and management of the new service will not be only in charge and autonomy of EDP, as the company has to share all decisions taken with the new partner(s);
Increased capacity of coordination and communication – launching a product or service with a partner requires great coordination and communication skills, besides greater human resources management from both companies, specially if their size is as big as the ones that may be involved in the implementation of this new venture. 4. Conclusion
Throughout this work project I have been building a new proposal for EDP’s pilot project InovCity. I started by introducing the main advantages on using smart meters – availability to track the customers’ energy consumption in detail and electronically, which able them to maximize their electricity utility and creates, to EDP, the ability to
24 solve problems or measure consumption levels without having to go directly to each
household – and the main objectives of this innovative program – improve environmental concerns, create a complex electricity network that can be managed by technology and able clients to make better energy spending decisions at the same time. The next step taken was providing research findings to support my proposal on how smart meters can be better applied, in order to take advantage on that type of technology in the best possible way and at the same time accomplishing the InovCity’s objectives. To do so, I brought EDRP results about the most successful interventions and desired features that have been tested in the UK, besides EPRI study’s insights on how people behave towards energy conservation, as well as the data from a questionnaire I address to a small Portuguese sample. It is also important to mention the behavioral feedback impacts on decision-making, specially the feedback Three-Step Process (learning phase, habit formation and internationalization of behavior). As seen in both cases, people worth more technologies that provide direct feedback like RTD’s or TV. Although it was evident in the Portuguese case that, in general, people don’t want to pay for a service providing their energy consumption information.
After gathering all information from research, I have presented a service that provides energy feedback information through TV (the information is collected in the smart box and then is transferred via online to an operator’s set-top box), as an alternative to the RTDs presently used in the project trials. Based on what was mentioned before (specially research information), I consider “vital” for this service to have some specific features so that when are people using it their expectations are quenched or even surpassed. Thus, the service must be friendly-user, has to have an EDP button on the remote control, at most 2-3 information menus, consumption is measured in € or €/kWh, time frame per week or month, homologous comparisons, an over-consumption
25 warning, a SMS warning, a number of customer support and a pin code. Moreover, I
have performed a SWOT analysis to better perceive which consequences this proposal would bring EDP, in the case of implementation.
In terms of strategic integration, the best way to implement this new service for EDP is to develop a joint venture/strategic alliance with one or more channel operators, depending on whether the company wants to foster an exclusive agreement or to target as much customers as possible (mass targeting). I hope EDP considers this proposal as a future successful step in the implementation of smart meters in Portugal and also that it leads to a better usage of the electricity resources available, streamlines the technology used in our homes and reduces households’ environmental impact.
Although I have presented a proposal that aims to improve the actual products/services used in the pilot study, there is more study required to better understand exactly how clients’ attention can be attained and captured through electricity feedback. This specific concern holds more with psychology studies’ findings, than with managerial background. However, in EPRI’s study the authors also mention some lights about this topic. In fact, researchers have found that in order to change and influence behavior there can be adopted two types of strategies: antecedent and consequence. The first strategy type focuses on manipulating a behavior before it actually occurs, usually targeting the general community in a non-personalized way – e.g. campaigns to incite recycling by putting trash in the “Eco-Ponto” bins. The other strategy type sticks more with introducing measures to show people the consequences of their behavior change. It can be done through incentives (rewards for pro-conservation behavior), disincentives (e.g. higher tariffs during higher daily consumption periods), or commitment strategies (making a commitment to conserve a certain percentage of their use). Indeed, I really consider this as the next big development step of this whole project to achieve success.
26 5. References
AECOM. 2011. Energy Demand Research Project: Final Analysis. UK.
Abrahamse, W., L. Steg, C. Vlek, and T. Rothengatter. 2005. “A Review of Intervention Studies Aimed at Household Energy Conservation.” Journal of
Environmental Psychology, 25(3): 273–291.
Darby, S. 2000. “Making it obvious: Designing feedback into energy consumption.” Paper presented at the 2nd International Conference on Energy Efficiency in Household Appliances and Lighting. Italian Association of Energy Economists/ ECSAVE Programme. Naples, Italy. Retrieved January 4, 2006, from http://www.eci.ox.ac.uk/lowercf/naples/NAPLES2000-SD.pdf.
Darby, S. 2006. “The Effectiveness of Feedback on Energy Consumption: A Review for DEFRA of the Literature on Metering, Billing and Direct Displays.” Environmental Change Institute, University of Oxford. Oxford, UK. Retrieved July 2008, from http://www.defra.gov.uk/environment/climatechange/uk/energy/research/pdf/energycon sump-feedback.pdf.
Electric Power Research Institute. 2009. Residential Electricity Use Feedback: A Research Synthesis and Economic Framework. EPRI, Palo Alto, CA: 2009. 1016844. Feedback. 2009. In Merriam-Webster Online Dictionary. Retrieved January 23, 2009, from http://www.merriam-webster.com/dictionary/feedback.
Fischer, C. 2007. Influencing Electricity Consumption via Consumer Feedback: A Review of Experience. Proceedings of the European Council for an Energy Efficient Economy (ECEEE) 2007 Summer Study, Panel 9 Dynamics of Consumption: 1873– 1884.
IPSOS Mori. 2007. The Impact of Information Provision on Behaviour Change: Desk
Research Review Conducted for energywatch by IPSOS Mori. energywatch. London,
UK.
Katzev, R. D. and T. R. Johnson. 1987. Promoting Energy Conservation: An Analysis
of Behavioral Research. Boulder, CO: Westview Press.
Seligman, C., L. Becker, and J. Darley. 1981. Encouraging Residential Energy Conservation through Feedback. Advances in environmental psychology, 3 (Energy: psychological perspectives): 93–114.
van Raaij, W. F. and T. M. M. Verhallen. 1983. “A Behavioral Model of Residential Energy Use.” Journal of Economic Psychology 3(1): 39–63.
http://www.inovcity.pt/pt/Pages/homepage.aspx
http://www.telecom.pt/InternetResource/PTSite/PT/Canais/Media/DestaquesHP/Destaq ues_2011/meomelhormarcanacional.htm
27 6. Appendices
Figure 3 – Survey Question 2 Figure 4 – Survey Question 3
Figure 5 – Survey Question 4 Figure 6 – Survey Question 5
Table 1 and 2 – Survey Question 6 Figure 7 – Survey Question 7 Figure 2 – Survey Question 1
28 Figure 8 – Survey Question 8 Figure 9 – Product/service Operationalization
Table 3 – EDP’s Segmentation Framework
Table 4 – InovCity’s intervention products