A Work Project, presented as part of the requirements for the Award of a Master Degree in Management from the NOVA – School of Business and Economics.
EMPIRICAL EVIDENCES ON VOLUNTARY DELISTING PHENOMENON
FRANCESCO SALZILLO - 1843
A Project carried out on the Corporate Finance course, under the supervision of: Professor Igor Cunha.
EMPIRICAL EVIDENCES ON VOLUNTARY DELISTING PHENOMENON
ABSTRACT
The paper studies what drives firms to voluntary delist from capital markets and what differs in firms’ behavior and fundamentals between public-to-private transactions and M&A deals with listed corporations. Moreover, I study the relationship between ownership percentage in controlling shareholders’ hands and cumulative returns around the delisting public announcement. I perform my tests both for the Italian and the US markets and I compare the findings to better understand how the phenomenon works in these different institutional environments. Consistent with my expectations, I find that the likelihood of delisting is mainly related to size, underperformance and undervaluation, while shareholders are more rewarded when their companies are involved in PTP transactions than in M&As with public firms.
1. INTRODUCTION
Delisting is a phenomenon which is carving out a significant role in literature during the last decades. The reason why experts and researchers are drawn to this phenomenon is mainly due to the will to find a general framework to understand why firms remove themselves from exchanges. There are two types of delisting: voluntary and involuntary. In this paper, I will focus the attention on the first, since it is more interesting to study firms’ behavior prior to the conscious exit from capital markets, than going private for not having met all the minimum requirements to continue to be publicly traded.
To develop this empirical study, I analyze separately two different markets, in order to better understand the dynamics that affect the phenomenon. Major attention will be paid to the Italian market: this presents an interesting framework to be analyzed because it is an environment constituted by significant family businesses’ tradition and controlling shareholder prominence in the ownership base. The Italian sample will be compared with the S&P 500 Index sample, composed by delisted firms which constituted the homonymous index until the day before the removal. US capital markets have a different ownership structure with respect to the Italian environment, given its higher floating, as well as the presence of a widespread shareholder base. I will use data from 2006 to 2010. The samples are constituted by firms traded on the FTSE Italia All-Share regarding the Italian pattern and on the S&P 500 Index for the homonymous sample. The total number of firms is respectively equal to 50 and 71. The study will be developed looking at fundamentals and financial indicators which have been considered as relevant given the existing literature on the argument. Shareholders’ returns are considered in terms of Cumulative Abnormal Return, or CAR, around the delisting public announcement, using a [-3; +3] daily window.
Testing the differences among delisted and survived companies in Italy through a Logit model, I found that firms which have been voluntary removed are more likely to be smaller in terms of size, undervalued and to underperform with respect to those which continued to be publicly traded. These findings are in line with the existing literature upon the argument. Moreover, studying the relationship between equity stakes in controlling shareholders’ hands and CARs around the delisting public announcement, I verified the hypothesis of a negative and significant coefficient.
Comparing, instead, the two environments, I found larger returns in terms of CAARs with higher concentration on the day of delisting public announcement in the US market, rather than in the Italian one. Furthermore, larger CARs are gained by shareholders who invest in companies involved in PTP transaction than in M&A agreements with listed companies in Italy, while this difference cannot be highlighted in the US sample. Likewise, studying the differences among these kinds of transactions through another Logit model, firms taken from the S&P 500 Index showed no significant variables to highlight, while, on the FTSE Italia All-Share, going-private companies have more likelihood to be smaller and have higher Dividend Yields.
The paper follows a specific structure. Section 2 will give a general overview on the voluntary delisting phenomenon, highlighting all its typologies. A literature review will follow in Section 3, where I will focus on the drivers which push firms to exit from capital markets and the characteristics which distinguish companies involved in PTP transactions from M&A deals with listed firms. Section 4 will highlight samples’ characteristics and descriptive statistics. In Section 5 I will illustrate the research methodology. In the following section, Section 6, I will present each step of the
analysis, together with my expectations, and discuss the results. Then, Section 7 will conclude the paper.
2. OVERVIEW ON VOLUNTARY DELISTING
The expression Voluntary Delisting is used whenever a firm removed itself from an exchange listing, though it still has all the legislative requirements to be still traded on the public market. Thus, it is necessary the agreement of the general meeting of shareholders, together with the board of directors, to render the removal effective. Each normative code established its own measures concerning delisting typologies, but, at least the European Member States, since the beginning of this century, have been experiencing a minimum harmonization thanks to the Takeover Directive by the European Union (2004/25/EC Directive). Despite of the research for a full coordination, there are still differences among Member States, due to difficulties and delays in implementation, which are leading to the undesirable result of not full alignment in the procedures (Van Der Elst, Van Den Steen, 2009). The implication is reflected into the confusion and the consequent harm in individual and minority shareholders, which may face different levels of protection depending on the country.
Regarding typologies, it is possible to have different way to voluntary delist a company. According to De Angelo, De Angelo and Rice (1984), the first way to be delisted from financial markets is the incorporation: a firm can be incorporated into another firm’s balance sheet after an acquisition. This operation can be done by a private or a public company. Whenever the acquirer is a private company, the target will be involved into a public-to-private (PTP) transaction, which would not allow the firm to be traded on capital markets anymore; on the other hand, in the case the acquirer is a public
company, which is regularly traded on the exchange listing, the target firm would theoretically not exist anymore because it would be incorporated into another company as before, but their assets would increase the value of the acquirer’s equity. The difference here stands in the nature of the offer: while, in PTP transactions, the acquirer announces a tender offer to purchase the totality of the shares, when the bidder is a public firm there could be the alternative of an exchange offer, which is done through an exchange ratio (Berk, DeMarzo, 2007). Another technique, besides incorporation, is the creation of a shell corporation. This is more likely to be used in pure going-private transactions, where the target firm is combined with another company, which has been constituted expressly for taking the first out of the market. In this case, through a tender offer, the shell corporation’s management becomes the unique owner of the firm (De Angelo et al., 1984).
The last tool to focus on is the one which characterized the first M&A wave in 1980s and it has been the most used technique for voluntary delistings during that period (Geranio, Zanotti, 2006): the Leveraged Buy-Out. This is typically a PTP operation, mostly led by Private Equity firms. The total value of firms acquired through LBOs between 1970 and 2007 accounts for $3.6 trillion, where $2.7 have been capitalized only in the first seven years of the twenty-first century (World Economic Forum, 2008). Whenever, instead, the buyer is constituted by the management of the firm itself, the transaction is called Management Buy-Out (Berk, DeMarzo, 2008).
3 LITERATURE REVIEW
3.1THE CHOICE BETWEEN STAYING PUBLIC AND GOING PRIVATE
The most important factors that affect the choice of preferring the private market instead of the ongoing trading on public listings can be highlighted analyzing the existing literature. The first evident signal for PTP transactions is firm’s undervaluation (Geranio, Zanotti, 2006). Undervaluation may be mainly driven by lack of interest by the market, no matter firm’s results, performance and future expectations. This leads to differences in value perception between outsiders and insiders. Therefore, undervaluation is brought by information asymmetries (Goh et al., 2001): insiders are more aware of target firm’s potential and future earnings growth, while, on the other hand, outsiders can just rely on public data or releases issued by the company, which maybe are not presenting a correct snapshot of the firm. Moreover, the gap may be also led by managers’ scarce capabilities in communicating the market firms’ value creation.
Due to amendments and introductions of new legislations for listed companies, such as the Sarbanes-Oxley Act in United States, the costs of staying listed are one of the most important causes which lead a company to abandon capital markets and go private. Even if these costs, from disclosure obligations to investor relations, are considered when a company plans to enter capital markets through the IPO, changes in legislation and the rising of the cost bar for being listed have constituted a serious problem for public companies during the last decade. “Many of the smaller companies that went public in the late 1990s and foreign issuers that entered the US market may wish to rethink their decision” (Carney, 2005). From 2003, the year after the SOX Act was emanated, in fact, it has been experienced a huge increase in going private filings on the
US market: 101 firms exited the market in 2003 and 114 in 2004, compared to 59 companies in 2002, experiencing a 71.19% increase just in one year.
Removal from capital markets may also constitute a way to hide from competitors, so acting without being monitored by them or the whole market in general. Listing requirements are, as it has just mentioned above, expensive and time consuming, but, at the same time, to reach transparency and fairness targets, they extremely expose all the public firms to everybody has interests in a specific company. Therefore, it may happen that, following a strategic rationale, a company would exit capital markets through the voluntary removal from listing to darken itself from the world market, so avoiding disclosing their financial data.
Another element to consider is the size of the firm, together with the portion of floating shares (Arbel, Strebel, 1982). Low floating transforms the liquidity advantage of staying public into an illiquidity issue. Although smaller firms tend to outperform the market (Fama, French, 1995), it is very difficult to find relevant and reliable information on them. Furthermore, institutional investors may not consider small caps with low free floating due to the above cited illiquidity issue: liquid shares’ investments are easier to withdraw without market impact. Thus, institutional investors, such as pension funds, even if small caps shares are relatively cheaper with respect to larger ones, may not consider buying portions of these kinds of firms’ equity.
Being on capital markets means for any company to construct a solid and pertinent dividend policy, in order to build up a strong image of the business and construct behind it a stable group of stockholders (Jensen, 1986). Dividend policies offer a snapshot of the company for any investor who wants to be shareholder. The so called value and
growth firms are both linked, among other characteristics, to their payout policies and a change in it could be not fully understood by their owners. Therefore, if a value company wanted to pursue growth strategies thinking about changing its dividend policy, it could face reluctance in the existing shareholder base, which may withdraw their investment and, as a consequence, lower company’s share price. Thus, in order not to let the value of the company collapse, dividend payout policy, even if not as significantly as the previous factors, could induce firms to exit capital markets.
Evidences show that the number of firms which are exiting the market a few years later the IPO is increasing (Geranio, Zanotti, 2006). Short life as public firm may be driven by two motivations: the will to exploit a short-term bull market, exiting it once the favorable condition is over, and the awareness of having made the wrong choice listing on markets. In this last case, the IPO price is higher than the last reported price, generating a loss. On the other hand, when firms exploit an upward market, they are more likely to experience positive difference between the last and the IPO price.
There are not only advantages in going private transactions, because, in any case, the company will not be public anymore, which means that it would not be as easily reachable and transparent as before. Going private would mean to face higher relative difficulties in raising capitals for investments, since the firm is not anymore easy to control and monitor through its disclosure obligations. Therefore, this translates into a higher firm’s cost of capital (Bartlett III, 2008). Not being anymore traded on capital markets give further drawbacks for shareholders, the owners of the company. PTP transactions lead to shares’ illiquidity. Thus, shareholders may be forced to be owners of something they do not want to. This problem may affect both controlling and minority shareholders, but it harms minorities more than others, since they do not have
any discretionary power. Some firms, in fact, in order to limit this potential drawback, give minorities the chance to trade shares on a predefined bargain basis to their broker (DLA Piper, 2009). Clearly, this is not the most favorable solution for minority shareholders, but at least companies give the opportunity to exit the investments, since holding illiquid shares may become frustrating.
The last point that can be relevant to raise is about the operating performance after voluntary delisting. PTP transactions are also considered for exploiting growth investment opportunities, but evidences on Continental Europe throughout this last century underline the difficulty to achieve the purposed operational targets. In fact, empirical findings by Croci and Del Giudice (2014) do not report any substantial positive change in profitability, highlighting a relative stable operating performance after the removal.
3.2 WHAT DIFFERS M&A WITH LISTED COMPANIES FROM PTP TRANSACTION
There are several characteristics that are relevant to highlight regarding firms which are involved in going-private and still-listed transactions. In a publication by Weir and Wright (2006), the first paper in literature of this genre, the analysis covers both financial and governance factors. Going-private firms have lower growth prospects than acquired firms by public corporations. This can be explained by the fact that, whether a public firm has high, or at least valuable, growth opportunities, in order not to waste the chance to more than increase its value thanks to market reactions, it would never decide to darken itself from capital markets going private.
are more likely to have insiders than firms subject to M&A by listed companies. This can be explained as follows: having a higher percentage of insider ownership means to be more aware of the real capabilities of the firms. For more concentrated management ownership firms, indeed, it is more likely to exploit PTP transactions through, for instance, MBOs, rather than sell the firm to a listed company, or merging with it, so losing the power in their hands.
4. SAMPLES’ CHARACTERISTICS AND DESCRIPTIVE STATISTICS
The Italian and the S&P 500 Index samples of firms that were delisted between 2006 and 2010 are constituted by 50 and 71 firms respectively. In both cases the number of delistings is very high, even more if, in the Italian market, this is compared with the number of IPOs for the same time horizon, which is equal to 68 and, among these, 5 companies voluntary delisted during the same period and are part of the sample under study.
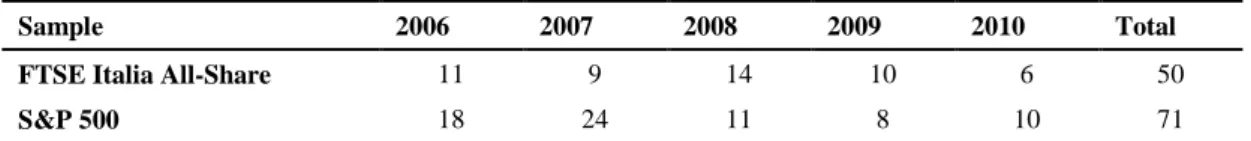
Table 1 presents the number of delistings for each year in the sample. The highest number of delistings is experienced in both the samples in the first year of financial crisis. The recession, in fact, started in 2007 in the United States, while the Italian sample, on the other hand, experienced the highest number of removals from trading the following year, which can be considered the year when the financial crisis from US started to widespread to the rest of the world. Another important remark can be done upon this point, since the second highest number can be observed in 2006, when the financial crisis was not spread yet, not even in the United States. According to Bordo (2008), in fact, the first turmoil happened in August 2007, when the freezing of the US lending market occurred, while the second wave, when the crisis worsened, occurred in
March 2008, when Bear Stearns was rescued. The investment bank was bailed-out through an M&A agreement with the same company which led the rescue of the first severe financial crisis which affected US in 1907, JP Morgan. Bear Stearns has been included in the S&P 500 sample and it is the one which experienced the largest negative CAR (-117.29%) in the considered event study window.
On the wave of the paper written by Weir and Wright (2006), I will analyze what drives firms to be target in PTP transactions rather than M&A deals with already listed companies. Table 2 presents the number of delistings from each type, which will lead to some first descriptive comments. As it is possible to see from the table, two thirds of the Italian firms went private during the sample period, while the distribution is completely different (23.94%) regarding the S&P 500 Index sample. This may be explained by the large difference in terms of firms’ size among the two considered groups. In fact, while the average market value of the Italian firms is equal to €2.1 billion, the same value regarding the US sample is equal to $11.96 billion. Thus, recalling the existing literature, smaller firms are more likely to go private (Geranio, Zanotti, 2006). An additional comment regarding this argument can be done looking at the remaining 54 companies in the US sample. In fact, it is possible to observe that 39 companies out of these 54 continued to be traded on the S&P 500 Index, notwithstanding the delisting. This may be driven by two explanations: the firm has been acquired by (or merged with) a former constituent of the same index; the resulting corporation from the M&A deal had a so large market capitalization to be included there as well.
5. RESEARCH METHODOLOGIES
In order to conduct a deep analysis of delisted firms’ characteristics, I downloaded data from Datastream for all the observations regarding Market-to-Book ratio, EV/EBITDA, Earnings Per Share, Price-Earnings ratio, Debt-to-Equity ratio, Dividend Yield, natural logarithm of Market Value and Total Assets. To deepen the analysis, I added lagged variables as well for all the fundamentals. These lagged variables concern the previous financial year with respect to the delisting public announcement. I run several Logit models for each step of the study to isolate the significant variables, so finding the most appropriate ones to explain the phenomenon. Returns are considered in terms of Cumulative Abnormal Return, or CAR, around the delisting public announcement. I use a [-3; +3] daily window, since the [-30; +30] interval would have been very large and dispersed from the public announcement, while the [-1; +1] could have been consistent only assuming strongly efficient capital markets. Moreover, I took data regarding controlling shareholders’ ownership percentage at the moment of the delisting announcement concerning firms in the Italian sample to study their relationship with cumulative returns.
6. EMPIRICAL FINDINGS AND COMMENTS
6.1 FIRST LOGIT MODEL
The first step to achieve is to develop a Logit Model highlighting the differences between delisted firms and survived companies on the Italian market throughout the considered time horizon. Regarding the survived firms, each year each of them has been treated as a different company. The number of listed firms is equal to 105, with a total number of observations equal to 507. I compare these to the 50 components in the
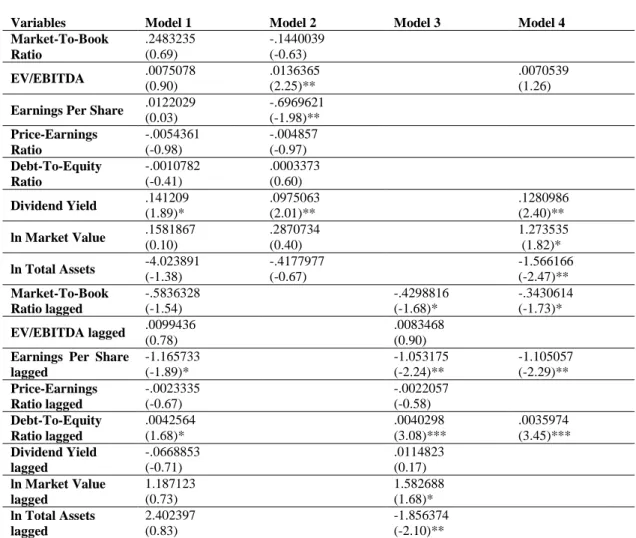
Italian sample. Focusing on the hypothesis, referring to the existing literature, I expect the delisted firms to be smaller in terms of size, to have a lower Market-to-Book ratio, used as indicator for undervaluation, to be less profitable in terms of EV/EBITDA, and to be more leveraged. The other variables, especially the lagged ones, have been added to have a clearer overview of the phenomenon. Model 1 in Table 3 includes all the variables of the dataset; Models 2 and 3 respectively consider actual and lagged variables alone; finally, Model 4 highlights just one variable among actual and lagged looking at the statistical significance (z values) observed in the previous models, picking each time the one with the highest value.
The results show that there are some variables which clearly give the investors an insight on firms’ decisions to voluntary remove from listing in the Italian market. Starting to comment the findings, it is possible to say that delisted companies are more likely to have a leveraged capital structure in the year prior to the public announcement of removal from exchanges. In this particular sample, it is important to underline the high number of LBOs carried on by Private Equities, 11. Thus, they have a relevant role even in an environment characterized by family businesses and high percentage of controlling shareholders. What happens, in fact, sometimes, is that a Private Equity company accords with insiders to carry on the deal in order not to have any kind of drawbacks from them. The reason why lagged EPS has a negative and significant coefficient can be found in underperformance: firms which are voluntary removed from the Italian market are worse performing than the survived ones. Furthermore, the model shows that delisted firms are more likely to have higher Dividend Yields. The reason could be found in the will to remunerate shareholders before it is too late.
The other variables to focus on are those included in Model 4, the one which gives a stronger insight on the drivers that lead to voluntary delisting in Italy. Market Value and Total Assets moves in opposite directions: delisted firms are more likely to have higher market capitalization and lower total assets during the year of public announcement of removal from exchange. The first variable can be explained by the large CAR shareholders experience due to the delisting announcement, while the second is consistent with the hypothesis that firms which opt to voluntary remove themselves from listing are smaller than the survived ones. To conclude, the hypothesis regarding undervaluation is verified as well, given that the Market-to-Book ratio’s coefficient of the lagged variable is negative and significant.
6.2 REGRESSION ON CUMULATIVE ABNORMAL RETURN
The purpose now is to find a relationship between CAR and percentage of ownership by controlling shareholders at the public announcement of delisting in the Italian sample. The interest towards this issue derives from the will to give this paper an individual investor’s perspective, rather than looking at data from the perspective of an external viewer. The number of firms is 42, since I deleted from the existing sample the companies whose ownership data were not available. The hypothesis to support concerns the negative relationship between CAR and the percentage of ownership in controlling shareholders’ hands: investors would perceive lower CARs as the percentage owned by majorities’ increases. I add some control variables, in particular those regarding size, performance, valuation and capital structure: Market-to-Book ratio, EV/EBITDA, D/E, natural logarithms of Market Value and Total Assets. Table 4 shows the results of the regression on the CAR.
From a first look at the table, it is possible to observe that the hypothesis has been verified, since there is negative relationship between CAR and controlling shareholders ownership at the delisting public announcement. P-value and the t-statistic even more underline variable’s significance. This result gives relevant insights for minority shareholders, to better understand and even predict the range of their CAR in case of voluntary delisting: the more the majorities and insiders hold in their hands in terms of ownership, the less the shareholders gain from delisting. The reason can be explained by the lower chance by minorities to impede the delisting transaction, since controlling shareholders, as their ownership increases, encounter fewer obstacles, due to their significant presence, in terms of vote, both in the general meeting and in the board of directors.
All the other variables, which have been included in the model as controls, do not give any additional remark to make, since their t-statistics and p-values are not statistically significant, except from Debt-to-Equity ratio, although its coefficient is very low. However, it is not surprising that there is negative relationship between CAR and D/E, because this means that the more a company is leveraged, the less its shareholders gain from the transaction.
6.3 COMPARING CAARS AMONG THE SAMPLES
The third step in this study focuses on AAR and CAAR distributions in order to compare and contrast the two samples. I expect a higher CAAR for S&P 500 companies rather than the Italian ones, given institutional and ownership structures already highlighted. Table 5 summarizes the distribution for each sample in terms of AAR, on the left-hand side, and CAAR, on the other side. The first values which capture the
attention are the CAAR for the whole 7-days interval around the public announcement: 10.53% for the Italian sample and 15.10% for the S&P 500 Index sample. The gap among these two markets is extremely high, since the second exceeds the first by 43.44%, verifying the hypothesis stated earlier above. This gap can be attributed by several factors. The most relevant to highlight is the ownership composition: Italian firms are businesses led by families or large controlling shareholders and the previous regression verified how companies with larger ownership percentages lead to lower CAAR for the shareholder base.
Looking at several publications on the argument, which have been focused more on PTP transactions than including all the kinds of voluntary delisting, the authors noted a higher premium, also due to a larger event-study window. De Angelo, De Angelo and Rice (1984) used a 10 days anticipation window, verifying a premium to shareholders, in terms of CAAR, equal to 28.05%. The same can be found looking at another publication, this time by Lehn and Poulsen (1989), which, analyzing an equal-length window to the previous authors, noted a CAAR equal to 19.30%. Different event study windows lead to different results. It has to take into account that each analysis considers a different time horizon. I, in fact, considered delisting transactions during a tough time for capital markets, probably even more for the US than for Italy. The samples, in fact, included several companies which have experienced big losses, in terms of performance as well as stock prices and CAR around the delisting announcement. One of them can be the already cited investment bank Bear Stearns, which was acquired and bailout by JP Morgan. In March 2008, when it was announced the delisting procedure with the consequent purchase by JP Morgan, shareholders experienced a notable negative CAR (-117.29%), with an abnormal return of -82.8% just on the day of announcement. If, in
fact, Bear Stearns and all the other firms which have experienced negative CARs had been excluded from the sample, then the gap with respect to the Italian sample would have been even larger: the resulting CAAR for the S&P 500 Index sample would have reached up to 17.82%.
Furthermore, one third of the whole CAAR (33.02%) has been already gained before the announcement in the Italian sample, while the percentage for the second sample is quite irrelevant, since the CAAR before the announcement is just equal to 1.16% (7.69% of the 7-days window CAAR). The only possible explanation of this phenomenon is investors’, or, to better say, insiders’ prior knowledge about the transaction. The US market may represent, in this case, an example of semi-strong form of market efficiency, given the immediate shift and adjustment once the information comes out. This does not mean that there is any kind of forms of insider trading in Italy, but maybe there is a higher security leak in Italy than in US, which leads the stock price to go up before the public announcement.
6.4 SECOND LOGIT MODEL AND CAARS HYPOTHESIS TESTING
The second Logit Model to develop for the empirical study has the objective to give deeper insights on which are the drivers to distinguish delisted firms involved in PTP transactions to those which are acquisition targets for listed companies. The study will be led both for Italy and US. Concerning the hypothesis for this section, size is expected to be smaller for firms which have been taken private, recalling the existing literature. Acquisition targets for listed firms are expected to have higher Market-to-Book ratio than going-private companies, since it is known that firms are often taken out of public markets by Private Equities or insiders to mainly exploit undervaluation opportunities.
In the last part of this section I will compare CAARs from the same subsamples. I expect to find a clear difference in terms of CAAR among these two typologies, in favor of PTPs, and I will test this through a hypothesis test on the difference of the means.
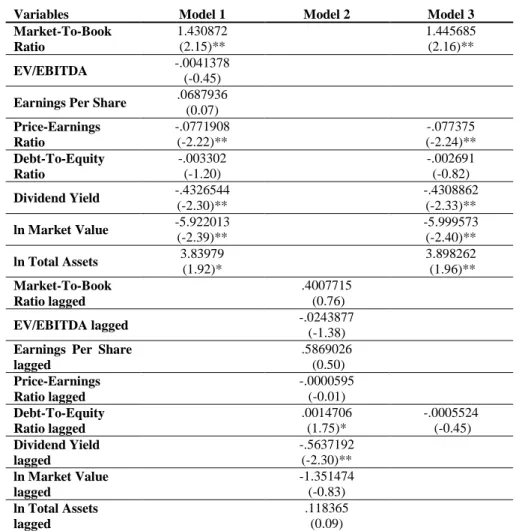
Table 6 represents the models run on the Italian sample. Starting analyzing the findings, firms involved in public-to-private transactions are more likely to have lower Price-Earnings ratio and Dividend Yield. A constantly lower DY, even regarding the lagged variable, represents lower relative dividend payments during the last two years. On the other hand, a lower PE ratio leads the investors to expect lower earnings’ growth in the future. Correlation in sign among these two variables is very interesting, given that several studies verify strong inverse relationship among these two variables (Crestmont Research, 2014). Further remarks concern valuation and size issues. Recalling the hypothesis expressed above, I expected going-private firms to be smaller and relatively undervalued than companies involved in deals with already public firms. Looking at the Market Value, the negative and statistically significant coefficient highlights a smaller size in terms of market cap for going-private companies. This result, however, is not consistent with other two variables, since both Total Assets and the Market-to-Book ratio are more likely to be larger in the case of firms involved in PTP transactions. This means that equity is more valuable in the case of going-private companies, but, at the same time, the inverse relationship among MV and TA may lead to think about undervaluation. For the misleading results upon this last finding, it is not possible to give a univocal conclusion about undervaluation.
Once analyzed the Italian sample and having highlighted the differences among its subsamples, the focus now passes on the S&P 500 Index. Table 7 summarizes the
findings. I decided not to report any Model 3, since it would have made no sense to highlight results which were not significant and not able to give any more valuable outcomes. In the light of the results, it is evident that there are no clear differences in fundamentals and indicators between the two subsamples. The only note can be made on the variable regarding Total Assets, since in both the models I found that going-private companies are more likely to denote lower values in both the two years prior to the delisting. The reasons which have led to results like these, full of no evident differences among subsamples, can be given by the particular conformation of the S&P 500 Index: being constituted by the largest and most active firms on the NYSE, it is very unlikely for a particular group of firms to clearly distinguish itself from another one, especially in performance, since constant underperformance, for instance, would mean to leave the Index. The sample under study, in particular, is heterogeneously composed, presenting representatives of several sectors: for example firms from consumers’ goods, pharmaceutical or information technology industries, are present in both the subsamples. The only exception is given by financial services’ firms. These companies, in fact, given their relevance and exposure, together with the economic crisis ongoing in the considered period, have been all incorporated in listed companies.
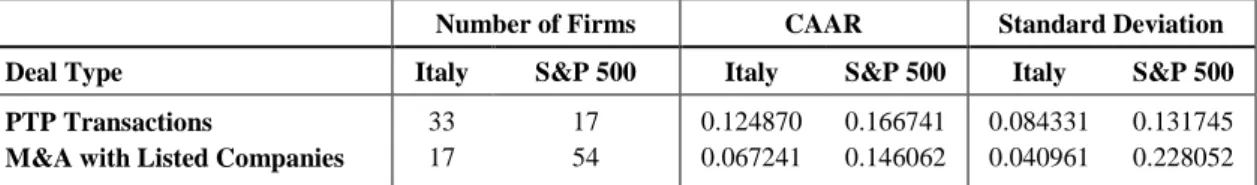
To conclude, comparing CAARs of both subsamples, through a t-test, as it is reported in Table 8 and 9, concerning the Italian sample, firms involved PTP transactions show a higher CAAR than the ones acquired by public companies, verifying the stated hypothesis. P-value is approximately equal to 0.001, so highlighting the gap between the subsamples. Since, in case of PTP transactions, shareholders would be expropriated by the right to benefit from firm’s future cash flows, they realize higher returns in the considered 7-day window around the public announcement of delisting. By contrast, in
case of companies incorporated in already listed firms, shareholders are almost always rewarded through exchange offers, so becoming stockholders of a “de facto” new firm. The same conclusion cannot be made upon the S&P 500 index sample, since, given a very low t-statistic (0.46), the hypothesis is not verified: there is no evidence in difference among subsamples’ CAARs, despite the fact, looking at the averages, PTP transactions rewarded almost 2% more than M&A deals with public companies.
7. CONCLUSIONS
The purpose of this paper was to study voluntary delisted firms’ characteristics in terms of fundamentals and financial indicators in Italy, comparing findings and results with removed companies from S&P 500 Index. To study this phenomenon, I took data from 2006 to 2010, finding 50 voluntary delisted firms from Borsa Italiana, the Italian stock exchange, and 71 from the S&P 500 Index. The existing literature upon this subject has always focused the attention more on US and UK markets, due to the higher economic interests and the conformation of the environment, than on Continental European countries. Thus, comparing these two samples, I wanted to understand how markets’ characteristics conduct to different results. In the light of this, the most relevant evidences concern the differences between firms involved PTP transactions and those incorporated in listed companies: the lack of statistical significance both regarding fundamentals and CAAR hypothesis test reveals no substantial differences among delisted companies in the S&P 500 sample; on the other hand, the results regarding the Italian sample, verifying the majority of the stated hypothesis, highlight relevant insights. Going-private companies are smaller and experience higher and significant CARs than those entered in M&A agreements with listed firms, as if they wanted to reward their shareholders before it is too late.
Furthermore, focusing the attention on fundamentals regarding size, valuation and performance, I tested the observations from the Italian sample to find whether firms in that country show the same features the existing literature underline. I found a greater likelihood of leveraged structure, underperformance, undervaluation and smaller size in delisted rather than still public firms. Moreover, another important objective I wanted to achieve developing this study was to try to find a relationship between CAR around the delisting public announcement and the percentage of ownership by controlling shareholders. Hypothesizing a negative relationship, the Italian sample confirmed that the more the majorities have in terms of ownership, the less the shareholder base gains from voluntary delisting.
Interesting cues for future researches, maintaining this structure of constant comparison between two different institutional environments, may be constituted by studying firms’ operational performance after voluntary delisting and comparing it with their expectations, in order to understand whether the choice to exit from capital markets has been the right one.
REFERENCES
Arbel, Avner; Strebel, Paul. 1982. “The Neglected and Small Firm Effects.” Financial
Review, 17(4): 201-218;
Bartlett III, Robert P. 2008. “Going Private But Staying Public: Reexamining the Effect of Sarbanes-Oxley on Firms' Going-Private Decisions.” UGA Legal Studies
Research Paper, n° 08-003;
Berk, Jonathan; Demarzo, Peter. 2007. Corporate Finance, Pearson International
Boot, Arnoud W. A.; Gopalan, Radhakrishnan; Thakor, Anjan V. 2008. “Market Liquidity, Investor Participation and Managerial Autonomy: Why do firms go private?.”
The Journal of Finance, 63(4): 2013-2059;
Bordo, Micheal D. 2008. “An Historical Perspective on the Crisis of 2007-2008.”
National Bureau of Economic Research, Working Paper n° 14569;
Carney, William J. 2005. “The Costs of Being Public after The Sarbanes-Oxley: The Irony of “Going Private”.” Emory Law Journal, 55: 141-160;
Crestmont Research. 2014. “Dividend Yield vs. P/E Ratio”;
Croci, Ettore; Del Giudice, Alfonso. 2014. “Delistings, Controlling Shareholders and Firm Performance in Europe.” European Financial Management, 20(2): 374-405; DeAngelo, Harry; DeAngelo, Linda; Rice, Edward M. 1984. “Going Private: Minority Freezeouts and Stockholders Wealth.” Journal of Law & Economics, 27(2): 367-401;
De Maeseneire, Wouter; Brinkhuis, Samantha. 2012. “What Drives Leverage in Leveraged Buyouts? An Analysis of European Leveraged Buyouts’ Capital Structure.” Accounting & Finance 52: 155-182;
DLA Piper.,2009. “Delistings and Share Buy-Backs.” Venulex Legal Summaries; Fama, Eugene F.; French, Kenneth R. 1995. “Size and Book to Market Factors in Earnings and Returns.” Journal of Finance 50(1): 131-155;
Geranio, Manuela; Zanotti, Giovanna. 2006. “Equity Markets Do Not Fit All: An Analysis of Public to Private Deals in Continental Europe.” European Financial
Management, 18(5): 867-895;
Goh, Jeremy; Gombola, Michael; Liu, Feng-Ying; Chou. 2002. “Going Private Restructuring and Earnings Expectations: A Test of the Release of Favorable Information for Target Firms and Industry Rivals.” Working Paper;
Jensen, Michael C. 1986. “Agency Costs and Free Cash Flow, Corporate Finance and Take-overs.” American Economics Review, 76(2): 323-329;
Lehn, Kenneth; Poulsen, Annette. 1989. “Free Cash Flow and Stockholder Gains in Going Private Transactions.” The Journal of Finance, 44(3): 771-787;
Martinez, Isabelle; Serve, Stephanie. 2010. “The Delisting Decision: The Case of Buyout Offer with Squeeze-out (BOSO).” International Review of Law and Economics, 31: 228– 239;
Tutino, Marco; Panetta, Ida Claudia; Laghi, Enrico. 2013. “All You Need is Cash? Empirical Evidence on Key Factors in Delisting Process in Italy.” 3rd Annual
International Conference on Accounting and Finance (AF 2013);
Van Der Elst, Christoph; Van Den Steen, Lientje. 2009. “Balancing the Interests of Minority and Majority Shareholders: A Comparative Analysis of Squeeze-out and Sell-out Rights.” European Company & Financial Law Review, 6(4): 391-439;
Weir, Charlie; Wright, Mike. 2006, Governance and Takeovers: are Public-To-Private Transactions Different from Traditional Acquisitions of Listed Corporations?
Accounting and Business Research, 36(4): 289-307;
World Economic Forum. 2008. “The Global Economic Impact of Private Equity Report 2008.” The Globalization of Alternative Investments, 1.
APPENDIX
Table 1: Voluntary delisted companies’ distribution across years.
Sample 2006 2007 2008 2009 2010 Total
FTSE Italia All-Share 11 9 14 10 6 50
S&P 500 18 24 11 8 10 71
Table 2: Deal type distribution across samples.
Sample PTP Transactions M&A with Listed Companies Total
FTSE Italia All-Share 33 17 50
Table 3: Logit Model on the Italian market between voluntary delisted and still public firms.
Variables Model 1 Model 2 Model 3 Model 4
Market-To-Book Ratio .2483235 (0.69) -.1440039 (-0.63) EV/EBITDA .0075078 (0.90) .0136365 (2.25)** .0070539 (1.26)
Earnings Per Share .0122029
(0.03) -.6969621 (-1.98)** Price-Earnings Ratio -.0054361 (-0.98) -.004857 (-0.97) Debt-To-Equity Ratio -.0010782 (-0.41) .0003373 (0.60) Dividend Yield .141209 (1.89)* .0975063 (2.01)** .1280986 (2.40)** ln Market Value .1581867 (0.10) .2870734 (0.40) 1.273535 (1.82)* ln Total Assets -4.023891 (-1.38) -.4177977 (-0.67) -1.566166 (-2.47)** Market-To-Book Ratio lagged -.5836328 (-1.54) -.4298816 (-1.68)* -.3430614 (-1.73)* EV/EBITDA lagged .0099436 (0.78) .0083468 (0.90)
Earnings Per Share lagged -1.165733 (-1.89)* -1.053175 (-2.24)** -1.105057 (-2.29)** Price-Earnings Ratio lagged -.0023335 (-0.67) -.0022057 (-0.58) Debt-To-Equity Ratio lagged .0042564 (1.68)* .0040298 (3.08)*** .0035974 (3.45)*** Dividend Yield lagged -.0668853 (-0.71) .0114823 (0.17) ln Market Value lagged 1.187123 (0.73) 1.582688 (1.68)* ln Total Assets lagged 2.402397 (0.83) -1.856374 (-2.10)**
The table above shows the results in terms of coefficients, while z values are highlighted in brackets. The stars next to the brackets are useful to understand the significance level: * means that the result is significant at the 10% level; ** means that it is significant at the 5% level; *** shows significance at the 1% level.
Table 4: Regression on CAR for the Italian sample.
Variables Coefficient t-statistic p-value Standard Error
Controlling Sh. -.1445974 -2.59 0.014 .0557862 Market-To-Book -.0016368 -0.14 0.887 .0114676 EV/EBITDA .0002114 1.58 0.124 .0001342 Debt-To-Equity -.0001189 -1.75 0.089 .0000679 ln Market Value -.045542 -0.94 0.355 .0486245 ln Total Assets .0352345 0.84 0.409 .0421427 Intercept .1272098 0.86 0.397 .1483859
Table 5: Average Abnormal and Cumulative Average Abnormal Returns’ distribution across time.
Italian Sample S&P 500 Index
Sample
t (days) AAR CAAR AAR CAAR
-3 0.005174 0.005174 0.000788 0.000788 -2 0.015213 0.020387 0.00498 0.005768 -1 0.014376 0.034762 0.005843 0.011611 0 0.053347 0.088109 0.125096 0.136707 1 0.011858 0.099967 0.004108 0.140815 2 0.001275 0.101241 0.004324 0.145139 3 0.004035 0.105276 0.005874 0.151013
Table 6: Logit Model on the Italian sample regarding the difference between firms involved in PTP transactions and acquired by already listed companies.
Variables Model 1 Model 2 Model 3
Market-To-Book Ratio 1.430872 (2.15)** 1.445685 (2.16)** EV/EBITDA -.0041378 (-0.45)
Earnings Per Share .0687936
(0.07) Price-Earnings Ratio -.0771908 (-2.22)** -.077375 (-2.24)** Debt-To-Equity Ratio -.003302 (-1.20) -.002691 (-0.82) Dividend Yield -.4326544 (-2.30)** -.4308862 (-2.33)** ln Market Value -5.922013 (-2.39)** -5.999573 (-2.40)** ln Total Assets 3.83979 (1.92)* 3.898262 (1.96)** Market-To-Book Ratio lagged .4007715 (0.76) EV/EBITDA lagged -.0243877 (-1.38)
Earnings Per Share lagged .5869026 (0.50) Price-Earnings Ratio lagged -.0000595 (-0.01) Debt-To-Equity Ratio lagged .0014706 (1.75)* -.0005524 (-0.45) Dividend Yield lagged -.5637192 (-2.30)** ln Market Value lagged -1.351474 (-0.83) ln Total Assets lagged .118365 (0.09) The table follows the same guidelines as the previous one.
Table 7: Logit Model on the S&P 500 Index sample regarding the difference between firms involved in PTP transactions and acquired by listed companies.
Variables Model 1 Model 2
Market-To-Book Ratio -.1714931 (-1.27) EV/EBITDA .0164113 (0.23)
Earnings Per Share -.0451857
(-0.27) Price-Earnings Ratio -.0216246 (-1.05) Debt-To-Equity Ratio .000736 (0.65) Dividend Yield -.1163214 (-0.55) ln Market Value 2.041899 (1.45) ln Total Assets -2.247757 (-1.77)* Market-To-Book Ratio lagged -.1983923 (-0.99) EV/EBITDA lagged -.0176656 (-0.58)
Earnings Per Share lagged .0468293 (0.22) Price-Earnings Ratio lagged -.0009321 (-0.15) Debt-To-Equity Ratio lagged -.0016472 (-0.34) Dividend Yield lagged .2173224 (0.88) ln Market Value lagged 2.480585 (1.32) ln Total Assets lagged -2.834437 (-1.66)* The table follows the same guidelines as the previous two.
Table 8: Number of Firms, CAAR and Standard Deviation per Deal Type across samples.
Number of Firms CAAR Standard Deviation
Deal Type Italy S&P 500 Italy S&P 500 Italy S&P 500
PTP Transactions
M&A with Listed Companies
33 17 17 54 0.124870 0.067241 0.166741 0.146062 0.084331 0.040961 0.131745 0.228052
Table 9: T-test Results on Subsamples to Confront CAARs.
Samples t-statistic Degrees of
Freedom p-value
FTSE Italia All-Share 3.251147 52 0.001053