Due to the new evaluations of binary systems, all ternary systems including oxygen were optimized. Complete Gibbs energy expressions for the alloy phases were presented, allowing the calculation of phase diagrams and thermodynamic mixing properties of the alloy phases. This work was carried out at the Metallurgy Laboratory at Helsinki University of Technology, Outokumpu Research Oy, Outokumpu Harjavalta Metals Oy and OMG Harjavalta Nickel Oy during 1993-2002.
This has led to large computerized data bank systems that contain thermodynamic information about multicomponent systems in the form of mathematical functions. Using such an expert system, it is possible to calculate any phase diagram for the systems included in the database and also make predictive calculations and other useful diagrams to solve a specific problem. In the production of ferrochrome or stainless steels, the melts contain so many components other than iron that the systems can no longer be treated as dilute systems.
Nevertheless, this database is a complete description of the five-component system and can be used at all concentrations. When applying this dataset to other areas, it should be noted that the uncertainty of the description is much larger in areas where no experimental information is available.
Gibbs energy
This can most easily be done by choosing the Gibbs energy as the fundamental property function.
Description of mixture phases
- Random substitutional solution models
- Sublattice model
- Compound energy model
- Partially ionic liquid
- Associate model
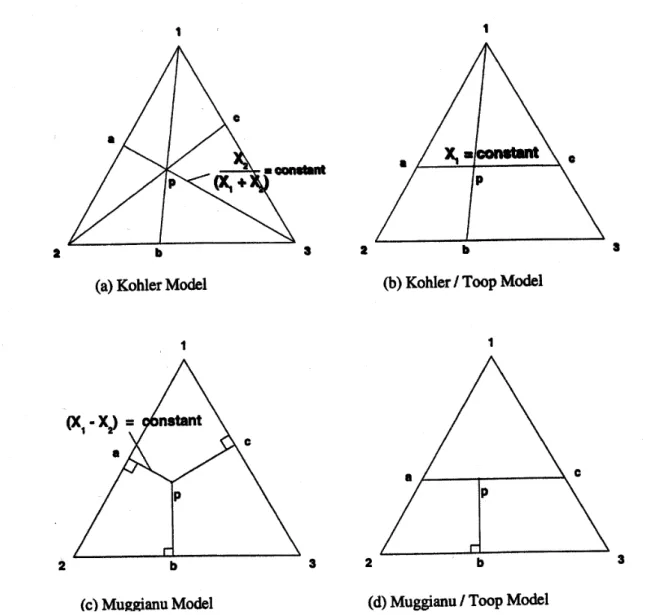
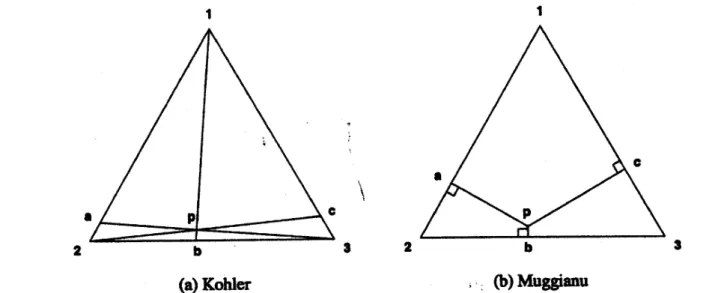
- Interpolation models
The descriptions of the Gibbs energy of ideal mixing and the excess Gibbs energy are different for each model used in the calculation. In the sublattice model, instead of the entire composition xi, the site fraction yi is used as a coefficient in defining the Gibbs energy of the phase. The 'end terms' generated when only pure components exist on the sublattice effectively define the reference state of the Gibbs energy.
The composition of the phase is then included in the space between the four 'end links'. In the cases where there are many charged 'end members', the model easily becomes very complex and is difficult to balance. G is the Gibbs energy of the exchange reaction and can be defined to be zero.
The thermodynamic properties of the liquid phase then depend predominantly on the Gibbs energy of formation of these associates rather than the interaction between the components. The numerical values of the Gibbs energy of formation for these associated compounds can be calculated directly from the corresponding values for these phase compounds.
Database programs
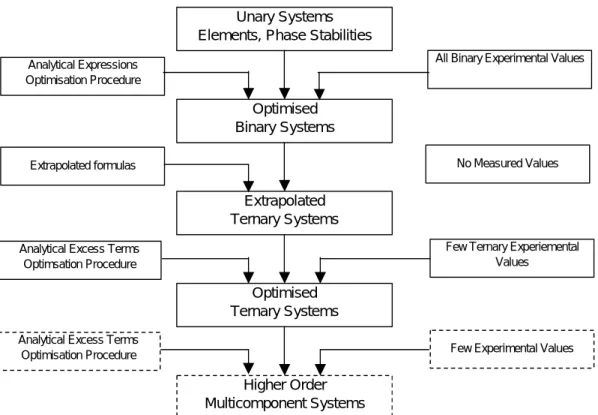
The Calphad principle
A useful choice for the standard state is the SER, where the enthalpy of the most stable state of the element is zero at 25°C. The enthalpy and entropy of an element at any temperature can be calculated using Equations 5 and 6, and the Gibbs energy of an element can be calculated using Equation 3. The thermodynamic properties for all species are then calculated from the Gibbs energy of formation of those species.
This also means that if there is a phase in a ternary system that does not exist in binary systems as a stable phase, but can be mathematically calculated to exist, the parameters of that phase must be defined with values which keeps the phase metastable.
Optimisation practice
Gas phase
Liquid
Solid metallic phases
Sigma phase
Wüstite and bunsenite
The program used in this work, Thermo-Calc, allows the use of a different model for each phase. In this work, this phase is called "corundum" after its prototype phase.
Spinel
Graphite
Carbide phases
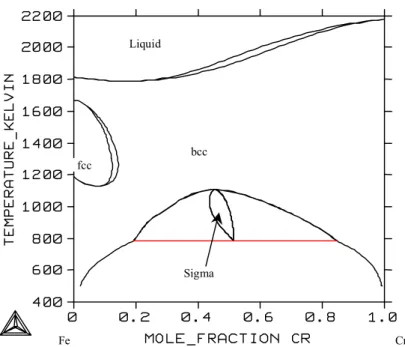
System Fe-Cr
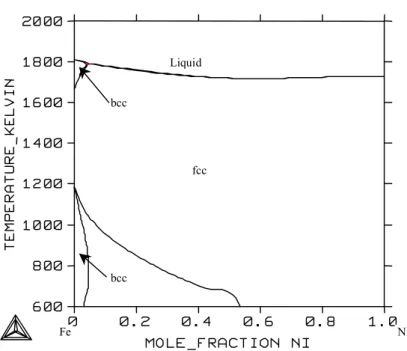
System Fe-Ni
System Fe-C
System Fe-O
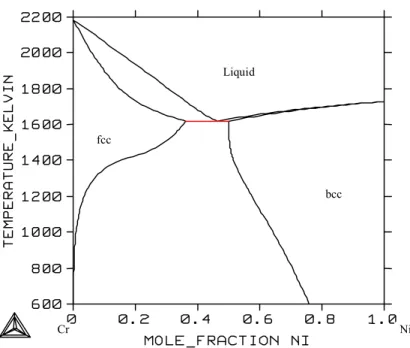
System Cr-Ni
System Cr-C
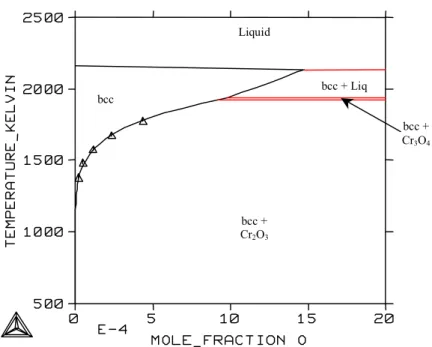
System Cr-O
System Ni-C
System Ni-O
System C-O
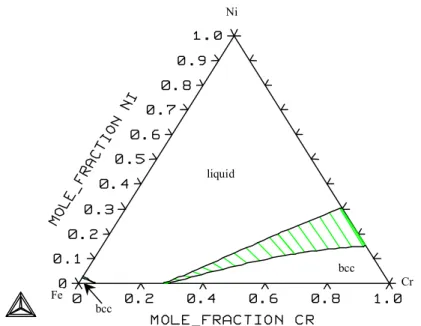
System Fe-Cr-Ni
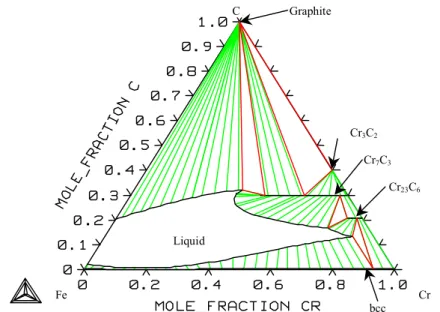
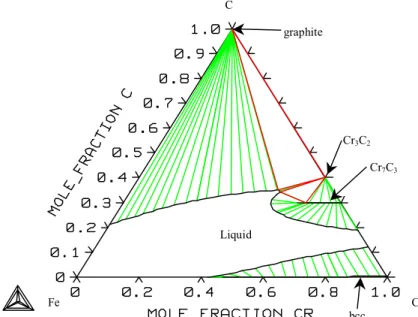
System Fe-Cr-C
Most of the ternary systems are taken from the Thermo-Calc SSOL database, version M /36/.
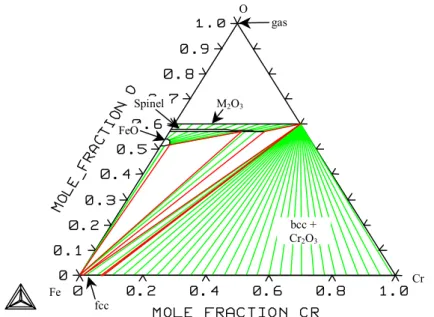
System Fe-Cr-O
The solubility of oxygen in molten iron-chromium alloys has been measured by several authors /55- 67/. The activity of oxygen in the liquid phase has also been measured by Janke et al. The melting point of the spinel phase was found to be 2100°C by Muan et al.
They also found that the solubility of Cr2O3 in wüstite was 7 w-% at 1420°C, where wüstite melts. The Gibbs energy of the formation of chromite (FeCr2O4) has been measured by Shaklin et al. Seybolt /91/ suggested that the spinel phase is also in equilibrium with the bcc phase, but in later studies /84,32/ the corundum phase was found to be in equilibrium with fcc iron.
This difference can also be seen in a diagram of the oxygen pressure, which is shown in Figure 26. The oxygen pressures in the three-phase equilibria are listed in Table 5 for comparison with the values selected from /32/. The solubility of oxygen in the metal liquid at 1873 K is shown in figure 28 and the activity of oxygen in equilibrium with solid oxides in figure 29, with experimental values.
System Fe-C-O
System Fe-Ni-C
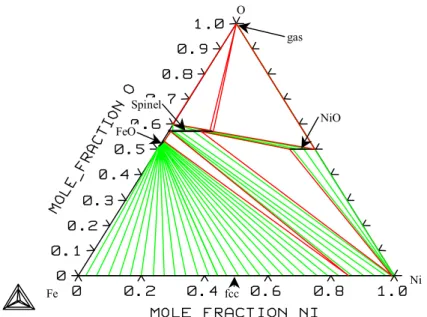
System Fe-Ni-O
As you can see, the experimental values in Figure 37 are very scattered and show a remarkable deviation from the calculated values. The calculated values correspond to the experimental values measured with an Al2O3 crucible. The calculated phase diagrams and thermodynamic properties agree well with the experimental ones, except for the bunsenite region, where the experimental values are very scattered.
The high solubility of iron in bunsenite, as reported by Raghavan /32/, is inconsistent with measured liquid areas at higher temperatures and therefore the values given by Trinel-Dufour /129/ are more likely. Raghavan also suggested that there is no miscibility gap on the nickel-rich side in the liquid phase at a temperature of 1813 K and made no suggestions regarding the stability of bunsenite at that temperature. The other publications report that this area is similar to the calculated diagram.
The lowest values were found using a SiO2 crucible and the highest values using an Al2O3 crucible. It is therefore clear that the results obtained using an Al2O3 crucible are more reliable for the Fe-Ni-O system. However, this solubility gave rise to significant uncertainty regarding the measurements in this region of the phase diagram.
System Cr-Ni-C
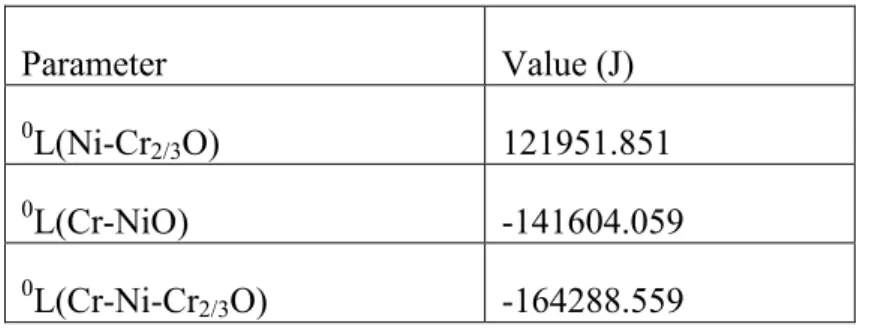
System Cr-Ni-O
The calculated phase diagram agrees very well with that given by Taylor et al. The solubility of oxygen in molten Ni-Cr alloys is shown in Fig. 43 together with the experimental points of Belov /150/, Averin /149/ and Heinz /64/. The calculated values of Sakao /148/ assume that Cr3O4 is a stable oxide phase at this temperature and therefore their values are not strictly comparable.
The measured solubility is very low at 2 at% chromium and the assessed parameters give a solubility that is slightly higher than the Averin values. The calculated oxygen pressure diagram of the Cr-Ni-O system at 1873 K is shown in Figure 45, along with experimental points.
System Cr-C-O
System Ni-C-O
System Fe-Cr-Ni-C
System Fe-Cr-Ni-O
System Fe-Cr-C-O
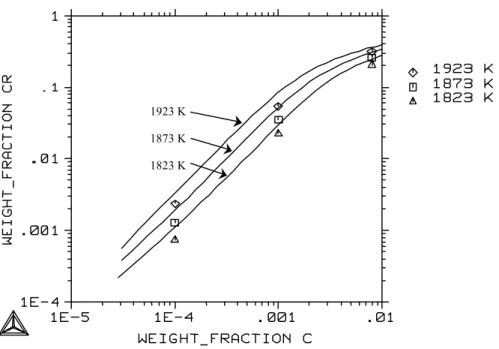
The activity coefficient of carbon in molten Fe-Cr-O-C alloys is shown in Figure 54 for different chromium contents. Heinz /64/ found that the Cr-C interaction is very strong and affects this behavior at higher carbon and chromium contents. Activity coefficient of carbon in molten Fe-Cr-C-O alloys in equilibrium with the gas phase at 1823 K.
System Fe-Ni-C-O
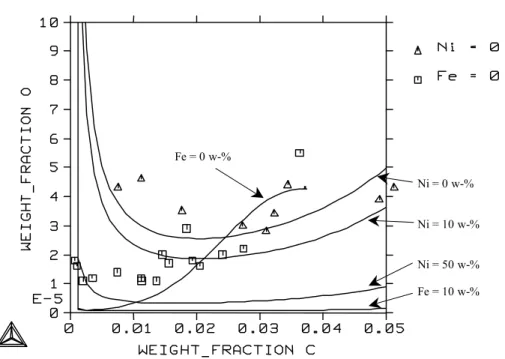
Solubility of oxygen in molten Fe-Ni-C alloys at 2223 K as a function of carbon content at different nickel contents. Solubility of oxygen in molten Fe-Ni-C alloys at 2223 K as a function of nickel content at different carbon contents.
System Cr-Ni-C-O
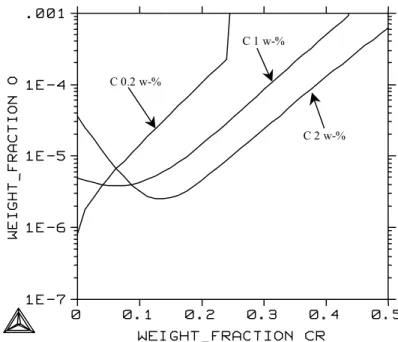
Oxygen solubility in molten Ni-Cr alloys at 1823 K with different carbon contents as a function of chromium content. Oxygen solubility in molten iron as a function of carbon content with different chromium and nickel contents at 1873 K. Oxygen solubility in molten iron at 1873 K in equilibrium with chromium oxide with different chromium and nickel contents.
Solubility of oxygen in molten iron at 2073 K as a function of carbon content with different nickel and chromium contents. With this calculated carbon content, adding the nickel content by 10 w-% will reduce the solubility of oxygen. Solubility of oxygen in molten iron alloys at 1873 K as a function of chromium content with different carbon and nickel contents.
For the solubility of oxygen in the molten Fe-Cr alloy, the estimated parameters gave values that agree quite well with the recent measurements. At higher temperatures there are only a few experimental measurements of oxygen solubility in the liquid phase. Oxygen solubility in molten Fe-Ni alloys in equilibrium with oxide melting has been measured by several authors using three different crucibles.
The solubility of oxygen in molten Cr-Ni alloys over a small temperature range has been measured by several authors. The solubility of oxygen in molten Fe-Cr-Ni alloys was measured by two authors at two temperatures. At higher chromium contents, the solubility of oxygen will increase slightly with increasing nickel content.
The solubility of oxygen in molten Fe-Ni-C alloys was calculated with different nickel contents. The problem with the Ni-C-O system is that the solubility of oxygen is very low at lower carbon and iron levels. The solubility of oxygen in molten Cr-Ni-C alloys was calculated at different nickel contents.
The system Fe-Cr-Ni-C-O was presented by the solubility of oxygen in molten alloys with different metal compositions typical for the production of stainless steel. The solubility of oxygen in equilibrium with CO as a function of carbon content with different chromium and nickel content is shown at two different temperatures.