Title Calculation of spent nuclear fuel composition for secondary nuclear safety analyzes using nodal diffusion neutronics. This thesis is the first study to use micro-depletion methodology in Ants for fuel depletion.
Burnup problem
The burnout matrix is calculated based on decay and neutron induced reaction rates of all nuclides in the system. The matrix exponential in the burnout problem can be efficiently solved with Chebychev Rational Approximation Method (CRAM).
Solution with Monte Carlo neutronics
Monte Carlo method for neutron transport
The accuracy of the solution can be improved by increasing the order of the method [6] and using substeps [7]. The integral (2.4) can be interpreted as an estimate of the expected value of the response function.
Burnup solver in Serpent
However, memory consumption is not related to the MC method, but to the size of the burn-in problem itself. State-of-the-art combustion calculation codes still require a considerable amount of validation work.
Solution with nodal diffusion neutronics
- Formulating the multi-group diffusion equation
- Spatial homogenization
- Micro depletion
- Serpent - Ants calculation sequence
However, regardless of the method, solving for neutron transport in the fuel assembly lattice is the final step for homogenization. For example, the accumulation rate of 239Pu depends on the neutron capture rate of 238U. The capture rate, on the other hand, depends on the efficiency of the moderator, which is determined by the thermohydraulic properties of the moderator.

Geometry
Pins
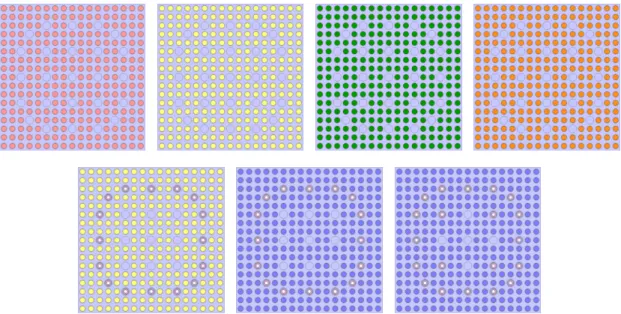
In addition, fuel rods have varying enrichment of the fissile isotope 235U depending on the type of fuel assembly. Each material is represented by a different color and they are listed in adjacent tables starting from the center of the pin.

Assemblies
Full core model
The light blue color represents water and the cyan color represents the radial reflector in the heterogeneous model. Node materials in the homogeneous geometry correspond to their counterparts shown by gray lines in the heterogeneous reactor. The images of the vertical section are not to scale and the division of the fuel into the ten axial nodes is not shown.
The geometry is extended from the bottom by 20.0 cm and the top by 28.124 cm similar to the radial geometry. Regions below the core are represented by two axial reflectors and above the core by three axial reflectors. The small size of the kernel makes the exhaustion with Monte Carlo accessible by reducing the required number of simulated histories to get decent statistics for a reference solution.

Homogenization
- Group constant model
- Fuel homogenization
- Reflector homogenization
- Micro-depletion data generation
However, if the operating conditions are constantly different from the nominal history, it cannot accurately approximate the fuel properties. With different radiation histories, the fuel composition will vary slightly from the nominal history. Thus, radial reflectors can be homogenized using an infinite axial kernel model that separates the homogenization of the reflectors into two different cases.
Reflector nodes were homogenized at the quarter assembly level, and kernel symmetry was used to average the results across nodes in symmetric positions. A disadvantage of the solid core geometry is that the cumulative migration method cannot be used. The extent of the data set depends on the size of the exhaust system.

Depletion calculations
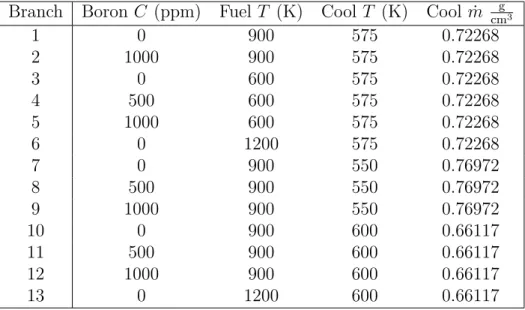
The purpose of the full core depletion is to estimate the feasibility of Miere microdepletion in a realistic reactor application. Approximations in the two-step sequence become more important sources of error in the 3D problem. Differences in node-wise average flux impact response rates which further impact the solution of the depletion problem itself.
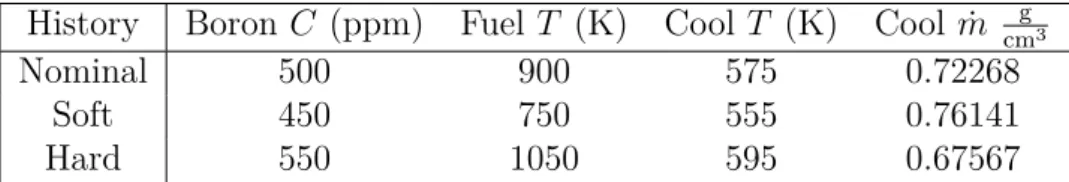
Linking thermal hydraulics to the problem would introduce additional uncertainties of the group constant model tested to some extent in the single assembly 2D problem. The following points were equidistant from the end of the fuel cycle by 64 days. In both calculations, the boron concentration in the coolant was iteratively adjusted to reach criticality.
Processing suitable restart files
A restart file generated by Serpent can be used as is in the subsequent calculation. Number densities in the Serpent model can then be calculated by dividing the nuclide quantities by the material volume in the Serpent. Get material names in the depletion geometry by feeding the point list into Serpent with the -matpos input option.
Get material names in the secondary analysis calculation by importing the score list into Serpent with the -matpos import option. Creating a restart file of Ants results requires material names and volumes in the secondary analysis calculation. Each entry in the new restart file could be read from Ants output, but the total mass density would have required the mass of each nuclide.
Secondary analyses
Average flux and effective multiplication factor
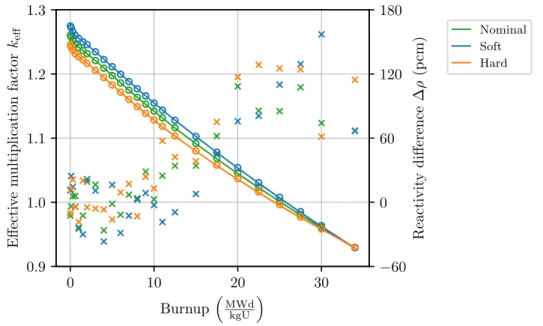
The effective multiplication factor of the two-dimensional fuel composition depletion in the infinite grid is shown in figure 4.1. Histories with soft and hard neutron spectra have higher and lower multiplication factors compared to the nominal history for all burnout steps except the last one. As fuel is exhausted, the fission reaction rate decreases compared to the neutron loss rate.
Nominal and off-nominal histories perform similarly compared to the nominal history, thus the polynomial parameterization predicts the deviation of group constants from the nominal history well. Unlike the depletion calculation in Serpent, it should be noted that microdepletion results have no feedback to the Ants group constant model if plutonium correction is excluded. Therefore, deviations in the microdepletion results do not propagate back to the flux resolver.
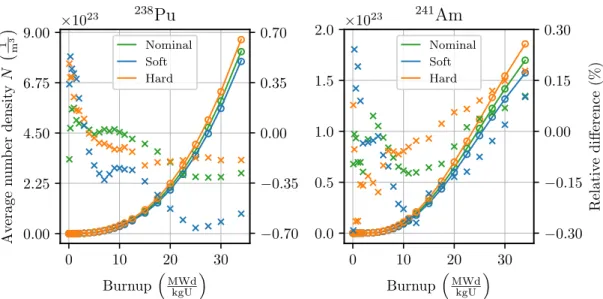
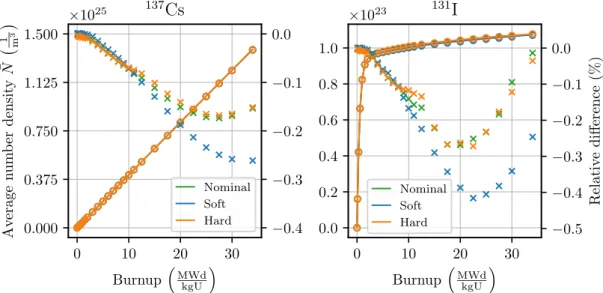
Fuel composition
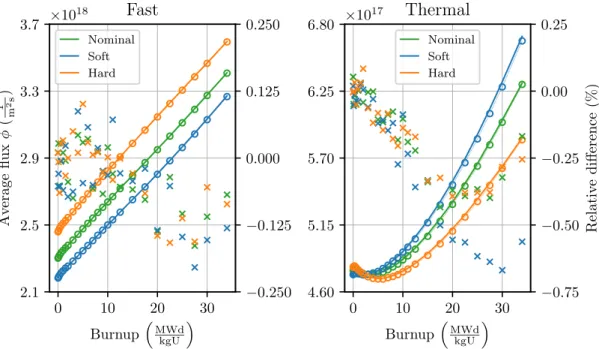
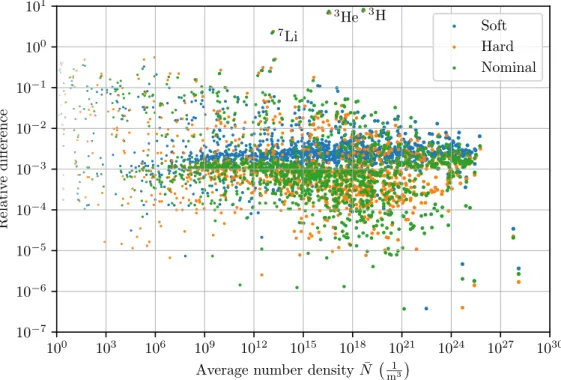
Ants underestimate flux for both groups with higher burnout, but the relative difference is modest. All histories show similar results but the soft spectrum has a slightly larger relative difference in the thermal group. Mass of all nuclides has a relative difference of 10−4 to 10−2, as already seen from figure 4.3.
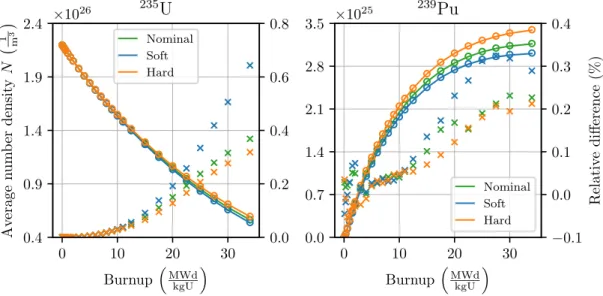
The history of soft depletion has a larger relative difference, probably due to the underestimation of the thermal neutron flux. Figure 4.2 shows that the relative difference in thermal flux is greater for soft histories than the other two histories. Ants accurately models this behavior and the relative difference for both nuclides is up to 0.7% compared to Serpent.
Spent fuel assembly-level properties
Gamma-radiation field
The gamma-ray field within a radius of one meter from the fuel assembly is visualized by a two-dimensional dose-rate distribution in Figure 4.14. The dose rate distribution calculated with the low-fidelity series corresponds to the reference solution within a few percent. A comparison of the dose rate at a distance of one meter from the assembly center is shown in figure 4.15.
The dose rate is underestimated by 0.5 % when the assembly lies perpendicular to the measurement point and increases smoothly as the assembly rotates. Therefore, the gamma dose rate distribution from the low-fidelity sequence deviated only slightly from the reference. Although the net gamma source rate was underestimated by 0.16%, the average dose rate one meter away from the assembly was overestimated by 1.1.

Average flux and critical boron concentration
The difference for the red is initially +1.3 % and it gradually decreases and reaches a minimum at the end of the cycle around -0.9. It is shown at the beginning of the cycle (BOC), the middle of the cycle (MOC) and the end of the cycle (EOC). The bottom of the active fuel region is at 0 cm and the top is at 200 cm.
In this study, restart files for secondary analyzes are created based on the sixth node from the bottom of the active fuel region, so the middle part of the core is specifically of interest. Otherwise, the node-wise mean flux at the centerline is overestimated for the three studied cases. In general, the homogeneous flux solution is more axially and radially pointed towards the center of the core compared to the heterogeneous flux.

Fuel composition
Based on the scatterplot, the orange assembly at the core periphery has a generally higher relative difference compared to the whole-core average and the red assembly. At the whole core level, 75% of all nuclides had higher number density compared to the reference. Next, the average number density of a few selected nuclides is compared to the reference solution.
Additionally, table 4.6 summarizes the average number density of each nuclide and their relative difference compared to the reference at the end of the fuel cycle. At the end of the fuel cycle, the orange fuel composition has a lower plutonium content compared to the red composition. However, the accumulation rate for the orange composition is lower than the reference leading to a lower content at the end of the cycle.

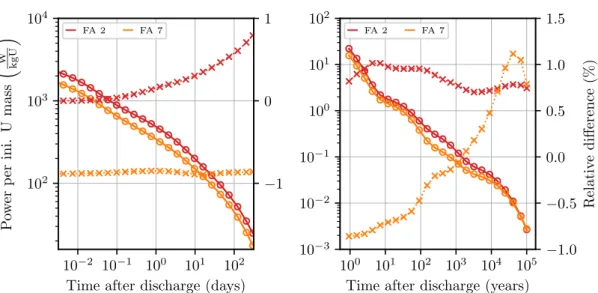
Spent fuel assembly-level properties
The left graph shows predicted values up to one year and the right figure from one year to 105 years after removal from the reactor. Unlike previous graphs, the spontaneous fission rate is shown on a linear scale in the left graph. Contrary to previous results, the spontaneous fission rate has larger differences, as shown in Figure 4.28.
The rate of spontaneous fission is dominated by the smaller, heavier actinides such as americium and curium, and these isotopes are formed by numerous neutron captures and decay reactions. This effect can be observed in the rate of spontaneous separation predicted with the ant-based fuel composition. The spontaneous fission rate deviates from the Serpent-based reference solution by up to three percent.
Gamma-radiation field
The source velocity is underestimated near the center of the assembly and overestimated at the assembly boundaries. The gamma-ray intensity is overestimated for the red assembly with Ants-based results. The average dose rate is determined by the total source rate and the attenuation of the gamma rays.
Despite some limitations, the micro-exhaustion method in Ants in the current development phase is already a great addition to the capability of the code. Kaltiaisenaho, "The Serpent Monte Carlo code: Status, development and applications in 2013," Annals of Nuclear Energy, vol. Leppänen, "On the use of the Serpent Monte Carlo code for pair-group cross section generation," Annals of Nuclear Energy, vol.