The study also examined factors influencing diagnostic costs using regression analysis and analyzed the average diagnostic pathway of a patient with vasculitis. The study showed that, on average, diagnosing patients three months earlier could save a year or €7,375/patient.
Introduction
Background and motivation
This thesis aims to determine the cost-effectiveness of using the algorithm and estimate the potential savings resulting from earlier diagnoses using its clinical decision support.
Research questions
RQ1: How much would costs be reduced if vasculitis were diagnosed three months earlier with the algorithm. RQ2: How should the algorithm be used to improve the production system of diagnosis and prevention of vasculitis.
Scope and structure of the thesis
This is because although the algorithm is likely to detect diseases earlier, its prediction is more accurate closer to diagnosis. The costs of using the algorithm were estimated to be so low that they are unlikely to affect the results.
Literature review
Rare diseases
They stated that vasculitis can be caused by, among other things, an infection or disease or drug use, but the cause is also often unknown. The disease can be diagnosed by biopsy and imaging, but the diagnosis is often difficult and expensive.
Health economic evaluation
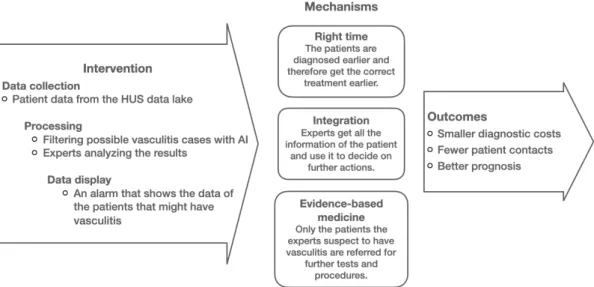
The main focus of this thesis through the PROVE-IT model is to find out how much costs can be reduced (O) when using an algorithm to support the diagnosis of rare diseases (I) and what causes these cost savings (M). According to Drummond et al. 2015), this can be done using the market prices of the hospital that performed the intervention.

Patient delay and misdiagnosis
- Reducing patient delay and misdiagnosis
- Existing decision support systems for rare disease diagnosis
- Increasing cost-effectiveness with decision support systems
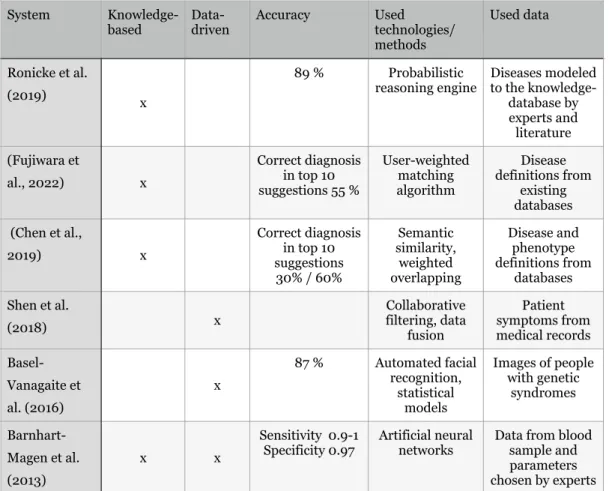
A promising knowledge-based decision support system for rare diseases mentioned by Faviez et al. Summary of the clinical decision support systems described. reasoning engine Diseases modeled for knowledge-.

Rare diseases diagnosis at HUS
Diagnostic path of a rare disease patient at HUS
The nodes in the figure represent the departments the patient visited, and the edges illustrate how the patient was transferred from one department to another. Some transfer loops may be normal and expected, as the patient may need, for example, a laboratory test that is not provided by the referring department. However, many unnecessary referrals are likely due to errors, such as clinicians not knowing where best to refer a patient.
Numerous visits to different departments and long waiting times are expensive and have a negative impact on the patient's life. However, often each specialist treats only the problem that concerns their area of expertise and provides temporary relief to the patient, not realizing that a more important underlying condition is causing all the unusual symptoms. Seppänen (2022) stated that vasculitides are usually diagnosed on the basis of blood samples, biopsies or by a specialist who can see from the patient's medical history.

Decision support system for rare disease diagnosis
The algorithm is novel due to its use of collaborative filtering, typical diagnostic closures, and patient pathways along with expert judgment. Because of this, the algorithm can be tested as if it were in a real clinical setting. The goal is that in the future the algorithm can be used to process patient data and spot patients who may have vasculitis.
This information can be used to screen these patients and diagnose them earlier than without the intervention of the algorithm. Currently, the algorithm is still in development and some changes in the law need to happen before it can be used. Additionally, the algorithm's user interface and workflows for responding to its notifications have not yet been designed.
Research data and methods
Data collection
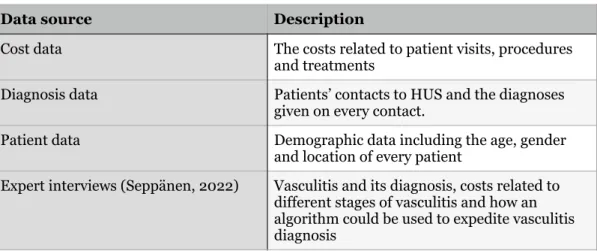
Data in the HUS data lake can be structured, unstructured and binary, such as images and audio. The purpose of the interviews was to obtain a professional opinion on the selection of costs to be included in the cost calculation. Seppänen also gave their views on how the algorithm can be used in the production system of rare disease diagnostics.
Data were imported from the data lake into the AzureML environment in the HUS Researcher Virtual Workspace. Each patient was assigned a diagnosis and date of diagnosis by selecting the first diagnosis of vasculitis and its date in the diagnosis data. Some lines in the expense data had unusual end dates several years after the start dates.
Patient sample
Each patient's cost data was filtered to include rows with cost data whose start or end date was within the three months before diagnosis. Most of these lines were minor procedures costing less than €1,000, so the end dates were probably mislabeled. Therefore, the end dates of these low-cost lines have been changed to match their start dates.
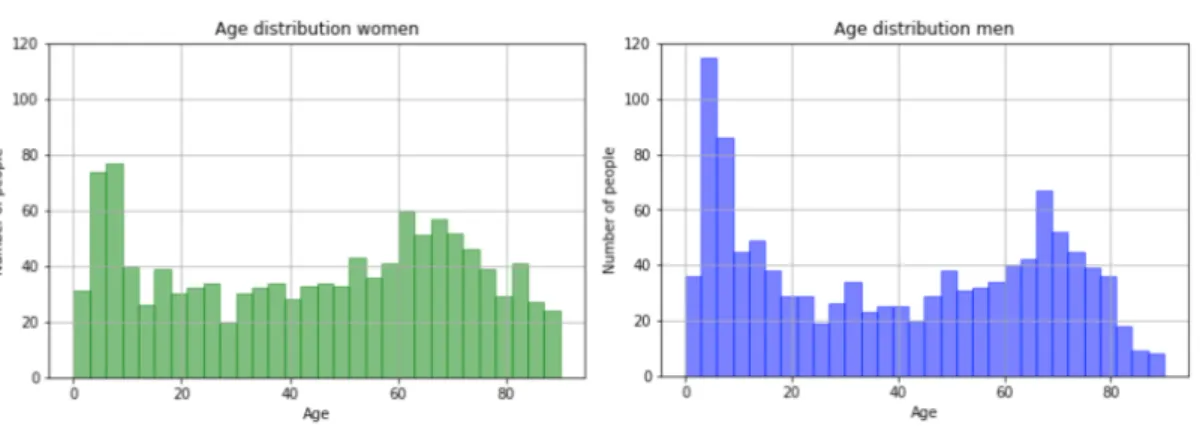
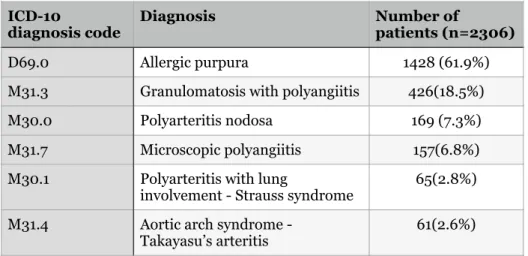
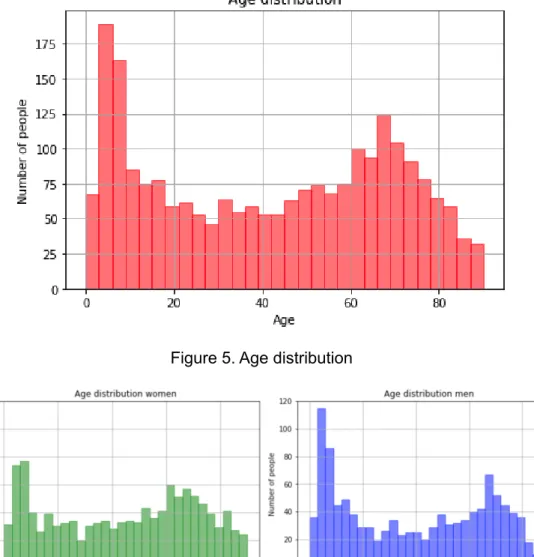
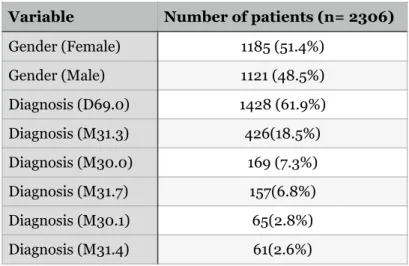
In the most expensive lines, the end dates were changed to a maximum of one year after the start date. The age distribution can be seen in figure 5, and the age distribution by gender can be seen in figure 6. The most common diagnosis was allergic purpura which was the diagnosis for 61.9% of patients.
Research design and methods
- Cost calculations
- Regression models
- Qualitative analysis
As recommended in ABC (Lievens et al., 2003), each activity in the pathway was assigned a cost, and the total cost of each patient's diagnostic process was calculated as the sum of these activity costs. All patient contacts that were even partially within the 3-month analysis period were included in the cost calculation. A regression analysis was performed to better understand the cost structure and variables affecting total costs and to answer RQ1.2.
The total costs per patient three months before diagnosis was assigned as the dependent variable in the regression model. One vasculitis diagnosis group was selected and the distribution of the number of patient contacts and their total costs were examined. The patient with an average number of contacts and the total cost closest to the average was selected to describe the average path of a vasculitis patient.

Results
Cost savings and the structure of the diagnostic process of vasculitis 32
The costs for male patients were on average about 26% higher than the costs for female patients. Average costs accumulated fairly steadily over the last three months before diagnosis until the last two days, when costs peaked. The most expensive category was hospital care, accounting for almost half of the average patient's costs.
If outpatient care and visits are combined, they become the second largest group forming 20.6% of total costs. All these costs include hospital room costs, staff labor and other fixed hospital costs. These procedures can also be part of the diagnosis, such as taking tissue samples or cutting open a patient to see the problem inside them.
Factors affecting the total costs of the treatment path
The diagnosis D69.0 had the highest negative correlation (-0.31) with the total cost, while the diagnosis M31.3 had the highest positive correlation (0.27) with the total cost. First, a linear regression model (OLS) was used to study the relationship between the patient characteristics and the total cost 3 months before the diagnosis. An adjusted prediction plot was created to better describe the non-linear relationship between the variables and the total cost.
The prediction plot was calculated by adjusting the sex and diagnosis variables and using the GLM to predict total costs in relation to age. It shows that the total costs depend strongly on the diagnosis and increase exponentially with the age of the patient. The adjusted predictions were only accurate for costs less than €30,000, but there were cases where patients had total costs of more than €200,000.
Average treatment path of a vasculitis patient
Most of the patients had less than 20 contacts, but there were also patients with several dozen of them. Each row includes the type of contact, the working diagnosis that was the reason for the contact, and the department where the contact occurred. The selected average patient was the patient who had the average number of contacts and the total cost closest to the average (7375€).
Their treatment journey in the last three months before diagnosis is shown in Figure 19. Twenty-eight days before diagnosis, the patient visited a health care provider, and three days later was referred to another department. The costs of the activities that started on the day of diagnosis totaled €4,876, which is 62% of all patient costs in the analysis period of three months.

Discussion
Treatment path of a vasculitis patient and its costs
The average cost of the last three months of a vasculitis patient trajectory was €7375, and the cost of all vasculitis patients averaged per year. These are the costs that could be saved if the algorithm were used and diagnosis was accelerated by three months. Inpatient care accounted for nearly half of the cost, and the next highest cost groups were inpatient care, surgical procedures, and inpatient visits, each accounting for approximately 10% of costs.
While Seppänen (2022) acknowledges that it may not be possible to completely eliminate the high peak, as several imaging and studies are needed for the diagnosis, even using the algorithm, the peak could be reduced and occur sooner because the gradual increase in costs would be stopped sooner. The RQ1.3 was: What is the average course of treatment of a vasculitis patient during the last three months before diagnosis. More than half of the total costs were inpatient care, which started on the day of diagnosis.
Using the algorithm to improve the production system of vasculitis
In practice, the algorithm would often process all patient data of those who visited HUS in the last three months. An algorithm could access data in a data lake and analyze it automatically without human intervention. In the future, costs should be calculated using an algorithm to determine the period of analysis.
Using the algorithm in diagnosing diseases other than vasculitis would also be useful. In this thesis, the cost-saving potential of the vasculitis diagnosis algorithm has been investigated. The results of the study suggest that using the algorithm can lead to significant cost savings.