This study started by meeting the company manager about the topic in February 2015. The final result is a tool which can be useful to understand the cost and profitability of the firm as a whole.
Background and project problem
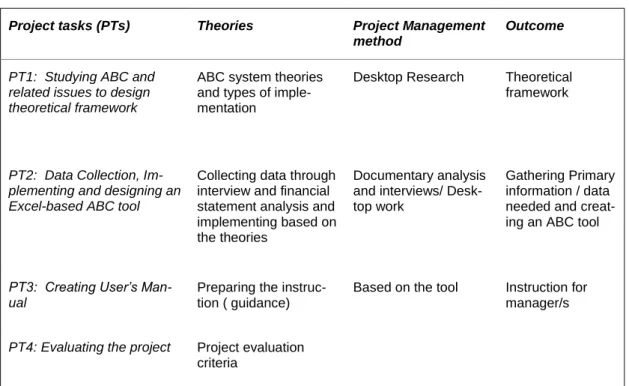
Project objectives and tasks
Internationalization and project risks
Demarcation
The project result
Stakeholder benefits
Haaga-Helia can benefit from understanding the level of efficiency and practicality of the current training system. However, the author can benefit more by applying his theoretical knowledge and gaining experience and using it in his future career.
Key concepts
EBIT: Earnings before interest and taxes, is a profit obtained from revenues minus Cost of goods sold and operating expenses.
Education and Training industry
Case company
Structure of the project
As Figure 3 on the next page shows, direct costs are displaced by increases in indirect costs. Therefore, the traditional costing system is not applicable because of the increasing overhead costs that are not allocated to the products or services, and therefore the decision makers will be misguided in the decision making process.
ABC definition
Furthermore, he has mentioned that it is not necessary to fully integrate the ABC system into the company, but it must be effective. An activity-based costing system can be successful if it starts with precisely well-defined and measured costs, to correctly reflect the cause and effect relationship between the products/services, activities and costs, and is used correctly (Hicks 1999, 27).
ABC in service sectors
Hicks mentioned that to have a useful business benefit for any organization of different sizes, ABC must be treated as a concept, creating an economic business model in which accurate and relevant cost information is provided to support all the types of decisions made by an organization. . Since the consumption of resources such as direct labor costs and overhead varies from customer to customer, proper cost tracking and allocation enables firms to assess and analyze the profitability of each customer.
Advantages and disadvantages
Costs and cost behavior
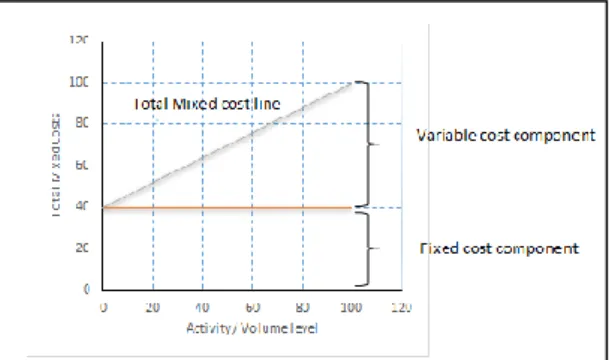
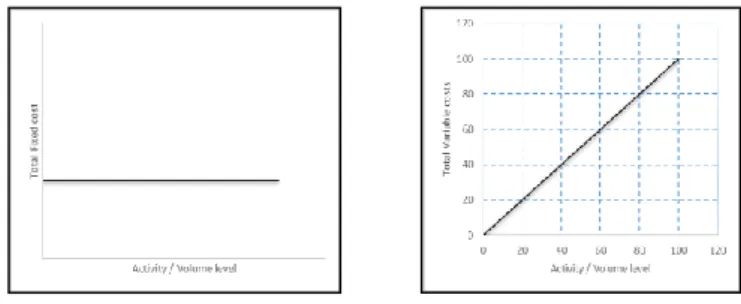
In these types, the fixed costs remain the same, but the variable costs change in the relevant activity range or volume level. Thus, by increasing the number of activities or volume, total mixed costs increase as variable costs increase and decrease as the components of fixed costs remain the same.
Elements of Cost
Overheads
The classification is based on Indirect Materials, Indirect Wages and Indirect Expenses. Furthermore, overheads can be classified based on the behavior of costs which are fixed, variable and mixed.
Sources of data collection
Key components of Activity-Based Costing
However, if activity drivers are the same for some activities, it is possible to combine activities (Bahnub 2010, 4.).
Implementation Guidelines and Steps
Tables are generated with manipulated figures from the income statement and interviewing the manager of the company. The process started with interviewing the general manager of the company, to understand the structure and requirements of the company from the tool and the sophisticated costing system.

Discussion
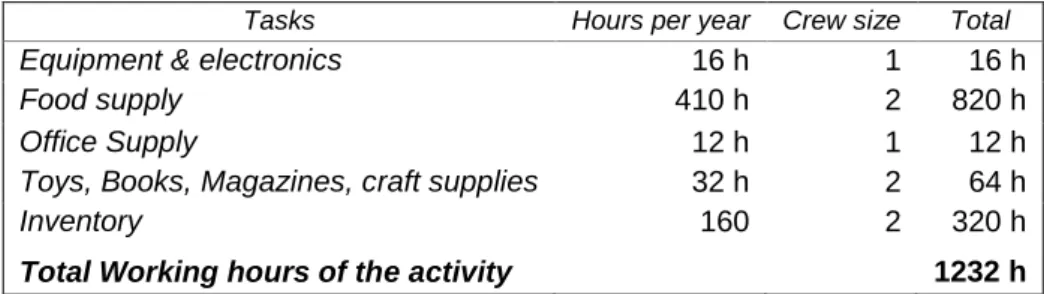
Then, all information related to the topic was collected and analyzed according to ABC implementation steps and company requirements. With the start of the training season in mid-August, the management team at the head office is engaged in several activities to ensure sufficient services for each individual site. The company not only records the working hours every day, but also checks the inventory to see if anything needs to be added to the shopping list.
Thus, the total working time spent on accounting activity is 684 hours for two people per year. Food supplies are bought twice a week, which corresponds to 10 working hours, which will be 410 hours for a year. Purchased materials and supplies are stored in the main office and use 60% of the office space, leaving the remaining 40% for managerial activities.
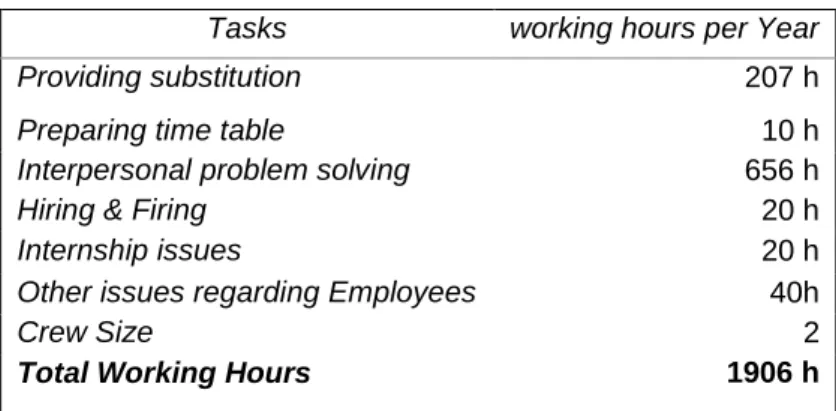
In this activity, the head office is engaged in providing temps, which takes 201 hours, interpersonal problem solving takes 656 work hours, and scheduling, hiring and firing, internships, and other issues, which together require 90 work hours. Transportation activity is required to deliver supplies to operating locations and purchase the supplies.

Cost and cost behavior of the company
Another purpose is to move employees from one place to another in connection with, for example, meetings with families and congregation or internal company meetings. Then it's time to close the books and open a new book for the next grade. During the summer, the operating sites are closed, but the main office is open and the owner and general manager work on planning, scheduling and other business related matters.
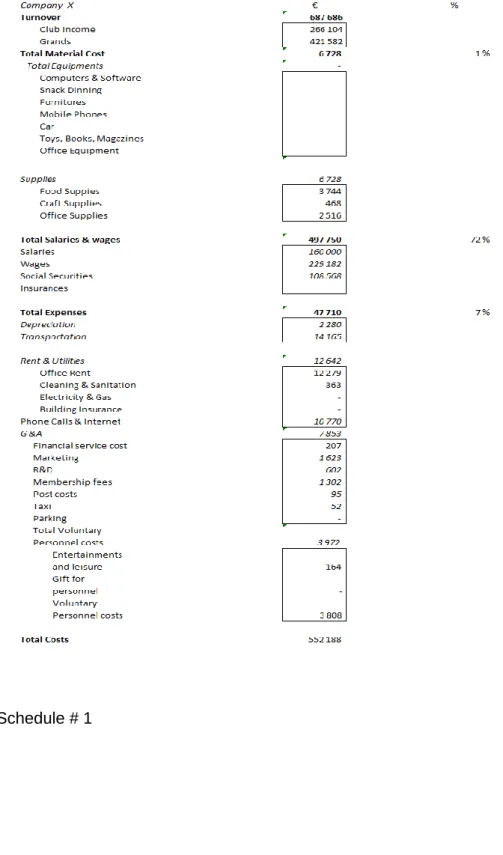
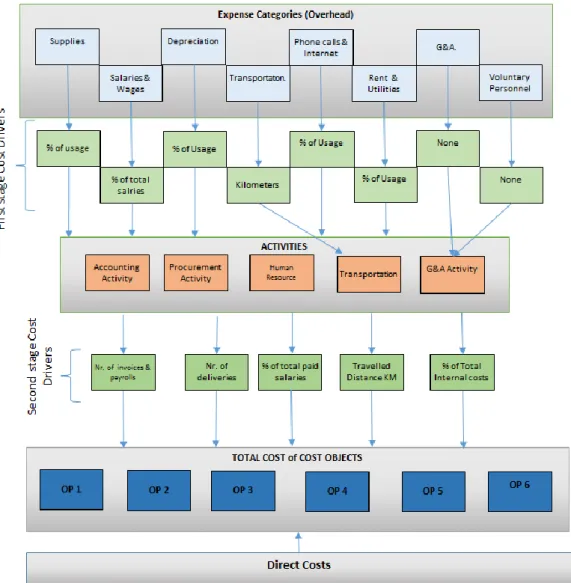
As shown in Table 6, costs are further broken down into Supplies (Food, Office, Handicrafts and Other), Salaries & Wages (salaries, Wages, Social Security, Personal Insurance), Depreciation, Transport, Calling & Internet, Rent & Utilities (Office Rent , Cleaning & Plumbing, Electricity & Gas, Home Insurance), G&A (Marketing, Membership, Financial Services, Taxi Costs, Parking Costs, R&D, Postal Costs) and Voluntary Staff Costs (Gifts, Entertainment Costs, Leisure Activities, Work Clothes.
Implementation Steps and Designing the tool
- Identifying Cost objects
- Identifying Direct Costs of Cost objects
- Identifying activities and allocation bases for allocating indirect costs to
- Identifying costs of activities
- Computing the rate per unit of cost allocation bases
- Computing indirect costs of cost objects
- Adding direct and indirect costs of each cost object
Direct costs for all the locations are identified by analyzing the income statement and interviewing the general manager of the company. Since the only available information was income statement, direct costs of the OPs must be calculated through certain calculations. Food supplies and crafts are divided based on the number of children and office supplies are divided based on the total number of persons (No. Children + No. Employees) of the locations.
Then the result of the average hourly salary is multiplied by the 17,000 total working hours of places in the schedule # 3.1. To mention that the euro amount of calls and internet is obtained based on an assumption that all the operating locations and head office have an equal share of the total calls and internet in the income statement. The result of this Schedule will be reduced from the total cost of the income statement which will give us the cost of the head office.
In accounting, the main tasks are working with people, such as employees and children of operating sites, so the intensity of the workload depends on the total number of people in the sites. Personnel activity will be allocated to cost items according to the percentage of total salaries paid, since more employees require more effort in performing tasks in this activity. In this list, the indirect costs in € of the head office can be obtained by subtracting the direct costs defined in table #3 from the total costs in the income statement in table #1.
The unit cost rate for drivers is calculated at the bottom of list no. 6, and the result is shown in Table 18.
Profitability Analysis
Conclusion
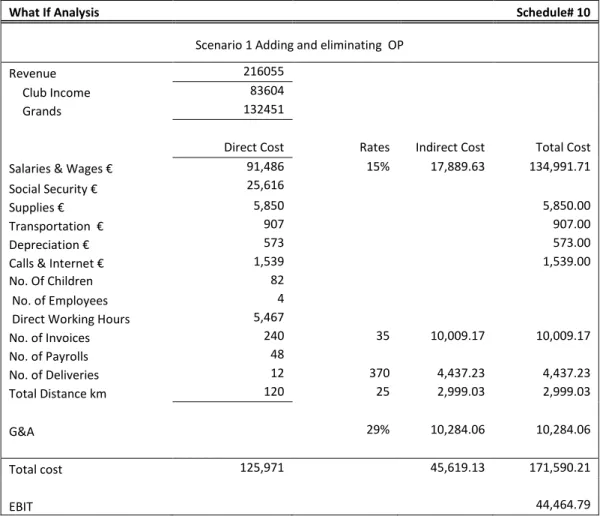
The result of the analysis in chapter 3.4 "profitability analysis" shows that the total revenue of OP no. 6 €39,522, which is 1% of the total revenue of all places. The percentages of totals without OP# 6 show that there would be no significant change in the result of total costs, which still represent 80% of total revenue, and total EBIT, which is 20%. As shown in the table, the final percentages do not change at all after adding new locations, as total costs (direct + indirect) still remain at 80% of total revenue and EBIT at 20%.
The increase in indirect cost indicates whether the current head office staff must work over time or new staff to be recruited specifically for managerial activities. After going through the process of creating the tool and analyzing the company's activities and business process, it is strongly recommended that the company uses more tools such as budgeting, internal accounting, and so on to track the incurred costs of the business. Despite activity-based costing which is only a tool for calculating and allocating overhead to cost objects, activity-based management helps the company reform its costing system and provides managers with how to understand the outcome of the ABC system tool.
However, it is not possible to explain all the learning and knowledge I gained through this project, but I will mention some of the most important ones. Timing: It is fundamental to be precise and set a deadline for each step of the project plan.
45
46
47
Then you have to insert year start and end. Kilometers traveled to get the total annual distance traveled in the year. At the bottom you will see the total amounts used and spent at operating locations and the head office. In schedule # 2.1, you must insert the total planned depreciation from income statement and the total equipment or any other available depreciation amount.
In schedule no. 2.3 enter your actual or estimated average hourly wage, then you will see the Social Security percentage of wages paid and the total and Social Security paid for each position. As a result, you will get the total direct costs of the cost objects and the total cost sources. At the bottom of this schedule, under total activity costs, you will see the activity cost drivers and the unit rate of the cost driver calculation engine.
You can see, for example, that the cost driver of the activity for accounting is the Number of payrolls and invoices, the total cost divisors are 1224 (in schedule No. 3.1) and the rate per unit of the cost driver is 35. In the last column, the total is Cost € represents the sum of all costs of the activity of each place, which in our case is €37,241 for OP #1. Please note that if you see "Error" in the total activity, it means that there is a calculation problem and the activity total is not equal to the total cost of the activity calculated in schedule no. 6.
After entering the numbers you will see the indirect cost calculated based on the previously calculated rates as well as the total cost and Earnings before interest and tax (EBIT).