The idea of this thesis was to collect financial metrics from each functional department as well as city level. Once it was designed, the draft of the developed dashboard was presented to the financial director as well as the budget manager of Vantaa City. Designing dashboard to depict financial key performance indicators will enable them to understand the overall situation as well as make better decisions.
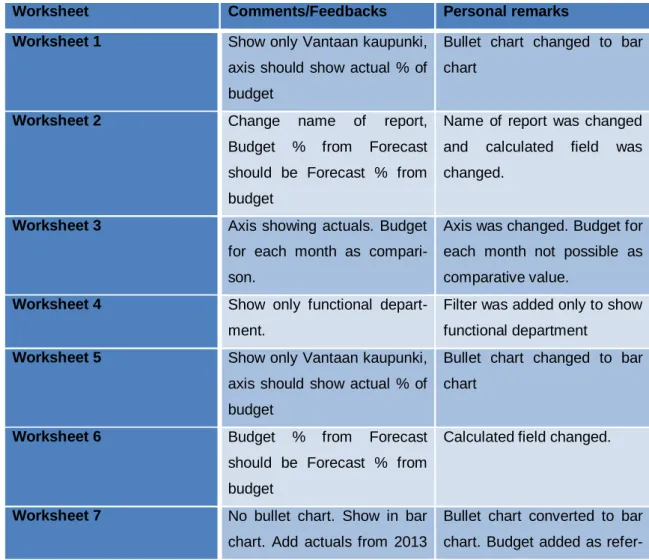
In the final chapter of the thesis, I will discuss the main findings as well as provide recommendations for future implications. It is used to improve internal and external communications, and to monitor the organization's performance against strategic goals. Finally, based on his comments as well as my own reflection, I refined and customized the dashboard as mandated by the CFO.
Finally, I improved and personalized the draft regarding comments and personal mandate for CFO. The purpose of the interviews was to gain an understanding of financial data as well as key financial performance indicators in various departments in Vantaa City. Therefore, I used BEx queries, reports and bookmarks to retrieve transaction and master data from SAP Business Warehouse.
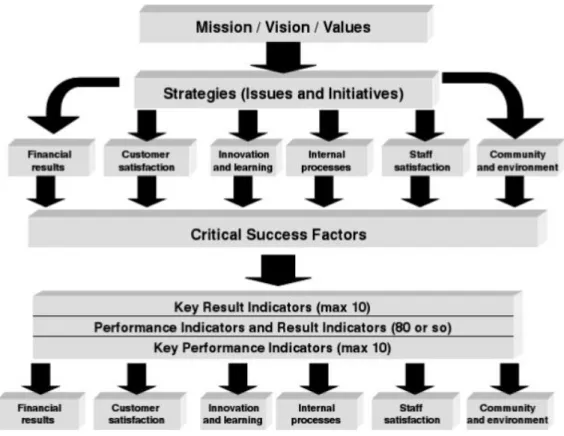
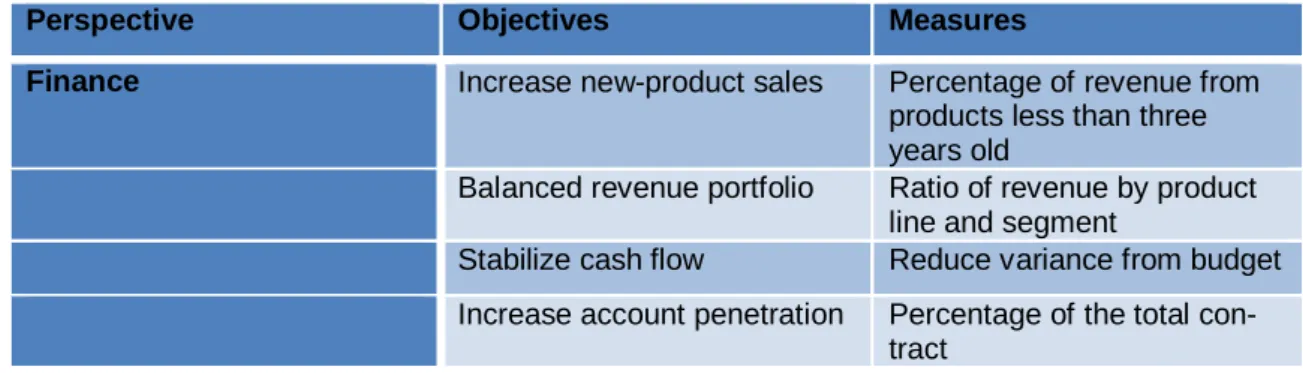
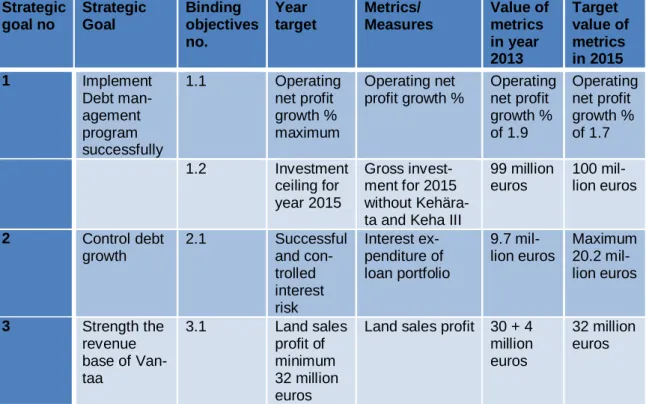
I had knowledge of possible key performance indicators as well as different alternatives to retrieve the data needed for the dashboard. These strategic goals are formally mentioned in the council's strategy as well as informally in the organization. An executive-level table should reflect the enterprise-wide strategic goals mentioned in the scorecard, as well as the relevant key performance indicators.
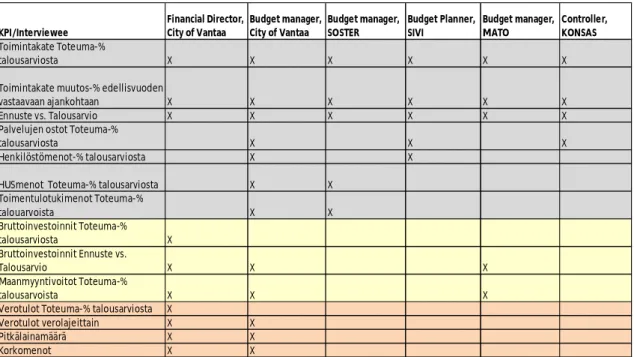
These statistics and indicators were chosen based on interviews and the personal mandate of the financial director at City of Vantaa. Table 5 below shows the list of key performance indicators and their aliases in the Finnish language. Most indicators will have both actual and forecast for at least the next two fiscal years.
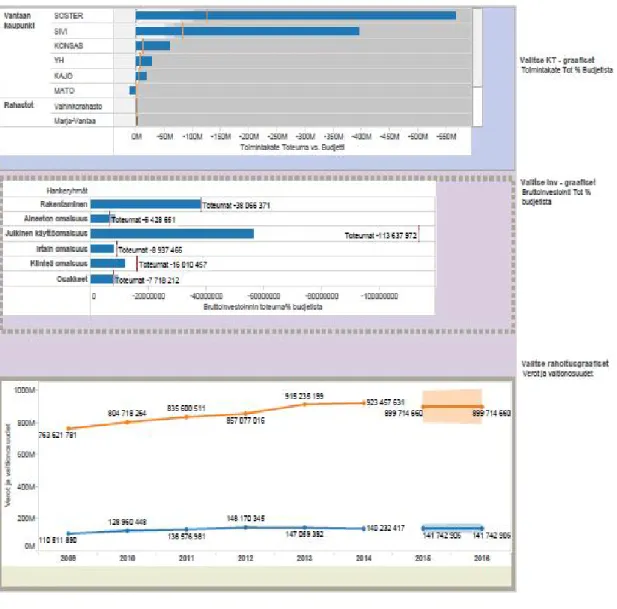
It will also affect the components of the dashboard as well as the final output. Below is Figure 14 showing the nature of operational transactional and master data. Below is Figure 15 showing the nature of investment transaction and master data.
Below is Figure 16 which shows the nature of financial transaction and master data.
Käyttötalouden toimintakatteen toteuma% budjetista
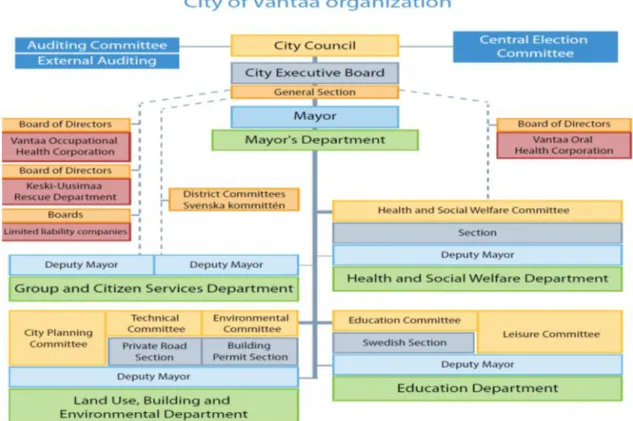
The data is divided according to the companies, as well as the departments that are under each company.
Käyttötalousraportti toimintakatetasolla
Käyttötalouden toimintakatteen kumulatiivinen muutos % viime vuoteen verrattuna
Käyttötalouden toimintakatteen kumulatiivinen muutos % viime vuoteen verrattuna raportti
Käyttötalouden toimintakuluihin toteuma% budjetista
Käyttötalous toimintakuluraportti
Bruttoinvestoinnin toteuma% budjetista
As shown in Figure 21 above, the worksheet shows the actual gross investment in % compared to the budget.
Bruttoinvestointiraportti
Maanmyyntivoitto
Maanmyyntivoittoraportti
Verojen ja valtionosuuksien toteumat ja ennusteet
Verojen ja valtionosuuksien toteumat ja ennusteet raportti
Pitkäaikaisten lainojen toteumat ja ennusteet
Pitkäaikaisten lainojen toteumat ja ennusteet raportti
As shown in Table 12 above, the worksheet shows actual long-term loan balances from 2010 to 2014.
Korkomenojen toteuma ja ennuste
Korkomenojen toteuma ja ennusteraportti
Graafiset
The advantage of using bookmarks is that it always opens the panel in the default view that has been selected by the end user. The end user always sees the name of the graphic they selected from the drop-down lists. So it serves the purpose of the graphic title that is currently visible in the control panel.
As mentioned in the literature, there is no need to have logos in the dashboard unless it's related to copyright issues or the company's brand.
Taulukot
As shown in Figure 28 above, the Info tab contains information related to the control panels and instructions for using them. After the changes were made, I printed the worksheet and dashboards and presented them to both participants. The purpose of this meeting was to gather feedback and personal comments on the measurements, components, design and usability of the dashboard.
I added more information about the date the data was updated, as well as some exceptions to the running data. This chapter describes the summary of the thesis, connects the results with the previous chapters and offers some conclusions. It was found that the strategy of the city of Vantaa has financial metrics as well as key performance indicators.
I also found that KPIs are mainly focused on operating income, investment cap, long-term loan and interest expense. These indicators are periodically reported to the City Council and the Board of Directors of the City of Vantaa. Executive-level managers are interested in actual and forecast trends in finance.
The content of dashboards may need to be personalized and the accuracy of data checked on a regular basis. It would give them the chance to understand the trends, pinpoint problems and take action to achieve the goals. Because Vantaa didn't have an Open hub license, I couldn't experiment with the data flow automation from SAP and the reporting tools.
At this stage, we need to create separate views for mobile phones, tablets, laptops, and desktop devices. The future implications could be a research project solely focused on developing dashboards in different reporting tools and comparing them. As understood, Vantaa will purchase an Open hub license in the near future which will ensure the automation of SAP data flow and reporting tools.