Deformation and movement are among the most important parameters that describe the functions of the heart [4, 5, 6]. The study of heart deformation and motion is where materials science and various cardiac sciences intersect.
![Figure 1. Anatomy of the human heart [28].](https://thumb-eu.123doks.com/thumbv2/9pdfco/1890058.266224/20.748.255.513.573.740/figure-anatomy-human-heart.webp)
Echocardiography
Tissue Doppler imaging
The speed of the wall motion is slower, and the Doppler signal intensity due to the wall motion is higher [41]. Thus, the estimation of the deformation rate is possible as long as the velocity of two points and the distance between them are available [42].
![Figure 3. Examples of a) strain rate and b) tissue velocity TDI measurements [44] . The function of the heart can be assessed by TDI in a variety of ways, such as by analyzing the strain rate and estimating the filling pressure of the LV [45, 44]](https://thumb-eu.123doks.com/thumbv2/9pdfco/1890058.266224/25.748.122.616.276.469/examples-velocity-measurements-function-assessed-analyzing-estimating-pressure.webp)
Speckle tracking echocardiography
When a structure is subjected to various forms of loading, the loading manifests itself as a disturbance on the outer surface of the material. Measuring and analyzing any changes on the surface of the material can provide a better understanding of its mechanical behavior.
Operating Principles of DIC
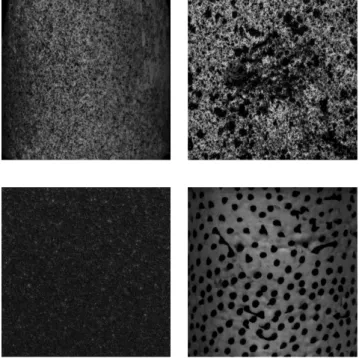
- Contrast patterns
- Image processing and deformation analysis using DIC
- Stereoscopic DIC
- Spatial resolution of DIC
- Strain resolution
- Subset size
- Step size
However, the shape of the subset changes when the target object is deformed during the experiment. Therefore, the choice of the subset size is always a compromise between accuracy (low noise) and spatial resolution (small VSG).
![Figure 6. A typical DIC system [60] .](https://thumb-eu.123doks.com/thumbv2/9pdfco/1890058.266224/30.748.137.628.87.317/figure-a-typical-dic-system.webp)
Error Sources and Uncertainty Quantification
- Correlation errors
- Errors caused by the speckle pattern
- Lens distortion
- Lighting
- Out-of-plane movements and misalignments of optical
In practice, the optimal step size, similar to the size of the subset, depends on the speckle pattern and the degree of heterogeneity of the deformation [83]. Noise can be introduced by the camera's sensor or by mechanical vibrations of the metering system. In addition, small specks are more sensitive to tuning variations due to camera noise and gray level fluctuations.
A uniform and sufficient illumination during image acquisition is essential for successful image correlation. Out-of-plane movement of the specimen can be either in the form of perpendicular distance from the cameras or a rotation in the specimen.
![Figure 16. Effect of aliasing on the digitization of speckles [88].](https://thumb-eu.123doks.com/thumbv2/9pdfco/1890058.266224/43.748.249.521.621.903/figure-effect-aliasing-digitization-speckles.webp)
Uncertainty Quantification
Noise floor detection
Deviations from this optimal angle can occur during the setup phase or during loading due to the non-uniform movement/deformation of the specimen. A simple experiment exists that can calculate possible errors caused by the sample's out-of-plane motion or optical axis misalignment: if the sample undergoes only rigid-body translation, the measured strain should be zero. Consequently, the presence of a voltage measurement is a sign of measurement error, and its magnitude reflects the magnitude of the error in the experiment.
This includes feedback of any changes in camera location or test subject location, as well as lighting in the test environment. The next step is to take static images of the test subject, preferably with the same frame rate, image size, exposure time, etc.
Intrinsic parameters
The process of noise floor detection involves returning the test setup to the original test condition in case any changes were made during the calibration. These images should be reviewed for any problems (poor lighting, glare, non-optimal speckle pattern, camera(s) vibration, etc.). It should include both translation and rotation, at least within the limits expected during the experiment.
Extrinsic parameters
Because of this error, the triangulated projections will not return to the same exact image locations. The stereo reconstruction error is therefore used to describe the accuracy and reliability of the calibration and correlation processes. Usually, the static and/or rotational images captured in Section 4.3.1 are correlated to see if the reconstruction error threshold is within acceptable limits according to the DIC software documents.
DIC for Biological Materials
However, an accurate assessment of the deformation using DIC analysis requires a suitable high-contrast pattern on the target surface. The most crucial property of the materials used to pattern the heart is non-toxicity. In addition, the method of applying the pattern to the surface of the heart must be quick without any preparation requirements and easy to use.
During this period, not much was done in terms of analyzing the results. A summary of the operations and DIC experiments analyzed in this thesis is presented in Table 1.
![Figure 18. a) a healthy heart [112], and b) a fatty heart [113] .](https://thumb-eu.123doks.com/thumbv2/9pdfco/1890058.266224/53.748.133.626.104.363/figure-healthy-heart-b-fatty-heart.webp)
Contrast patterns
43 . moves very 'sideways' and a large portion of the heart moves below the sternum and out of view, leaving only a small portion visible during the full cycle. The movement of the heart back and forth under the sternum further weakened the contrast pattern. In many cases the contrast pattern was reapplied for the later imaging stages, but for some reason the surface of the heart appeared to change during surgery and the ink would not adhere as well to the surface.
As a result, the pin would only create large smeared regions compared to the sharp dots at the beginning of the operation. a b.
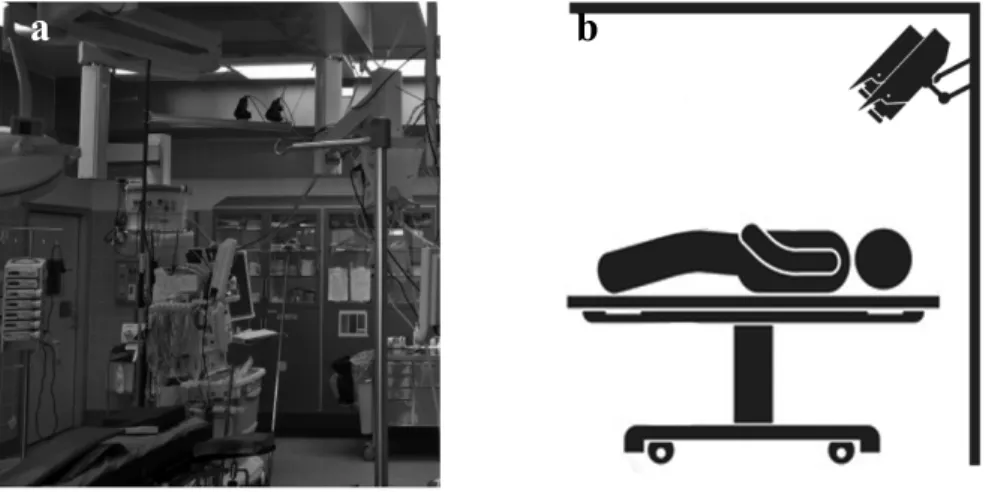
Image Acquisition in the Operation Room
It was not possible to use the DIC setup's lighting system in the operating room. The distance between the cameras and the operating table was quite long, and the intense flashing of the lights could have interfered with the tasks of the medical staff. However, an accurate pre-calculation of the patient's heart height on the operating table was impossible.
Therefore, the distance between the cameras and the surface of the heart was not precisely known when performing the calibration. The obtained calibration was then numerically transformed to the surface of the heart so that the mean Z coordinate was zero in the first image.
Digital Image Correlation Analysis
Processing millions of displacement vectors in each frame would require excessive computing power. On the other hand, using a very large step size would allow only small areas to be analyzed at a time, or require the use of several (hundreds or thousands) starting points from which to start image matching.
Orthogonal decomposition
Therefore, the image data may not allow the calculation of the displacement in the preferred region of interest. In this work, image decomposition using shape descriptors was used to quantify the heat map images of the RV. In image analysis, a moment is a weighted average of the pixels contained in an image.
Processing the deformation heatmap images is fairly straightforward, the only major variable being the number of decomposition coefficients. To assess the accuracy of the process, the decomposition moments can be used to reconstruct the original image.

Strain measurements
For operations #1 (Figure 25a) and #3 (Figure 25c), the duration of the four heartbeats in all three stages is relatively close to each other, with 3.5s and 2.5s, respectively. However, the difference between the duration of the four heartbeats between the different stages is much more pronounced for operation #2 (Figure 25b). The effect of the surgical repair also causes a different response in the DIC and STE strain measurements.
The peak values of the longitudinal strain obtained with STE decrease from the native stage to the post-CPB, while this drop is only seen in two of the four recorded cardiac cycles of the same stage with the DIC measurements. The effect of the repairs is similar in both graphs and is accompanied by a drop in the peak strain values from the original to the post-CPB stage.

Strain rate measurements
Voltage as a function of time for operation #1 a) DIC b) STE and for operation #2. Strain rate as a function of time for operation #1 a) DIC b) STE and for operation #2.
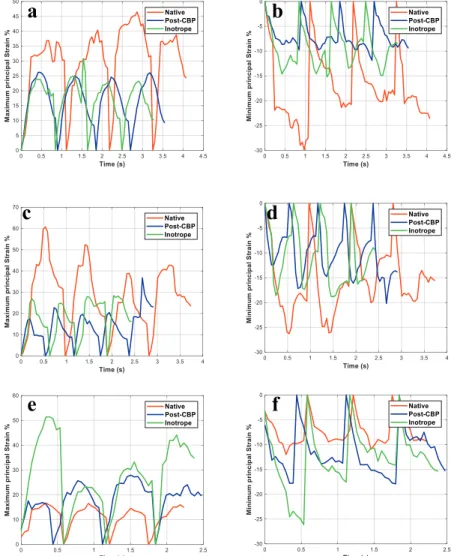
Principal strain measurements
Unlike in the first two cases, the repair in surgery #3 increases the peak values for ɛ.(/ (e) and ɛ.01(f), while the inotrope causes an increase in the peak values for both main strains compared to the post-CPB stage a b.
Length of the displacement vector
Characterization of the Anisotropy of the Deformation of the Right
In this chapter, the stress of the heart is measured with the virtual extensometer placed in different places and directions to quantify the anisotropic behavior of the heart. Consequently, the placement of the virtual extensometer can markedly affect the stress measurements, depending on whether the endpoints are located in a location with high or low strain values. In comparison, the stresses in all three directions for the case shown in Figure 31b are more or less the same for each cycle, and the elongation of the heart's surface is almost isotropic over the ROI.
Depending on the patient's physiological characteristics, there is more than just the right ventricle visible in the ROI of the DIC images. The DIC image in Figure 23c contains the RV in the upper part of the image, and at least partially the right atrium (RA) in the lower part of the image.
Orthogonal Image Decomposition
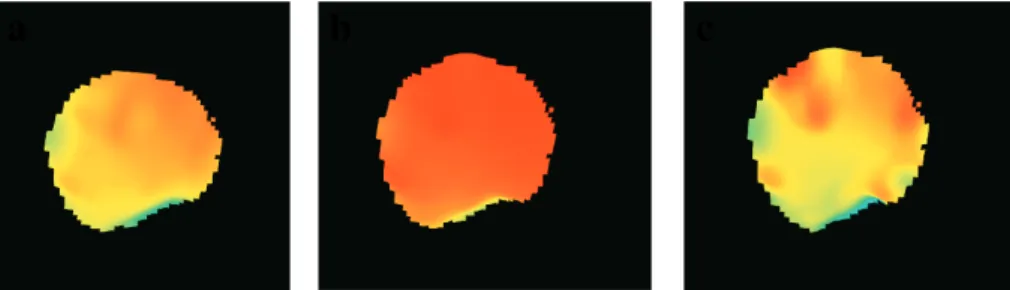
Image type
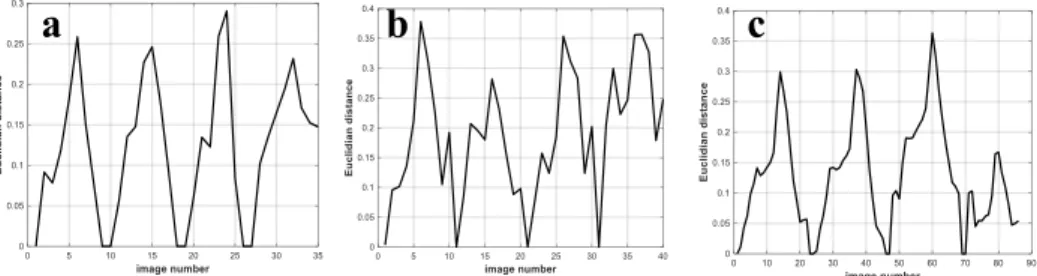
The heat map images of deformation can be made with different color schemes, which can contain a limited range of colors, the full 256 color spectrum or only different shades of gray. In both figures, the peak of each cycle is higher for the grayscale images compared to their raw and smoothed counterparts. Overall, the grayscale images as a source seem somewhat more sensitive to the detection of small changes in the deformation images and behavior of the RV.
Still, the shape of the Euclidean distance plot for the different image sources remains constant over the four heartbeats. a B. Euclidean distance as a function of image number for raw, smoothed, and grayscale images for a) the original stage of surgery #1 and b) the inotropic stage of surgery.

Effect of the number of shape descriptors
Comparison of the Euclidian distance and longitudinal
As in operations #1 and #2, no direct relationship between the Euclidean distance (e) and load data (f) is observed for operation #3. a b.
Quantifying the effect of the surgical repairs using
Clearly, the higher the value, the greater the change in the deformation of the heart from the original stage to the post-CPB stage. However, when first looking at the effect of the repairs to the motorhome. Most stem from the limited access to the surface of the heart and the lighting conditions.
In addition, the anisotropy of the deformation of the heart may even increase in the last stages of the operation. Therefore, a mathematical method was applied to describe the deformation of the heart in its entirety. The use of DIC during open-heart surgery, in addition to conventional echocardiographic methods (TDI, STE), was demonstrated and validated for measuring the deformation of the right ventricle (RV) of the heart.
34; In vivo deformation measurements of the human heart by 3D digital image correlation," Journal of biomechanics, vol.
![Figure 2. An echocardiography image of myocardium annotated with the locations of various chambers [40]](https://thumb-eu.123doks.com/thumbv2/9pdfco/1890058.266224/23.748.213.556.424.676/figure-echocardiography-image-myocardium-annotated-locations-various-chambers.webp)
![Figure 8. Illustration of a subset before and after deformation [69].](https://thumb-eu.123doks.com/thumbv2/9pdfco/1890058.266224/34.748.112.655.87.308/figure-illustration-subset-deformation.webp)
![Figure 9. The effect of angle on the view of each eye [70].](https://thumb-eu.123doks.com/thumbv2/9pdfco/1890058.266224/35.748.287.480.83.300/figure-effect-angle-view-eye.webp)
![Figure 12. Effect of reducing resolution on the image details [74].](https://thumb-eu.123doks.com/thumbv2/9pdfco/1890058.266224/37.748.148.624.85.454/figure-effect-reducing-resolution-image-details.webp)
![Figure 13. Visual representation of VGS and the strain window (SW) [75].](https://thumb-eu.123doks.com/thumbv2/9pdfco/1890058.266224/38.748.229.542.88.411/figure-visual-representation-vgs-strain-window-sw.webp)