This thesis aimed to investigate the temperature sensitivity of biological respiration and CH4 responses to medium-term (14 years) warming in Iceland's geothermal fir forest, along nature. Contrary to expectations, no significant changes in biological fluxes were found within the moderate temperature increase.
Climate change and northern ecosystems
Carbon cycle
Fast carbon cycle
The rapid carbon cycle, also called the biological carbon cycle, takes place in the living matter of the Earth through various life forms and moves carbon between the atmosphere and the biosphere. Carbon dioxide that is released during these reactions usually ends up in the atmosphere again (Riebeek 2011).
Slow carbon cycle
Human impact on carbon cycles
The land biosphere and the ocean together remove about 4 Pg of carbon each year, while out of the 7 Pg C blown into the atmosphere by fossil fuels each year, about 3 Pg C remains in the atmosphere (Kondo et al. 2020). The increase in atmospheric CO2 concentration causes global warming, which is connected to the central question of this thesis: what are the consequences of global warming on the earth's carbon flows.
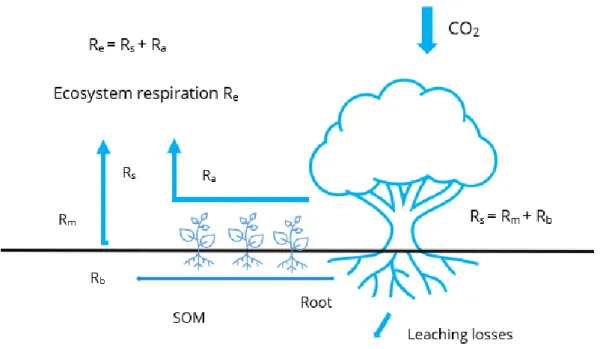
Soil CO 2 fluxes
Biological CO 2 production
It is a key process in soil carbon cycles and represents the second largest carbon flux between terrestrial ecosystems and the atmosphere. Given the large amount of C stocks residing in the soil, even small changes in soil respiration can have significant effects on CO2.
Abiotic CO 2 production
Transport of CO 2 from soils and controlling factors
However, temperature effects were not found to be significant for fungal biomass, microbial biomass or microbial carbon in the long term. Negative Rs rates were found to occur especially in grassland and mixed forest with low SOC stocks and positive Rs rates in the evergreen forest with high SOC stocks (Lei et al. 2021).
Soil CH 4 fluxes
Biological CH 4 production
The optimum is usually when the macropore space is mainly air-filled and the micropore space is mainly water-filled, about 60% of the water-filled total pore space (Luo and Zhou 2006). High soil moisture content correlates with low air-filled pore space, and in soil moisture conditions, high oxygen concentration is usually the primary regulating factor (Luo and Zhou 2006).
Abiotic CH4 production
Transport of CH 4 from soils and controlling factors
Sulfate-rich environments have been shown to inhibit methanogenesis due to the competition of substrates with sulfate reducers (Serrano-Silva et al. 2014). Short-term incubation experiments have proven that CH4 emissions increase with increasing atmospheric CO2 and temperature (Serrano-Silva et al. 2014).
Exchange of CO 2 and CH 4 between atmosphere and soil ecosystem
- Common chamber methods
- Soil gas gradient method
- Other methods for CO 2 and CH 4 flux measurements
- Trenching method
It is not entirely clear when the dead roots stop breathing and the respiration can be considered heterotrophic (Kutsch et al. 2009). In addition, root exclusion has been shown to affect microbial biomass and nitrogen dynamics (Kutsch et al. 2009).
Warming experiments to study temperature sensitivity of CO 2 and CH 4 exchange
Natural warming studies in Iceland and ForHot study sites
These research sites in Iceland have already revealed a piece of valuable information, e.g. on temperature effects on community composition, population abundance, ecosystem functions and food web structures. The earthquake affected the geothermal system close to the epicenter by moving it to a new location. The ForHot research network was established after the 2008 earthquake to study the temperature effects in these areas in natural earth warming experiments.
ForHot is coordinated by the Agricultural University of Iceland and there have already been more than 70 papers published by the. GO is an older geothermal gradient where the first recording of geothermal hot spots was already made in the 60s.
Volcanic areas
Basics of stable isotope approach
Use of stable isotopes in studies of CO 2 and CH 4 fluxes from ecosystems
The Keeling plot approach (Keeling 1958; Maljanen et al. 2020) can be used to calculate the δ13C values of CO2 or CH4 emitted from the surface. The Keeling plot method is based on the regression of δ13C and mixing ratios against background air values. The isotope mixing model can be used to determine the proportions of isotopes from different sources.
With a two-group isotope mixing model, abiotic and biotic sources of CO2 can be determined. Where δ is the isotopic signature of CO2, δ0 is the isotopic signature of the geothermal source and δ1 stands for the biological source.
Study site
Sampling
- Surface CO 2 and CH 4 fluxes
- Surface fluxes for δ 13 C of CO 2 and CH 4
- Soil gas profiles
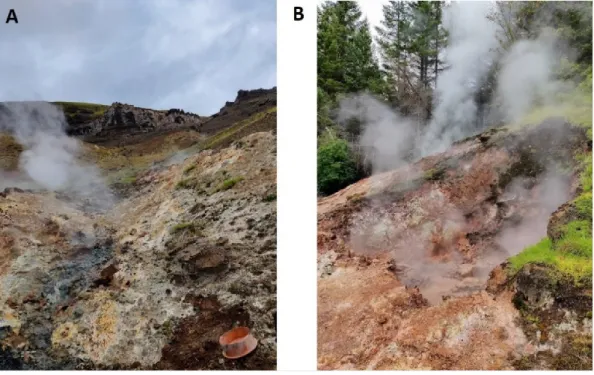
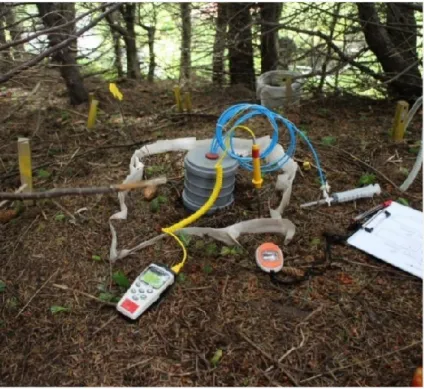
- Geothermal vents
Samples were injected into 12 ml Labco pre-evacuated screw cap vials (Labco Exetainer®, Labco Ltd., Lampeter, UK) and further analyzed in UEF (see 4.3.2). Samples were injected into 12 ml pre-evacuated Labco vials with screw caps (Labco Exetainer®, Labco Ltd., Lampeter, UK). To determine the δ13C values of the geothermal source, geothermal gas samples were taken on July 25 and 26, 2022, from hot spring vents (figure 4) near the study area.
Air was drawn into the 50 ml syringe through a hole at the top of the chamber. Syringes were allowed to cool and then the samples were inserted into the evacuated vials with needles.
Analyses
Soil and soil water samples
In addition, root samples were taken from excavated plots within soil core collars (Ø 4 cm) from a depth of 0-5 cm. Soil water was collected from lysimeters located at the site from transects A to E because transect F was too dry to collect water samples. Total organic carbon (TOC), total carbon (TC), total inorganic carbon (TIC), and total nitrogen (TN) concentrations were measured using a TOC/TN analyzer (TOC-L/TNM-L, Shimadzu, Kyoto, Japan) from water samples.
Isotopic gas samples
Data processing and calculations
Isotopic gas samples
LICOR data
Biological and geological fraction
Statistical analyses
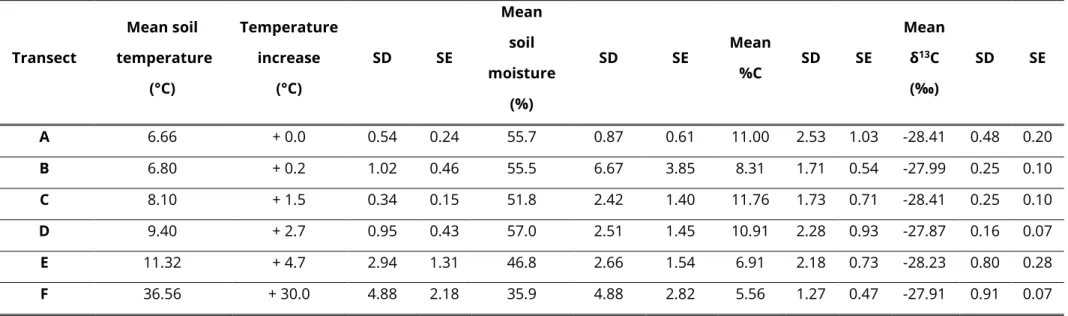
Basic soil characteristics
Dissolved C and N content
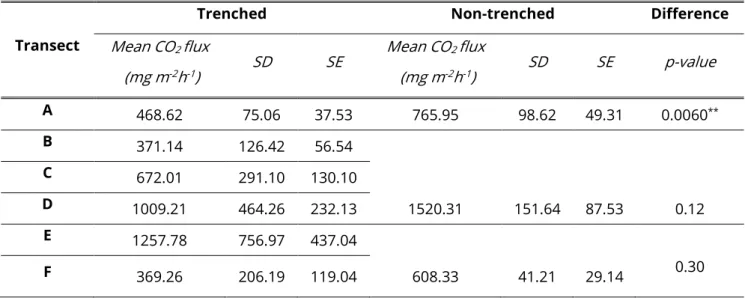
Soil CO 2 fluxes
The δ 13 C values
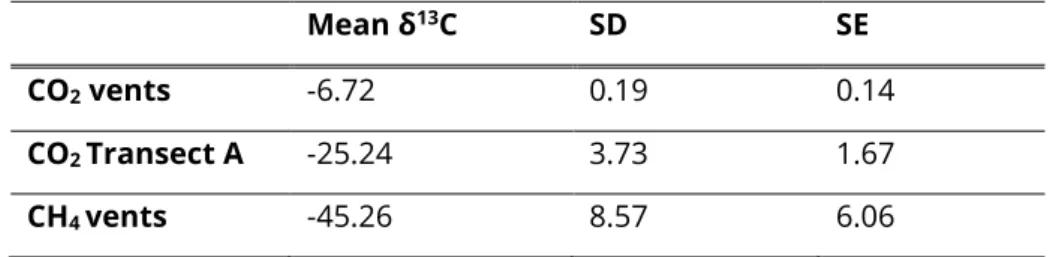
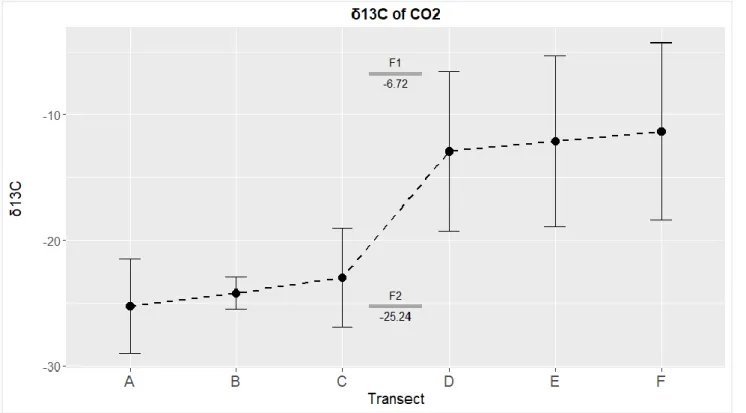
δ13C values increased with increasing temperature and were closer to the geological origin in transect D, E and F ranging from -11.34 ‰ to -12.93. The transects reflect a gradually warming earth due to geothermal activity, where A is ambient temperature and F is extreme warming (+30°C). Values for F1 and F2 were obtained from CO2 sampled from geothermal vents and surface fluxes from transect A with ambient temperature.
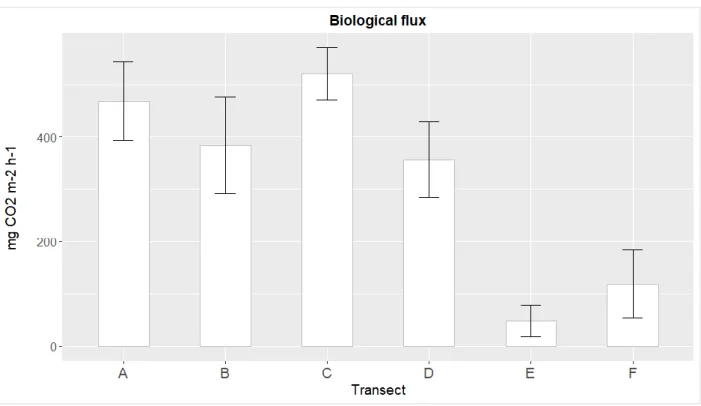
Fractions of CO 2 fluxes
There was a negative correlation between temperature and biological flux (-0.39) and also evidence of a strong negative relationship between temperature and moisture (-0.72). The numbers indicate the strength of the Spearman correlation, the farther the correlation coefficient is from zero, the stronger the correlation.

Soil CO 2 gas profiles and isotope results
The δ13C values of CO2 in the soil gas increased with increasing temperature (figure 11), similar to the δ13C values of the surface fluxes. There was hardly any variation between the depths in transect A, but for transects D and F values became more positive in the deeper layers. The Keeling plots calculated in the soil profile are presented along the bars for each transect measured, although some Keeling plot assumptions are violated with this approach as mentioned earlier.
In two-way ANOVA there were statistically highly significant differences in the δ13C value of CO2 between both transects (p=2 *10-16) and depths (p=8.3*10-4). The transects reflect gradually warmed soils, where transect A is the ambient temperature and F is the extreme warming (+30°C).

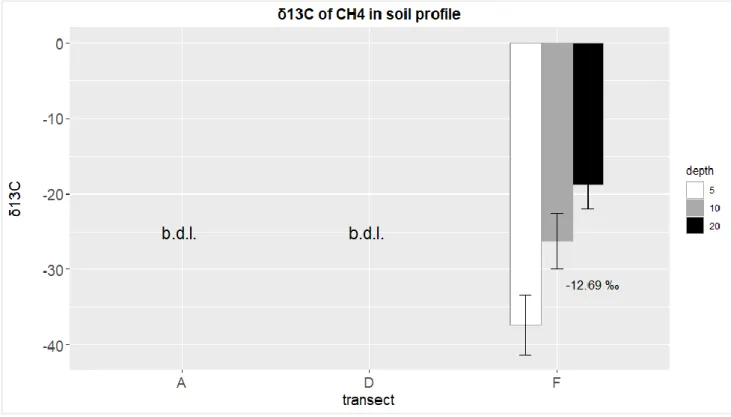
Soil CH 4 fluxes and δ 13 C values
Soil CH 4 gas profile and isotope results
The transects reflect gradually heated soils due to geothermal activity, where transect A is the ambient temperature and F the extreme warming (+30°C). For CH4, the soil profile δ values could only be interpreted from the transect F due to too low concentrations measured from the other transects (figure 14). There was a statistically significant difference in the soil profile δ values in the transect F between depths (p = 0.0387) calculated with One-way ANOVA.
Transects reflect gradually warming soils, where A is ambient temperature and F is extreme warming (+30°C). Values are shown only for transect F as CH4 concentrations were too low in the other transects for reliable isotope analysis.
Soil respiration measurements in the ForHot site
As in the results of this study, the 2016 measurements showed a noticeable, but not close, relationship between geothermal emissions and topsoil temperature, unlike in 2014. It has previously been shown that geothermal emissions can occur even at lower temperatures. and that they can appear as impulses, e.g. they can be episodic (Chiodini et al. 2010).
Biological respiration
2018) summarizes the effects as follows: “Thus, microbial activity remains accelerated per unit of biomass; declines per unit of land'. 2022) confirmed that SOC losses occurred in grassland (GO and GN) only during the first five years of warming, after which. warming no longer reduced SOC content. In addition, forest productivity decreases from transect A to D (Sigurðsson et al. 2019), which could result in lower rhizodeposition and thus lower accumulation of soil organic matter despite higher. It has also been argued that high geothermal CO2 may have toxic effects on microbes (Maljanen et al. 2020), which explains the low rates of biological respiration at transect E, where the highest geological fluxes were measured.
In this study, the soil microbial community was exposed to soil warming for just over 14 years, so the system can be considered to have already entered a steady-state phase after the initial changes in soil SOC losses in transects E and F. minimal and statistically insignificant differences in there are several levels of biological respiration between A, B, C and plots.
Methane
The soil profile results from transects A and D confirm the flux results and show that CH4 is taken up from the atmosphere in the upper layers and is not produced in the soil profile, as. For transect F, the concentrations are significantly higher overall and, unlike the other transects, the concentration increases with increasing depth, indicating CH4 production at depth. The δ13C values for CH4 are positively correlated with increasing depth (and result in a positive Keeling plot, although the general assumptions of the Keeling plot were violated), confirming that there is more geologic CH4.
Possible sources of error in the study and methodological consideration
It should also be noted that there was a statistically significant difference between the non-excavated and trench plots, measured only between the plots in transect A. First, warming occurred in the study site as a result of the sudden earthquake, as opposed to climate changes indirect heating that occurs gradually. In this study, no clear biological CH4 production was found and no significant differences in the CH4 uptake rate mainly due to the low temperature sensitivity of CH4 uptake.
Contribution of Working Group II to the Sixth Assessment Report of the Intergovernmental Panel on Climate Change [H.-O. Geothermally heated soils reveal persistent increases in the respiratory costs of soil microbes, contributing to significant C losses.