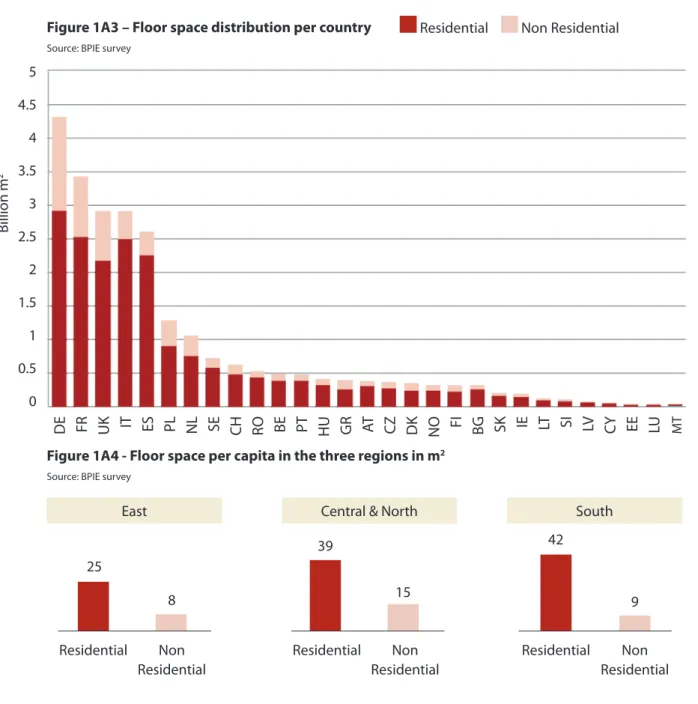
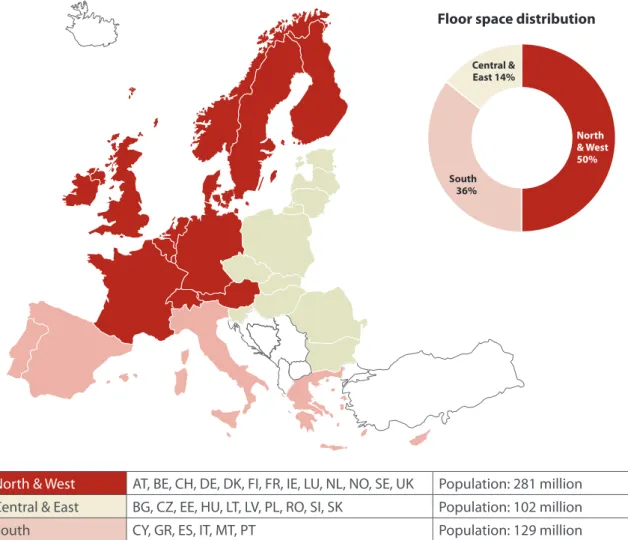
Policy formulation in this area requires a meaningful understanding of several characteristics of the building stock. Half of the total estimated area is located in the northern and western regions of Europe, while the remaining 36%.
THE EUROPEAN POLICY SCENE
While several Member States had some form of minimum requirements for the thermal performance of the building envelope in the 1970s, the EPBD was the first major attempt requiring all Member States to introduce a general framework for setting energy requirements for buildings, based on a “whole building” approach . Examining the requirements set by each Member State, it becomes clear that there are major differences in the approach each country has taken in applying the energy regulations for buildings.
THE WAYS FORWARD
Each of the scenarios 1–4 represents a significant increase in renovation activity compared to the current situation (ie baseline 0). The two-stage scenario therefore illustrates the path that should influence policy decisions to promote the renewal of the European building stock.
Main policy recommendations
INTRODUCTION
A VITAL PICTURE OF THE EUROPEAN BUILDING STOCK
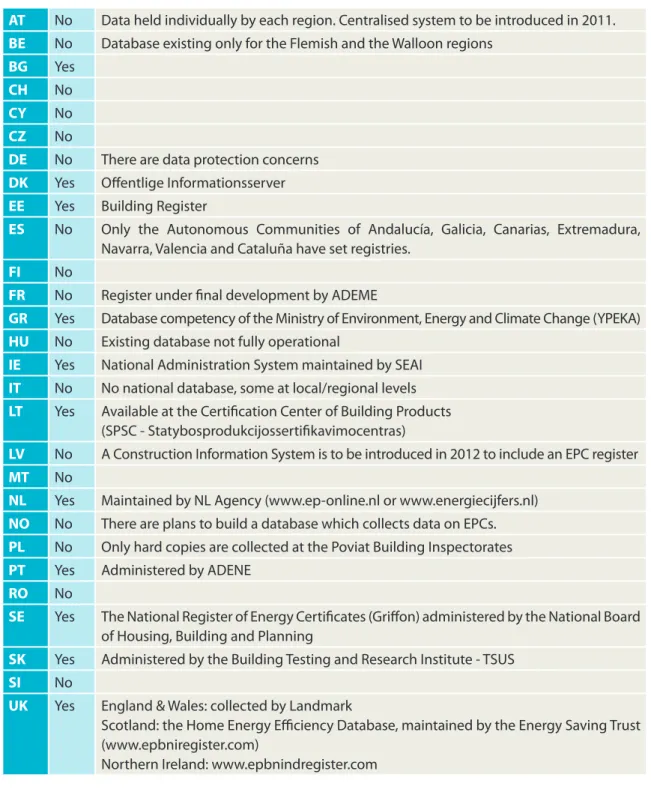
As strategies for the energy performance of buildings develop and become more complex, policy makers need more concrete and precise facts to be able to make comparisons across countries and to put in place monitoring systems that allow measuring the progress of the different policy instruments. . BPIE strongly believes that effective policy-making starts with an accurate picture of the challenge.
THE CHALLENGE
Proponents of energy efficiency need better arguments that will encourage both the private and public sectors to take more interest in improving energy efficiency and explain how this paradigm shift can happen. The main objectives of this study are to provide policy makers with the facts and arguments to make the case persuasively, and to provide useful data inputs to researchers who should base any policy discussion on science-based insights.
STRUCTURE
Data has been collected on the floor area of the building stock, with 25 countries reporting data on residential area and 19 reporting data on non-residential area in full. Care has been exercised in the compilation of the necessary data to make further estimates.
THE CHALLENGES FOR THE FUTURE
Data was also collected by age, size, ownership (private/public), tenure (owner, private or corporate tenant), location (rural/urban) and typical levels of energy efficiency of the building stock. Several countries scored generally well on housing stock, while response gaps were more pronounced on non-housing stock characteristics.
EUROPE’S BUILDINGS TODAY
BUILDING TYPOLOGY
The five largest countries (in terms of population: France, Germany, Italy, Spain and the UK) account for approximately 65% of the total floor area. Using the data collected, floor space standards were analyzed by estimating the floor area per capita for each location.
RESIDENTIAL BUILDINGS
In terms of growth, annual rates in the residential sector are around 1% as depicted in Figure 1A7 which shows the range of residential new construction rates for a range of countries over the period between 2005 and 2010. Apart from the Netherlands (in the case of multi-family houses), all other countries have experienced a decrease in the rate of new construction in recent years, reflecting the impact of the current financial crisis in the construction sector.

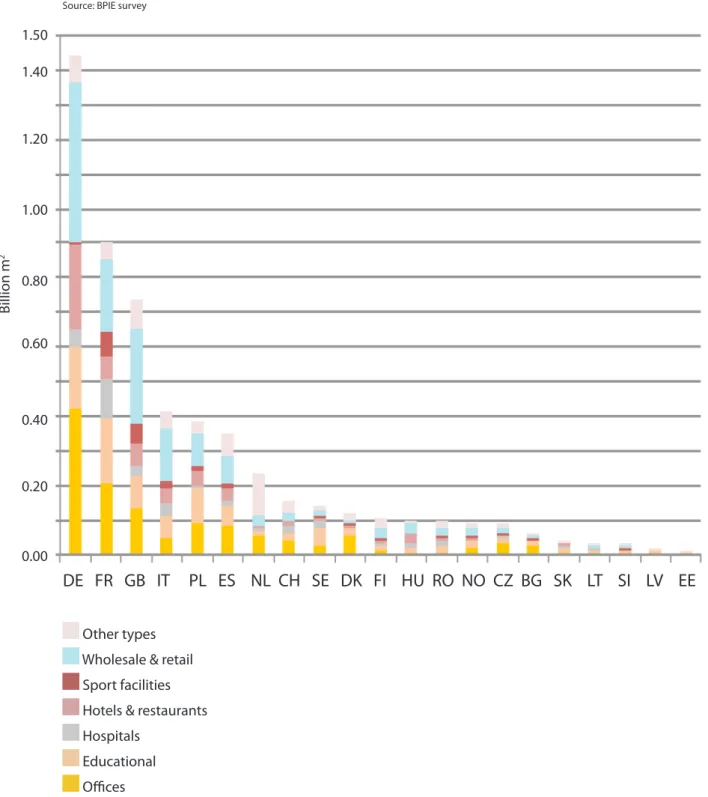
NON-RESIDENTIAL BUILDINGS
CHARACTERISTICS
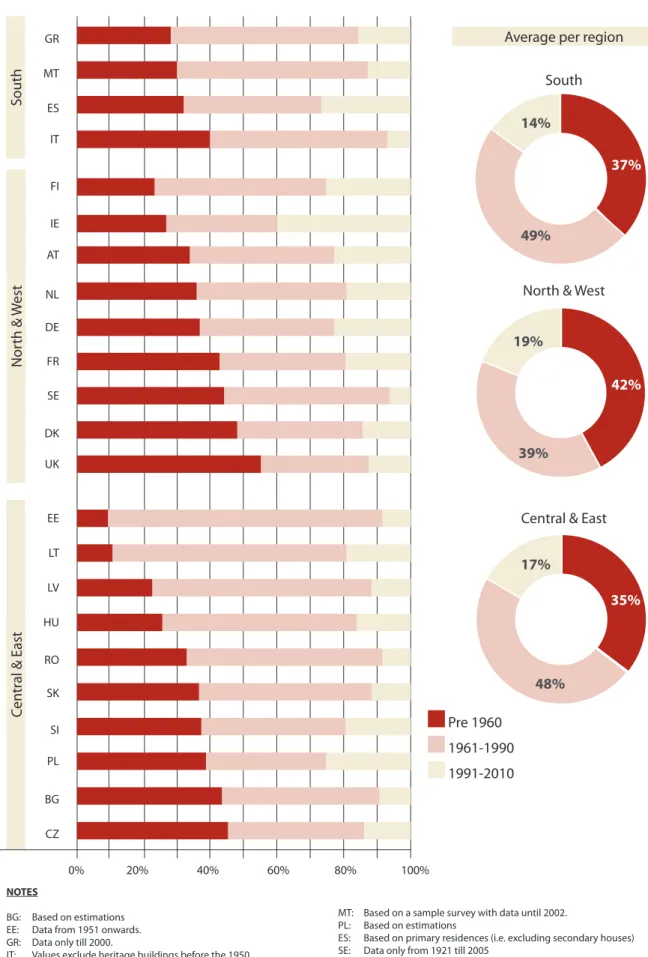
In the residential sector, the age of a building is likely to be closely related to the level of energy use for most buildings that have not undergone renovation to improve energy performance. The differences in the age profile between the three regions appear to be small with older buildings (before 1960) having the largest share in the North and West region.
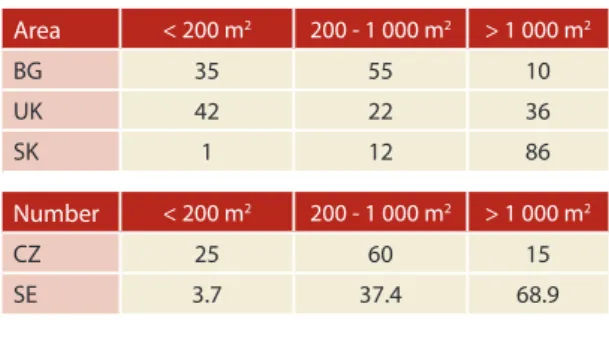
SIZE
AT: Values based on registered certificates, accounting for 1,007 datasets of non-residential buildings, most of which are office buildings. Hospital values include publicly owned acute and non-acute hospitals and private nursing homes SI: The data refers to all property units in non-residential use.
OWNERSHIP AND TENURE
NL: 'Other' consists of social housing associations owned by private bodies for which the conditions (eg rental prices) are heavily regulated by the government. UK: 'Other' consists of registered social landlords (often referred to as housing associations), which are government-funded not-for-profit organizations that provide affordable housing.

LOCATION
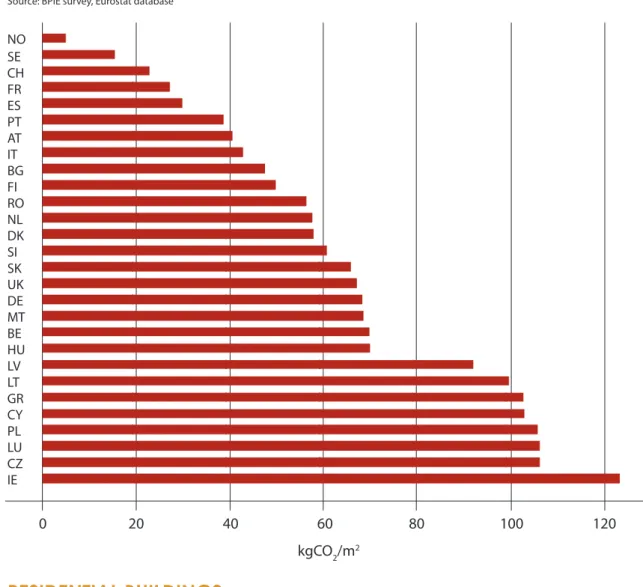
ENERGY PERFORMANCE
The oldest part of the building stock strongly contributes to high energy consumption in the building sector. Based on our data, the estimated average specific energy consumption in the non-residential sector is 280kWh/m2 (covers all final uses).
POLICIES AND PROGRAMMES FOR IMPROVING ENERGY
EFFICIENCY IN BUILDINGS
BARRIERS & CHALLENGES
BARRIERS
- Financial Barriers
- Institutional and administrative barriers
- Awareness, advice and skills barriers
- Separation of expenditure and benefit
Lack of funds and/or the inability to secure financing on acceptable terms is generally one of the most cited barriers to investing in energy efficiency measures. Investing in energy efficiency now also provides some protection against rising energy prices in the future.
CHALLENGES
- Supply chain
- Quality of workmanship
- Technical failure
- Disturbance
- REGULATORY AND LEGISLATIVE FRAMEWORK
This will also be true of the materials used in low-energy renovations, but not necessarily the construction techniques and processes. By reducing the energy consumption of the buildings, a direct reduction of the associated GHG emissions will be achieved and a faster and cheaper implementation of renewable energy sources will be activated.
EPBD: MAIN PROVISIONS, IMPLEMENTATION AND RECAST Main provisions
Improving the energy performance of buildings is a key factor in ensuring the transition to a 'green'. The eco-design of the energy-related products framework directive 09/125/EC (reform of energy use directive 32/2005/EC), the end-use energy efficiency and energy services directive 32/2006/EC (ESD), the Directive Energy Performance of Buildings 2010/31/EU (EPBD, recast of 2002/91/EC) as well as the Labeling Framework Directive 2010/30/EU (reform of EC) aim to contribute significantly to the realization of the energy saving potential of the European Union's building sector.
Implementation (Energy Performance Certificates (EPC’s), Inspections and impacts)
Transposition of the EPBD did not affect investments or investment support schemes aimed at energy efficiency upgrades in the buildings. Transposition of the EPBD did not affect investments or investment support schemes aimed at energy efficiency upgrades in the buildings.
EPBD recast (main provisions, impact and implementation)
DE The 2012 amendment to the Energy Saving Ordinance (Energieeinsparverordnung) will introduce a "climate neutral" building standard (based on primary energy indicators for all new buildings by 2020), as required by the EPBD 2010 reform. As a result, there will be no need for a building regulation comply with the requirements of the revised directive.
BUILDING CODES
FINANCIAL PROGRAMMES
This is underlined by Article 10 of the EPBD recast on financial incentives and market barriers. In view of the importance of providing appropriate financing and other instruments to catalyze the energy performance of buildings and the transition to near-zero energy buildings, Member States shall take appropriate steps to consider the most relevant such instruments in the light of national circumstances." .
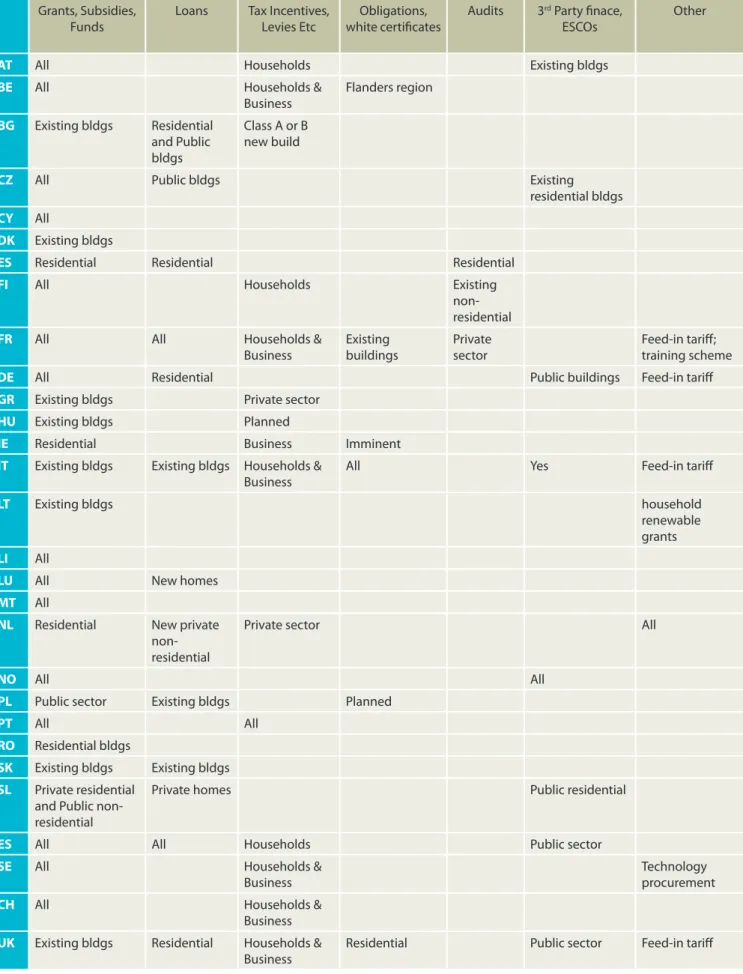
REVIEW OF CURRENT FINANCIAL PROGRAMMES
These are usually available to individuals as well as businesses, thus covering most of the building stock outside the public sector. Finland's Energy Audit Program (the EAP) is one of the oldest national energy efficiency grant schemes in place.
IMPACT OF FINANCIAL PROGRAMMES
OTHER PROGRAMMES
Information
Training
R&D
RENOVATING WITH PURPOSE – FINDING A ROADMAP
TOWARDS 2050
ECONOMIC PERSPECTIVES
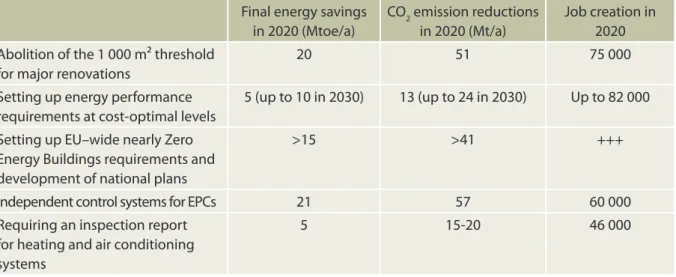
Savings will depend on the previous energy consumption, energy sources used, the energy price, the lifetime of the measure and also future movements in energy prices. Accompanying document to the proposal for recasting the energy performance of buildings (EC) - impact assessment, SEK(2008) 2864.
Defining renovation levels and associated costs
Currently these contain limited amounts of data, but they provide a good example of the kind of knowledge base that needs to be built to provide a more complete picture of the range of renovation activities, including building types, costs, savings and lessons learned. This is considered a breaking point where the ratio between benefits (ie energy cost savings) and investment costs reaches a maximum.
Renovation Rate
On the other end of the spectrum, refurbishment can involve the large-scale replacement or upgrade of all elements that affect energy consumption, as well as the installation of renewable energy technologies to reduce energy consumption and CO2 emissions to near zero. , or, in the case of a . The reduction of energy needs to very low energy levels (i.e. passive house standards, less than 15 kWh/m2 per year) will lead to the avoidance of a traditional heating system.
Prioritising the building stock that can deliver most energy savings
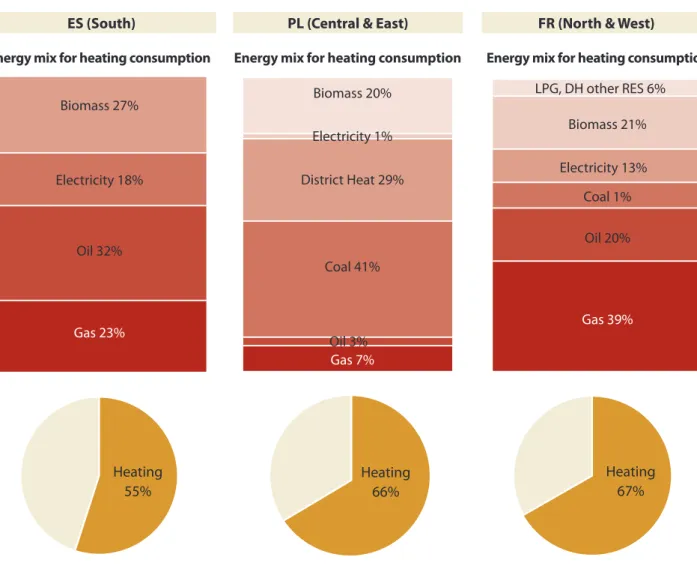
On the other hand, energy consumption for cooling is significantly higher than in other European regions and there is a significant saving potential here. The main driver of the building sector across the EU and neighboring countries (including members of the European Free Trade Association50, applicant countries such as Croatia and signatories of the Energy Community Treaty from Eastern Europe) is now the EPBD.
Job Creation
OVERVIEW OF THE RENOVATION MODEL
Net savings for consumers - the difference between the lifetime energy savings and the lifetime investment. Net savings to society, including the value of externalities – the sum of lifetime energy savings and the value of externalities minus the lifetime investment.
Determining the practical limit for the renovation of the EU building stock
Input data
SETTING THE SCENE
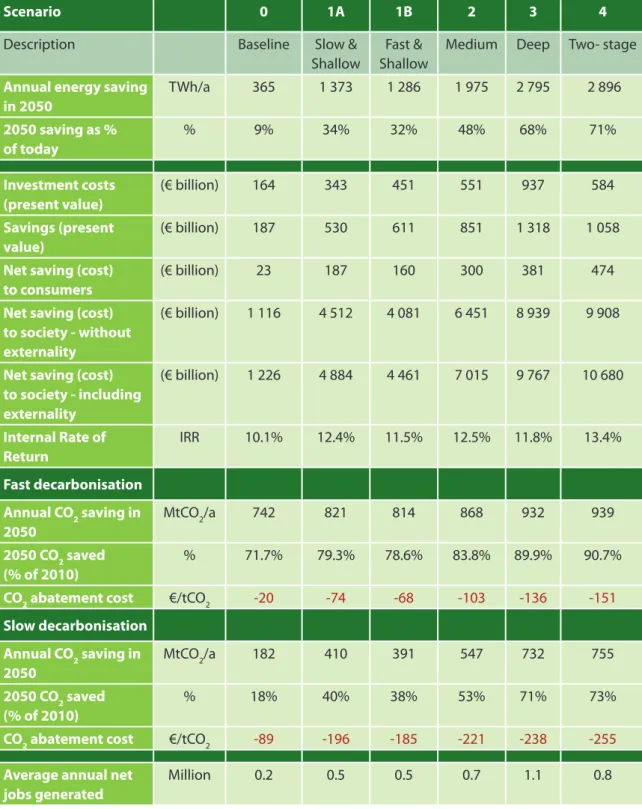
This section examines six scenarios under which the renovation of the European building stock may develop over the next 40 years. One difference between the baseline and the other five scenarios is the age profile of the residential stock being renovated.
Baseline (Business As Usual)
These scenarios are derived from combinations of the renovation rate and renovation depth routes as well as the two decarbonization rates described earlier. Except for the baseline scenario, the profile of renovated houses is weighted more heavily towards the older stock in the period giving a higher energy saving per € investment during this period.
Investment
Scenarios 1a (Slow & shallow) and 1b (Fast & shallow)
Medium
The CO2 reduction results for 2020 show no significant difference with scenarios 1a and 1b, regardless of whether the energy supply is decarbonised at high or low levels. At present, net savings for consumers will amount to EUR 300 billion, and the internal rate of return will be 12%.
Deep
Two-stage renovation
The scenarios in direct comparison
The high investment needs of the deep scenario have been caused by a rapid increase in deep renovation measures in the first decade. In all scenarios, the estimated reduction in CO2 emissions by 2050 is determined by energy savings, but also by the decarbonisation of the energy supply sector.
FINAL REMARKS AND
POLICY RECOMMENDATIONS
However, this requirement refers to the objectives of the EPBD recast, which do not clearly specify the need for a particular renovation rate or depth of the existing building stock. It is therefore a strategic condition that EU member states implement the EPBD realignment in a way that encourages deep renovation of the existing building stock.
Key recommendations at EU level
In order to boost the in-depth renovation of the EU's infrastructure, the establishment of specific financing instruments, i.e. EU spending on the renovation of the building stock (ie through structural and regional development funds) introduce the minimum requirement for the implementation of measures at cost-optimal levels (which will be defined during the reworking of the EPBD).
Key recommendations at the National level
Therefore, removing the market barriers faced by ESCOs can facilitate a faster and better development of retrofit programs. Promotional and dissemination activities should be an important part of deep building renovation programs.
Conclusions
DEFINITIONS
Internal rate of return (IRR): A rate at which the accounting value of a security equals the present value of the future cash flows. It measures the excess or shortfall of cash flows, calculated against their present value at the start of the project.