Dissertation title Evaluation of location-based adjustment factors for capital costs in the pulp and paper industry. In this study, current methods for determining location cost factors have been investigated and indicatively assessed for their applicability for estimating investment costs in the pulp and paper industry.
Research Problem and Structure of the Thesis
To account for the continuing declining margins within investment projects in the pulp and paper industry, it is essential to further understand the key cost factors that lead to different price levels across countries relative to capital investment expenditures to incorporate these effects into estimates. This thesis aims to create a pragmatic approach to better account for some of the unaccounted for variables that cause price level variation based on location in the pulp and paper industry.
Objectives and Scope of the Thesis
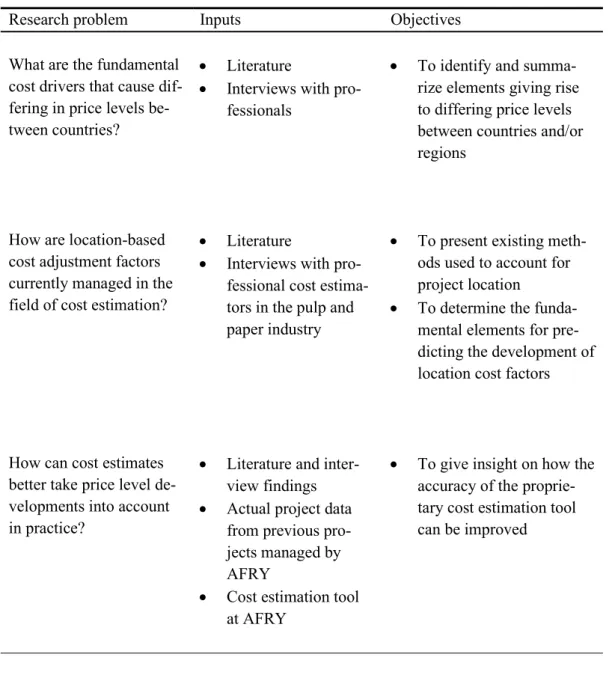
An overview of the research problem, required inputs and objectives of this thesis is presented in Table 1. To provide an overview of how the accuracy of the cost estimation instrument can be improved.
INDUSTRY OUTLOOK AND COST ESTIMATE FORMING
Background and Characteristics
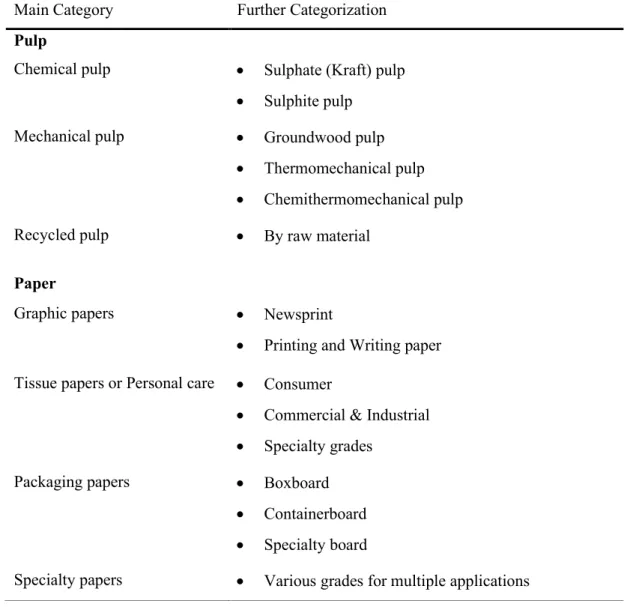
An example of the main product categories in the pulp and paper industry is presented in Table 2. Some key characteristics that define the pulp and paper industry are presented in Table 3.
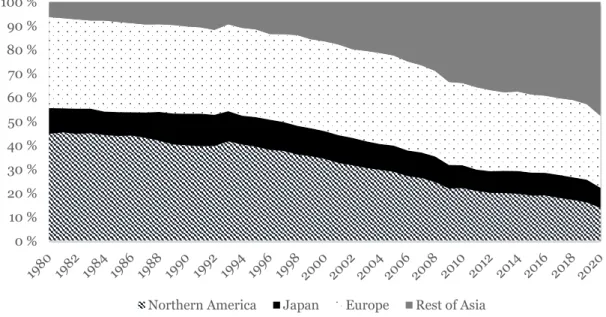
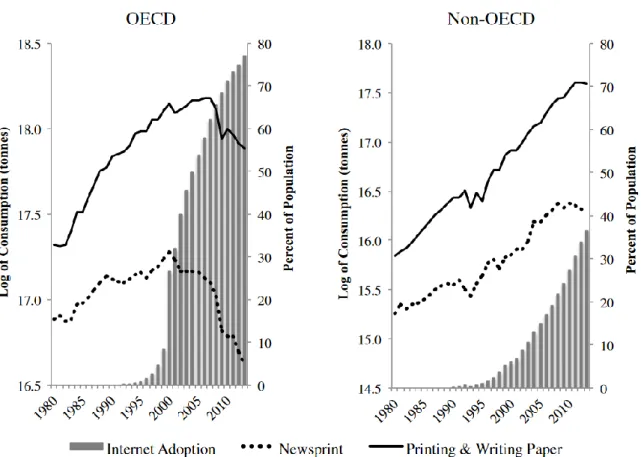
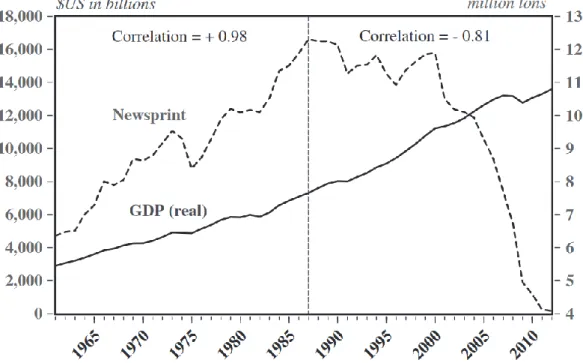
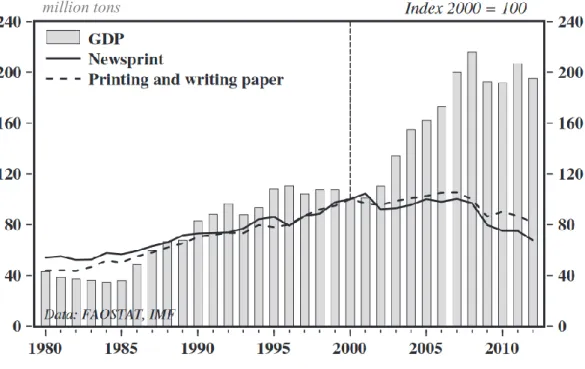
Recent Developments
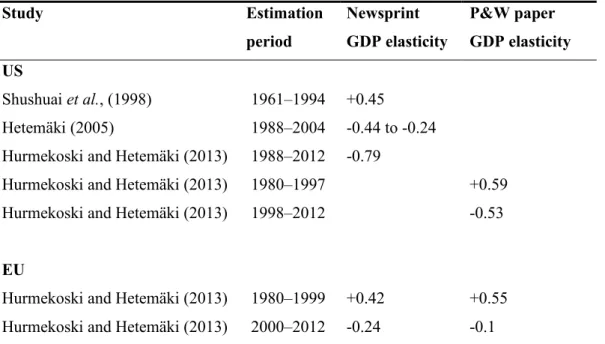
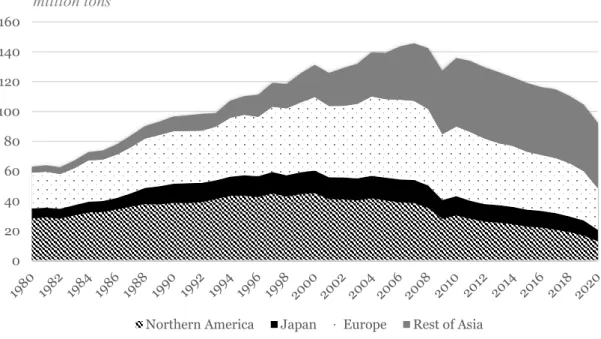
As shown in the table above, numerous significant changes are underway in the global pulp and paper industry and markets. The most important changes are in the field of graphic paper, including newsprint and printing and writing paper.
Profitability and Investments
Korhonen et al., 2015) However, there is still no significant effort to increase R&D intensity among producers in the pulp and paper industry, as measured by R&D spending to sales. Average R&D investments per sales (%) for different product segments in the pulp and paper industry.
General Framework
The methodology of the cost estimation model will be described in more detail in chapter 8. The methodology aims to measure and increase project definition by defining how the scope of the capital project meets the investment objectives. As more information is fed into the estimation methodology, the accuracy of the estimate increases.
As the AFRY Management Consulting investment cost assessment tool is mainly used for pre-feasibility and feasibility assessments, Table 9 provides an overview of the characteristics of the assessment classes in question.
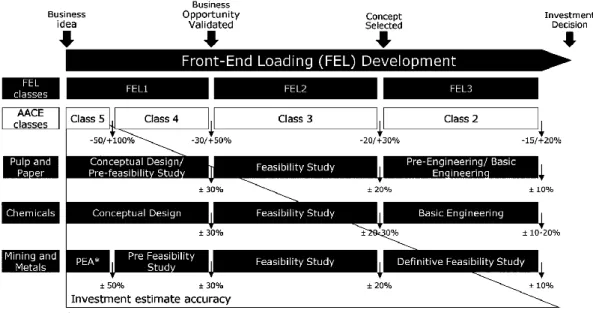
Pre-feasibility Study
Because these estimates are generally based on limited information, the expected accuracy of pre-feasibility cost estimates is between -50% and +100% of actual project costs. Detailed process design or descriptions are reserved for later stages in the investment planning process (usually after the feasibility study), as the goal is simply to form the basis for further economic calculations on selected concepts (BRG, 2012). As preliminary estimates of feasibility costs are quite imprecise, investment decisions should never be made solely on the basis of these estimates.
To begin the cost estimation process in preliminary feasibility studies, class, scope and capacity must be known or anticipated.
Feasibility Study
To begin the cost estimation process in pre-feasibility studies, the grade, extent and capacity must be known or projected. methods can also be used if equipment-level capacity details are still unknown. The capital cost estimates are prepared for more detailed economic calculations, such as profitability and sensitivity analyzes and cash flow statements.
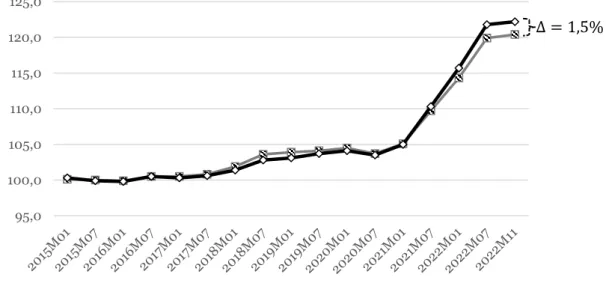
Cost Escalation and Estimation Inaccuracy
To account for small project overruns due to the reasons discussed, project estimates usually include some contingency costing. A distribution curve illustrating how contingency bridges the gap between the mode and median of the investment cost estimate. Deciding how to categorize investment costs in industrial investment projects depends greatly on the scale, scope and nature of the investment in question.
This chapter presents an overview of the main categorization methods and the basis for estimating costs within these categories.
Cost Categorization and Estimation Methods for Investment Projects
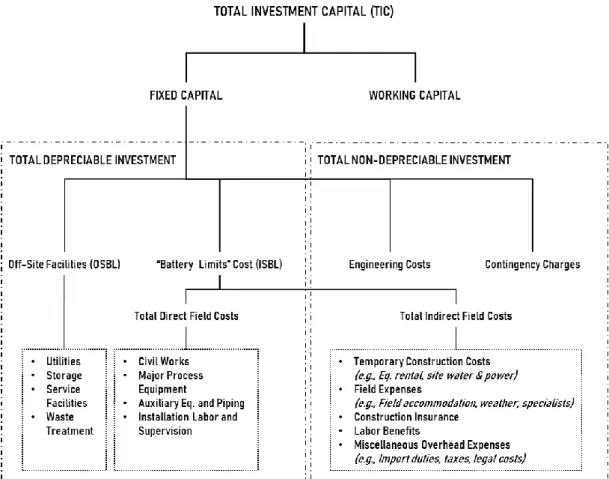
- Fixed Capital
- Working Capital
It is important to note that categorization efforts may vary depending on the application of the completed estimate. Within Battery Limits or ISBL costs include all costs associated with the purchase and installation of the new installation or extension. The model is based on the estimated total project costs, the desired accuracy of the estimate, the number of cost elements and the maturity of the relevant technology.
However, it is important to distinguish between working capital and utilities and other costs that are instead considered part of plant operating expenses (OPEX).
Cost Categorization in Mill Investment Projects at AFRY
ADJUSTING INVESTMENT COSTS BASED ON LOCATION
Index Types
- Composite Indexes
- Sub-Indexes
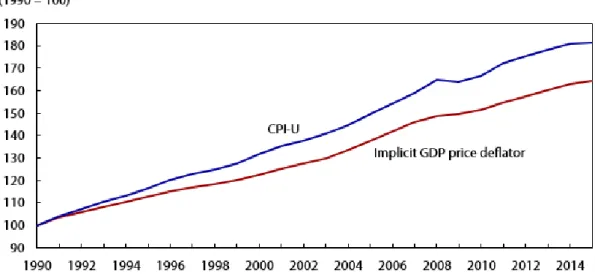
Some of the most prominent composite indices used are, for example, the consumer price index (CPI), the producer price index (PPI) and the GDP deflator (Sorrels and Walton, 2017). Composite indices are typically constructed by weighting the values of the individual indicators based on their relative importance or importance. The weighted values of the individual indicators are then added together to produce the composite index value.
Sub-indexes are usually constructed by selecting a subset of the data used to construct the larger, composite index, and then weighting the values of the individual indicators within the subset.
Prominent Indexes Utilized in Investment Cost Estimations
- Consumer Price Index
- GDP Deflator
- Producer Price Indexes
- Labor Cost Indexes
- Construction Cost Indexes
- CEPCI
The gross domestic product (GDP) deflator is a measure of the average change in the prices of all goods and services produced in an economy. The GDP deflator is a measure of the overall price level in the economy, while the Consumer Price Index (CPI) measures the price of a specific basket of goods and services that households consume. Compared to e.g. CPI, PPIs measure price change from the seller's and not the buyer's perspective.
Labor cost indexes (LCIs) are measures of changes in labor costs over time.
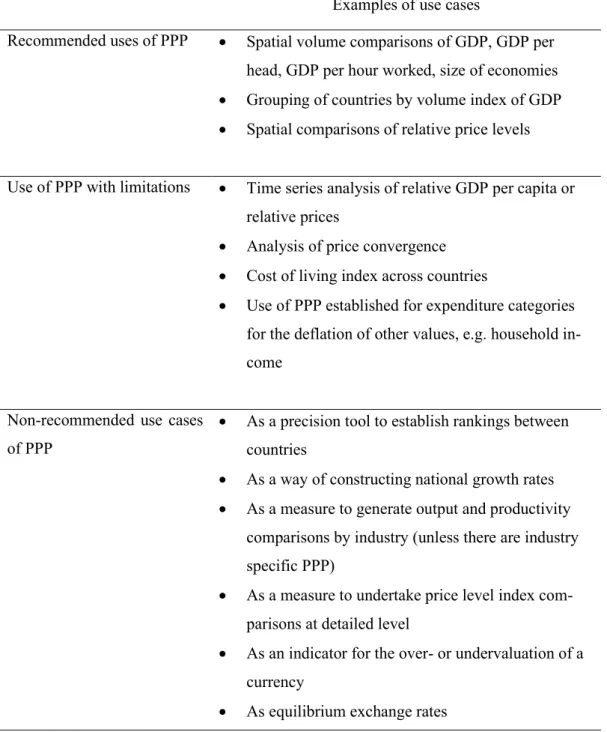
Purchasing Power Parity
- Price Level Indexes
- International Comparability Program
Uncertainty of base price data and methods used to calculate PPPs can affect small differences between PLIs and result in rankings that are not statistically or economically significant. The International Comparison Program (ICP) is a statistical initiative that aims to compare the purchasing power of the currencies of countries around the world. This is done in order to ensure the proper use and distribution of data provided by Eurostat and OECD.
However, it is worth noting that there are limitations to the ICP methodology, including uncertainties in item selection, price collection and weighting, all of which may affect the quality of the results.
Summary and Discussion
CAPEX prices in the process equipment industry are often not closely correlated with prices tracked by government agencies and economists, as this industry can be considered a micro-economy with its own unique characteristics (Hollmann and Dysert, 2008). Even when industry-specific indexes are used, such as construction indexes, the indexes can aggregate data within the industry and therefore have a built-in preference for cost elements unrelated to the "subindustry" sought. For example, cost drivers may choose to develop their own composite index by weighting relevant cost components to better account for industry-specific cost escalations.
The interviews were conducted to establish a baseline of the level of knowledge and approaches that cost estimators currently have when calculating location on projects.
Methodology
If cost indices are used, which indices are used and where they come from.
Key Findings
- AFRY Finland Oy
- Pulp and Paper Equipment Manufacturers
- Pulp and Paper Producer
Due to the business-critical nature of the topic, the companies in this study remain anonymous. However, installation of the equipment is usually done by the project owner or a third party consultant. It is important to note that equipment manufacturers are less likely to include installation costs as part of the purchase contract, the buyer must consider the costs incurred from these sources.
However, as previously mentioned, it is up to the buyer and/or project owner to consider these matters, as the equipment manufacturer is rarely fiscally responsible for the costs resulting from the installation of the equipment.
Summary of Conducted Interviews
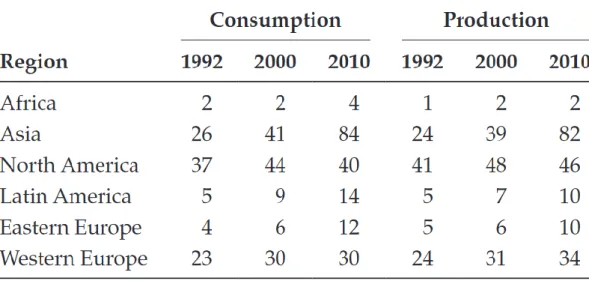
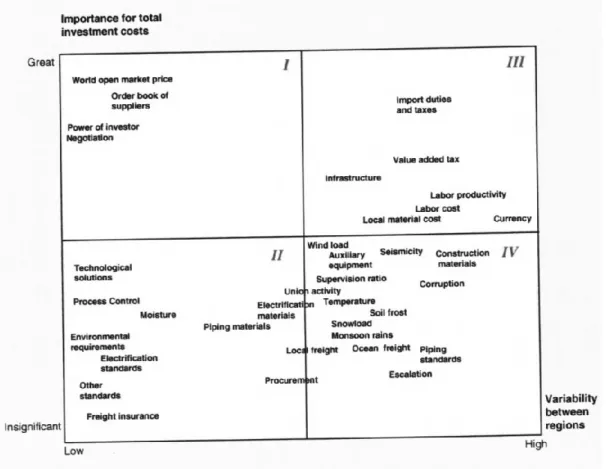
There are many factors that cause investment cost differences between the geographic location of the project in question. Some cost elements can be estimated at a regional level, others at a country-specific level. Since the costs for main machines represent about 50% of the total investment costs in pulp and paper projects (Leppänen, Kraslawski and Avramenko, 2011), freight, duties and taxes will have a major influence on the final cost estimate.
Differences in transport costs can be significant depending on the origin of the machinery or equipment.
Construction Cost Levels
- Location Cost Factor Composition
- Current Limitations and Challenges
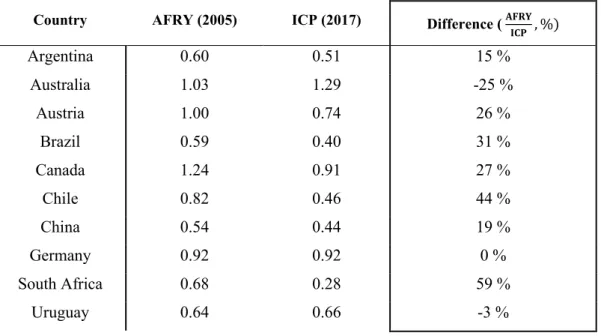
The findings of the case study indicated a very high degree of underestimation of costs compared to actual costs based on the quotes collected in the case study. In this chapter, improvements in the validity and accuracy of AFRY Management Consulting's investment cost estimation model will be presented. Implied improvements in the accuracy of the calculation model are based on the literature explored in this thesis and the findings of interviews conducted by the company.
An example of the methodology for a location-based factor for civil works in a European country is shown in Figure 17.
Proposed Improvements to the Cost Estimation Model
- Updating Static Price Levels
- Utilizing Appropriate Indexes for Cost Areas
- Indicative Indicator for Installation Labor Availability
Currently, the cost estimation model uses adjusted weights of different inflation indices even in the same cost areas. As found in interviews with pulp and paper producers, the single largest escalation of cost areas in new pulp and paper investment projects stemmed from poor labor availability. An additional consideration when using this indicator is the choice in which phase of the project the mentioned indicator should be implemented, since the availability of labor is highly dependent on the time frame of the investment.
1998) 'Determining Locational Cost Factors for Investment in the Pulp and Paper Industry', p 2010) Changes in Global Forest Products and Timberland Markets.