Error correction in reads can be done by constructing a multiple sequence alignment over the read set. The genomes of individuals cannot be completely sequenced, but only relatively short bursts of the genome can be sequenced. Many questions can be answered through an understanding of the genome; the way his genes affect each other and how the genes themselves affect the individual.
Genomes can alternatively be analyzed by genome assembly, where the entire genome is constructed from reads. Although SNPs have been effective in many analyses, a fully discovered genome can be used to study the genome at much more diverse scales.
Genome Assembly
Guide data
Although the use of reference genomes in genome analysis is almost always useful, it tends to propagate inaccuracies in sequence analyses. Reference bias is used as an umbrella term for problems arising from the use of reference genomes in analysis. Nevertheless, reference genomes are by design a rather rudimentary choice for establishing a validation point for genome assemblies.
Linkage maps
Of course, Jung [4] was referring to the impracticality of creating a set of psychological types covering the wide swath of human psychology, not a reference genome. Still, the point is apt; since every individual is an exception to any classifier, no reference genome can possibly be used to adequately represent any individual. These avenues provide neat ways to shift the reference bias problems to computational and algorithm design complexity.
Optical maps
Thesis contributions
This article builds on the work in Article II and as such is similarly discussed in Chapter 4. The author came up with the general idea of using the hierarchy in the meeting and was still working on the actual implementation, collecting the results and writing the original draft. of the paper.
Overview
In this thesis we will mostly cover the use of the DNA alphabet (A, C, G, T) for our arrays. However, in practice this choice is likely to be too restrictive, as there are cases where the character is unknown. A prefix is any substring that starts at position 1, while a suffix is any substring that ends at position n.
The number of positions where strings differ, known as the Hamming distance, is an intuitive way to compare strings. For example, the strings "banana" and "pineapple" do not share any characters in the same positions, but are clearly similar. For example, adding spaces in the previous example, "banana-" and "-pineapple", makes the similarities between the two strings clear.
For example, adding spaces at the beginning and end of two strings creates uninteresting alignment. For example, the alignment of nucleotide and amino acid sequences requires different types of errors to be assigned specific costs. While trivial alignments are easy to create, computing a cost-minimizing alignment is relatively expensive.
An optimal alignment of two strings can be calculated exactly in quadratic time using dynamic programming.
Graphs
An overlap between uandv strings is a stretch between a prefix ofu and a suffix of v or vice versa. An overlap graph can be constructed from the overlaps of strings, but does not necessarily contain all the overlaps between each string. As an alternative to computationally heavy alignment-based overlaps, there is the possibility of using k-mers of strings as vertices and k−1 overlaps between each consecutive k-mer as edges.
Since the k-meters naturally overlap in the strings, the construction does not require expensive alignment. This concept of coverage can be defined as the size of the subset of the readsR set that covers the positions of the genome. However, it can be estimated by calculating the average coverage for all positions by taking the total length of the reads relative to the length of the genome.
Multiple sequence alignment (MSA) is a technique used in several areas of sequence analysis. The similarities between the example and the example in Figure 2.1 are clear, although the differences are of course that make multiple alignment a more difficult problem. Just like with alignment between two strings, we need to define some cost function to optimize for the multiple alignment to be useful.
The intuitive approach is to use the cost function from spanning two strings and consider all pairs of strings and get the sum of their costs.
Approximations of Multiple Sequence Alignment
LoRMA
Results
This is likely because LoRMA prefers high precision over preserving the long length of the original reads. While this makes sense from a debugging context, assembly pipelines are designed to use long reads to the point of discarding reads based on arbitrary length limits. Although subsequent methods have continued to push both the accuracy of correction and the time and memory requirements of the methods, the use of error correction in genome assembly has also begun to change.
Pacific Biosciences has improved their sequencing machines to be capable of far better accuracy while retaining most of the length of their long reads [27]. Newer genome assembly methods are also more able to handle the error rates by moving further away from relying on k-mers and de Bruijn graphs. However, in such cases the errors from the readings are still propagated to the final assembly.
Assembly polishing
While there are a number of approaches to directly analyze the read data, the problem of genome assembly is an interesting one to study. Genome assembly also manages to live up to the traditional computer science problem ideal of an easily explainable problem, yet becomes a fractal of deep computing problems that are increasingly difficult to solve. The simplest version of genome assembly is the problem of assembling the genome from the raw reads produced by a sequencing machine.
Here, as in error correction, the only information provided by the reads are the strings of nucleotides and their coverage. Since the reads alone are usually not sufficient for a complete genome assembly, the assembly process often involves manually fixing conflicting sequences and using different types of additional data to find misassembled or missing assembly blocks. Scaffolding a genome assembly is the process of finding the orientations and distances between fragmented parts of the assembly to build longer sequences called scaffolds [ 5 , 6 ].
Using a reference genome to aid genome assembly makes the problem very different, as the problem becomes a complicated game of point of difference. De Bruijn graph (DBG) based approaches take k-mers of reads and form a de Bruijn graph from thek-mers. The hard problem being that it is, genome assembly algorithms can safely assume that the entire genome cannot be constructed unambiguously from assembly graphs.
The composition graphs can be transformed to be more capable of finding units by reducing their branching.
Long read assembly
Colored overlap graphs
Hierarchical guided genome assembly
Results
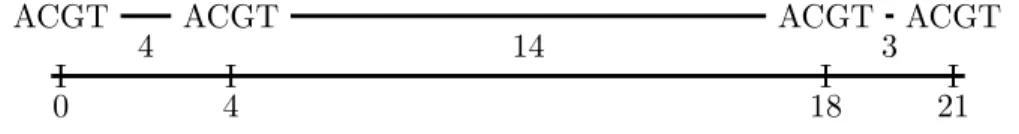
Of the various possible different types of data that can be used for guided assembly, the closest related to reference genomes and genetic linkage maps is the optical map. All three provide an inherently linear guide to composition; reference genomes and linkage maps by way of a assembled sequence to align reads, and resulting optical maps representing a full genome sequence as lengths between known substrings of the genome. Optical maps are created by cutting pieces of DNA into fragments at positions defined by an enzyme.
Rmaps have flaws that must be overcome and assembled to form a full genome-wide optical map. Optical maps represent the genome in a different, notably larger alphabet, with fragment lengths instead of nucleotides. Using these building blocks, we can essentially reformulate all the techniques discussed in this thesis for analyzing optical maps.
While the ideas behind it are very similar to nucleotide-based analysis, a recurring theme crops up in optical maps; the field is not as extensively researched and only a few methods compete with each other with wild compromises. Comet finds all pairwise alignments of related Rmaps and constructs a multiple alignment grid, where it stores decompositions of the Rmaps and their alignments as pairs of match counts between Rmaps. This reduces the number of Rmap-to-consensus alignments compared to an iterative MSA, at the cost of a large grid to compute around.
The difficulty in extrapolating a competing research area from these two examples is the difficulty in analyzing methods for optical map analysis.

Overlaps and assembly
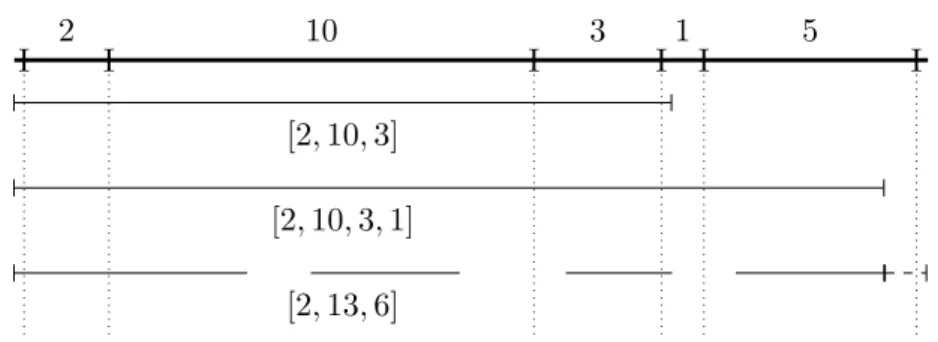
Indexing can be seen as an attempt to summarize only important and informative parts of the data; there is no insight to be gained by analyzing errors. Building an index over the k-mers of the Rmaps has the inherent problem that it fails to capture non-contextual information about Rmaps. To keep the Rmap representative of the original genome, the lengths of skipped fragments must be added back to the next length of the fragment.
To further increase the error tolerance of the index, the spaced (l, k)-measures are also grouped by distance. We store a list that stores the index of the union root occurrence list for each (l, k)-measure and use it to find the corresponding occurrence list given any (l, k)-measure in the index. Constructing an index can also be done with space efficiency, since only parts of the uncompressed index are always needed in memory.
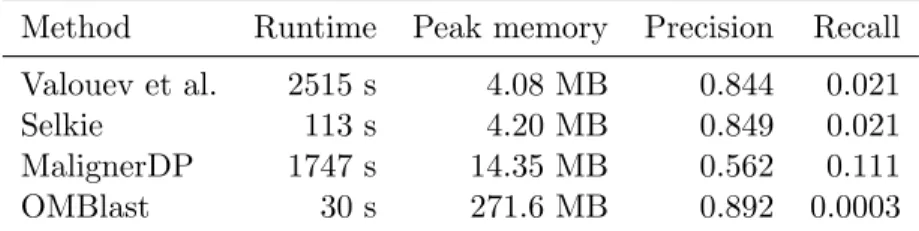
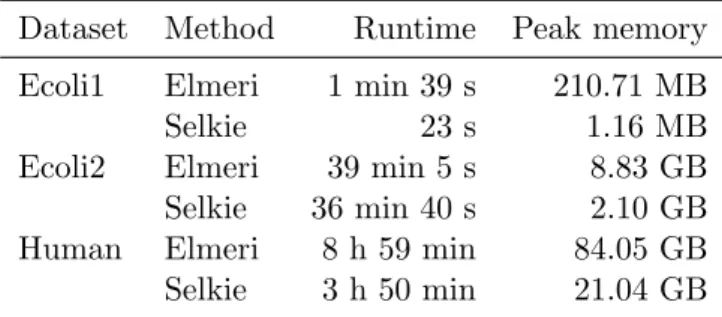
Still, the compression scheme used in Selkie easily beats Elmeri in space consumption, using only a quarter of the memory to construct the index. This leads to a roughly halving of the build time, while all parts of the index must be compressed. To compare the correctness of the overlap calculation, we show precision and recall numbers of the methods.
In Paper I, we were limited by the technology of the time and only looked at correcting the reading results that were state-of-the-art. Not only does this render the error correction tools of the time essentially useless, it completely changes the way error correction should be approached. However, since such work would be beyond the scope of the article, constructive discussion on the subject is not fruitful here.