Thesis for the Doctor of Philosophy degree will be submitted with due permission for public examination and critique in the Tietotalo building, Auditorium TB109, at Tampere University of Technology, on October 12, 2007, at 12.00. However, with PET there are both economic (high cost of an examination) and ethical reasons (radiation dose to the patient) that limit a significant increase in sample size. We searched for ways to increase statistical power in the analysis of PET brain studies by decreasing the measurement error (specifically variation due to the measurement process) as well as by using a sensitive statistical analysis technique.
In the first two methods, we demonstrated the improvement in power through the better reproducibility and reliability, as well as lower variability, of the methods we applied. In the third method, the gain in power was illustrated by comparing the results with the standard method of analysis. This thesis was carried out during 2001-2007 in the Institute of Signal Processing of the Tampere University of Technology, in close collaboration with the Turku PET Center, University of Turku/Turku University Central Hospital.
The pre-examiners of this thesis, Professor Kenneth Nordström, University of Oulu and Balázs Gulyás, MD, PhD, Karolinska Institute, Stockholm, deserve sincere thanks for their careful reading and constructive comments on this thesis.
Introduction
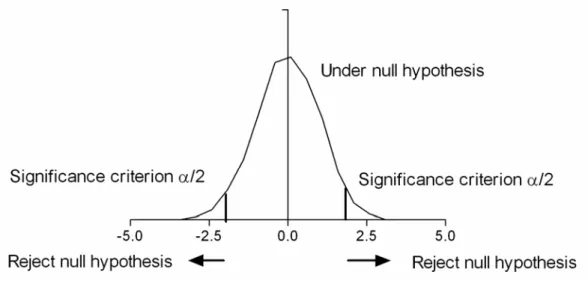
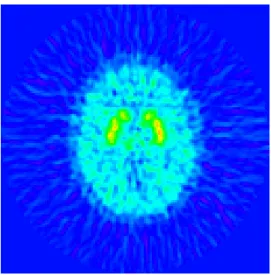
Shown is a histogram of a sample of 3000 observations from a standard normal distribution (mean 0, variance 1) under the null hypothesis. The motivation for this thesis was an attempt to increase the statistical power of functional positron emission tomography (PET) image data analysis. Increasing the power is important because PET data are very noisy; see Pajevic et al. 1998) for noise characteristics of PET images.
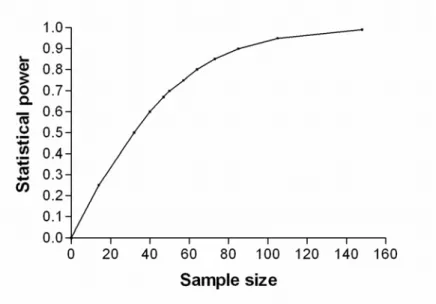
In this work, we did not attempt to increase the statistical power by increasing the sample size, which is the most obvious choice to improve the reliability of the sample results. The reason we did not do this is related to the limitations of PET imaging, which are described below. On the contrary, we wanted to reduce the errors arising from the methods used and also to increase the statistical power through efficient analysis techniques.
A power analysis (e.g., sample size calculation with fixed power) was not performed because the actual statistical analysis generally did not work.
The statistical power and related concepts
- Statistical inductive inference
- General issues on statistical hypothesis testing
- Hypothesis testing approaches by Neyman-Pearson and Fisher and their
- Hypotheses, errors, and analogues in statistical testing
- Null hypothesis and alternative hypothesis
- Type I error, type II error and the statistical power
- Analogous examples of hypothesis testing in other fields
- Binary classification tests
- Factors affecting the statistical power
- Power calculations, i.e., power analysis
- Visualizations of types of error and power
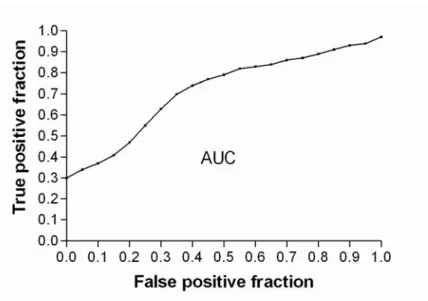
- Receiver operating characteristic
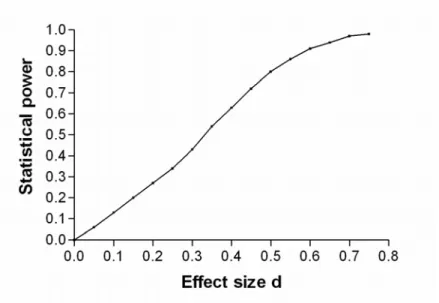
- Effect size versus power
- Correction for multiple tests
- Other considerations
In this thesis, the most important difference between the two approaches concerns the statistical power. The statistical hypothesis test begins with the definition of the null hypothesis (H0) and the alternative hypothesis (H1), which is of greatest importance. The statistical power is then defined as 1-β, and it indicates the probability that the test will reject a false null hypothesis.
There is an analogy between statistical hypothesis testing and, for example, legal issues, doping control in sports and diagnostic tests in medicine. There are differences in terminology ie. the same question is formulated in different words for statistics, signal processing (Kay, 1998) and diagnostic tests (Pepe, 2003). The results of power calculations depend on statistical tests and designs (see Cohen, 1969 for power tables in various statistical tests), but we will not go into detail here.
Statistical power (true positive rate) is on the vertical axis, and type I error (α; false positive rate) is on the horizontal axis.
General means to increase the statistical power
- Sample size and related issues
- Issues related to the parameters and type of statistical test
- Reducing the within-group variability
- Reducing the measurement error
- More efficient statistical tests
Meta-analysis (“multiple trials”) can be used to increase the sample size and thus the statistical power of the test (see Hedges et al., 2001) in both exploratory research and randomized controlled clinical trials. For example, more homogeneous subjects can be used in sample selection as they differ less on the dependent variables. These designs are particularly useful because all individual differences due to subjects' mean response are removed by the error term; individual differences contribute most of the within-group variability.
For example, there may be carryover effects, where the effect of the first treatment spreads to the second treatment. This is because the variability of the observations increases above their required “true” variability (Cohen, 1969). In general, anything that reduces the variability of observations by excluding sources of variability that are irrelevant to the assessment of the phenomenon under study will serve to increase power (Cohen, 1969).
The probability of detecting effects can be increased by using more sensitive analysis techniques, ie.
Validation measures and their relation to power
- Reliability theory: The additive error model
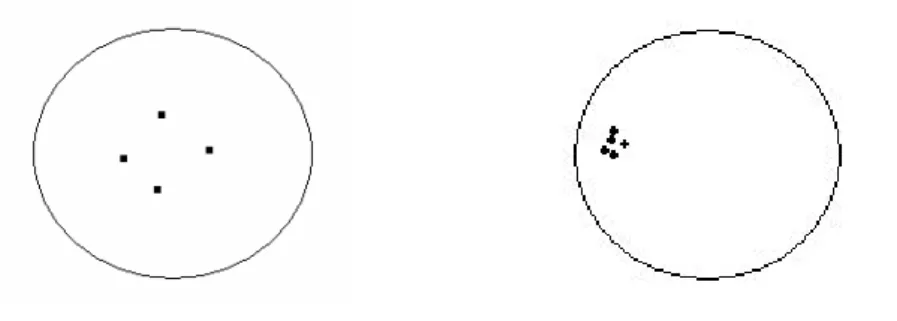
- Validation: general issues in reproducibility, reliability and validity
- Test-retest reproducibility
- Normalized absolute difference and its relation to power
- Variance and its relation to power
- Other reproducibility measures used in functional neuroimaging
- Reliability
- Test-retest reliability
- Intra- and inter-rater reliability
- Internal consistency
- Validity
- General issues on validity
- Bias
- Positive predictive value
- Jaccard coefficient
Validity is, in general, the ability of the measurement tool to reflect what it is designed to measure (Atkinson and Nevill, 1998). The term test-retest refers to two consecutive measurements of the same subject measured at different points in time. Typically, within-subject variation is expressed as the standard deviation of repeated measurements in the same subject, which allows for a measure of the magnitude of measurement error (Bland and Altman, 1996a).
This gives a power-to-power ratio for repeatability, but not exactly for NAD, since in NAD the first value is used in the denominator instead of the mean. Of the differences, 95% are said to be less than the repeatability coefficient (Bland and Altman, 1986). It is the square root of the mean squared error (MSE) defined for the estimator ˆµ to estimate the population parameter µ.
Measurement error can be estimated from a sample of subjects that is not particularly representative of the population one wishes to study (Hopkins, 2000). Rather, the third issue concerns the evaluation of each objective by each of the same K judges, who are the only judges of interest. The general form of ICC is a ratio of the variance due to differences between subjects (signal) to the total variability of the data (noise) (Weir, 2005).
It refers to the degree to which one's analysis allows one to make the correct decision about the truth or approximate truth of the null hypothesis. This type of validity refers to the inferences that can be made from the operationalizations of the study to the theoretical constructs. Construct validity involves generalization from the program or measures to the concept of the program or measures.
Bias is only useful in simulations because the true value of the parameter must be known. In this thesis we used PPV in the evaluation of validity of the automatic and manual region of interest segmentation methods in PET.
Positron emission tomography – issues on statistical power
- PET – Introduction
- Challenges in PET concerning the statistical power
- Statistical analysis of PET image data
- Preprocessing of PET image data for statistical analysis
- ROI-based statistical analysis
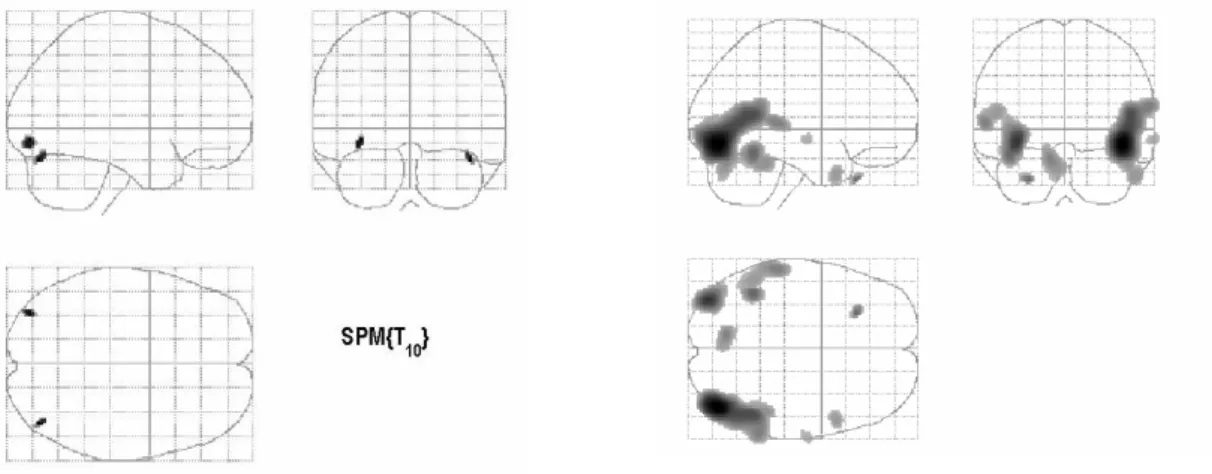
- Voxel-based statistical analysis
- Power of statistical analysis in PET and ways to enhance it
- ROI-based analysis: power
- Voxel-based analysis: power
- Methods of this thesis concerning the power in PET statistical analysis 63
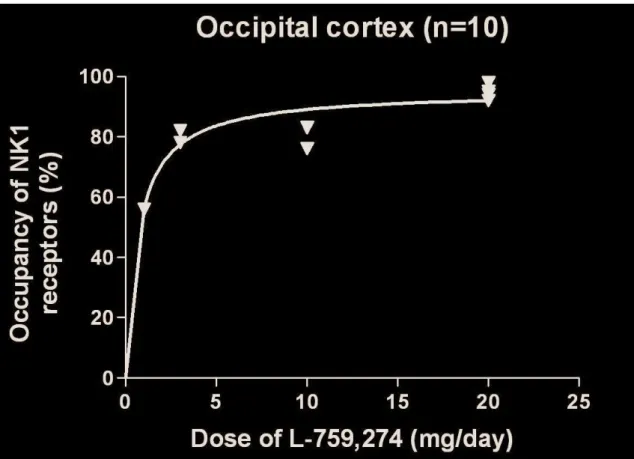
In PET neuroreceptor studies, this is usually done based on blood pressure values (see Hirvonen et al., 2003 for a typical practical implementation). In voxel-based analyses, the search volume can also be smaller than the whole brain using a small volume correction (SVC; Worsley et al., 1996). An alternative to ROI is to use voxel-based small volume correction (SVC) analysis (Worsley et al., 1996), but ROI selection should then be made similarly to ROI rather than directly based on the results of the analysis.
However, the SVC is not power-free (Turkheimer et al., 2004), because there is a loss of power elsewhere in the brain. Another way to increase statistical power is to use nonparametric methods in correcting for multiple testing (Holmes et al., 1996; Nichols and Holmes, 2002). In addition to nonparametric methods, correcting for multiple testing can be made more lenient by evaluating “true” null hypotheses (Turkheimer et al., 2001).
A Bayesian perspective on multiple hypothesis testing can also be used (Turkheimer et al., 2004; Friston et al., 2002). In that approach, there is a separate model for the signal and the noise (Turkheimer et al., 2004). An attractive approach is to use correction based on false discovery rate (FDR) for multiple testing (Genovese et al., 2002).
Some authors have argued that FDR is an exploratory tool (eg Turkheimer et al., 2004), but this is not universally agreed. In the context of neuroimaging, the most recent of these truly non-parametric methods are based on rows (Rorden et al., 2007). In such circumstances, methods based on ranks are more appropriate and have more power (Rorden et al., 2007).
Another way to gain more power is to use a statistical method specifically designed for PET neuroreceptor studies (Aston et al., 2000). However, their problem lies in the statistical inference that can be done implicitly (Jernigan et al., 2003).
Summary of publications
67
Discussion
- The statistical power
- Applications in drug development
- Validation measures
We have shown that the increase in power in the statistical analysis of PET imaging data can be obtained without increasing the sample size. Recently, test-retest studies have also been performed for almost every PET tracer, but the increased power is typically not emphasized in those studies, although the test-retest variation is known to affect power. However, these publications on the voxel-based analysis have used a different statistical iterative image reconstruction method than in this thesis, and they are also PET activation studies unlike most of the publications in this thesis.
When Edition I was in preparation, there were no test-retest studies on the [18F]SPA-RQ PET tracer. Measures of validity, particularly reproducibility and reliability, and their relationship to statistical power, are one of the focuses of this thesis. This is because the absolute difference of the subject versus the subject mean is equivalent to one standard deviation of the difference versus the mean when there are only two measurements per subject (Bland and Altman, 1996b), thus indicating a relationship to power.
However, NAD is better suited than TRV to investigate receptor occupancy due to the similar form of the corresponding equations (equation 6 and equation 7). With NAD, one can determine the absolute effect of test-retest variation for measured receptor occupancy (Publication II). However, with PET test-retest experiments, the different times at which the measurements are taken can be considered the assessors, since the PET measurements are statistical and vary from time to time.
For these reasons, we conclude that with PET test-retest studies, problems are related to both test-retest and interrater reliability. PET imaging of serotonin transporters with [11C]DASB: Test-retest reproducibility using a multilinear parametric tissue reference imaging method. PET imaging of neurokinin-1 receptors with [18F]SPA-RQ in human subjects: Evaluation of reference tissue models and their test-retest reproducibility.
![Figure 7. PET time-radioactivity curve in brain region cerebellum. The unit of activity is kiloBecquerel per milliliter (kBq /ml) and the PET tracer is [ 18 F]SPA-RQ](https://thumb-eu.123doks.com/thumbv2/9pdfco/1890339.266505/53.892.213.649.583.936/figure-radioactivity-region-cerebellum-activity-kilobecquerel-milliliter-tracer.webp)