1 1
2 3
4 This is the post print version of the article, which has been published in Science of the Total Environment 2018, 624, 1504–1512. The final
publication is available at https://doi.org/10.1016/j.scitotenv.2017.12.126 5 6
7 Running head: IAQ and social climate in schools 8
9
10
Indoor air problems and the perceived social climate in schools: a multilevel structural equation 11
analysis 12
13
Eerika Finell*
14
Asko Tolvanen 15
Ulla Haverinen-Shaughnessy 16
Seppo Laaksonen 17
Sakari Karvonen 18
Reijo Sund 19
Pauliina Luopa 20
Juha Pekkanen 21
Timo Ståhl 22
23
*Requests for reprints should be addressed to Eerika Finell, Faculty of Social Sciences, Linna, 33014 24
University of Tampere, Tampere, Finland. E-mail: [email protected] 25
26 27
2 Other affiliations:
1 2
Asko Tolvanen: Methodology Centre for Human Sciences, P.O. Box 35, 40014 University of 3
Jyväskylä, Finland 4
Ulla Haverinen-Shaughnessy: Department of Health Protection, National Institute for Health and 5
Welfare, P.O. Box 95, 70701 Kuopio, Finland 6
Seppo Laaksonen: Department of Social Research, P.O. Box 68, 00014 University of Helsinki, 7
Finland 8
Sakari Karvonen: Department of Health and Social Care Systems, National Institute for Health and 9
Welfare, P.O. Box 30, 00271 Helsinki, Finland 10
Reijo Sund: 1) Centre for Research Methods, Department of Social Research, P.O. Box 18, 00014 11
University of Helsinki, Finland, 2) Institute of Clinical Medicine, University of Eastern Finland, 12
Kuopio, Finland 13
Pauliina Luopa: Department of Welfare, National Institute for Health and Welfare, P.O. Box 30, 14
00271 Helsinki, Finland 15
Juha Pekkanen: 1) Department of Public Health, P.O. Box 20, 00014 University of Helsinki, Finland, 16
2) Department of Health Protection, National Institute for Health and Welfare, Finland 17
Timo Ståhl: Department of Welfare, National Institute for Health and Welfare, Biokatu 10, 18
33520 Tampere, Finland 19
20
21
3 Abstract
1
Indoor air problems in schools appear to influence learning outcomes and absence rates.
2
However, previous research has not investigated whether indoor air problems influence the social 3
climate of schools. Therefore, we studied whether indoor air problems observed in schools 4
associate with students’ perceptions of the teacher-student relationship and class spirit. The 5
nationwide sample of Finnish schools (N = 194 schools/27 153 students) was analyzed using 6
multilevel structural equation modeling. Data on the schools’ social climate collected from 7
students were merged with independently collected data on observed indoor air problems from 8
school principals. We found that the teacher-student relationship was reported to be worse in 9
schools with observed indoor air problems compared to those without observed indoor air 10
problems. Furthermore, the reported class spirit was worse in schools with observed indoor air 11
problems, but only among students with a high grade point average. Our findings indicate that 12
indoor air problems may affect the student-perceived social climate.
13
Keywords (6): indoor air quality, social climate, teacher-student relationship, psychosocial effect, 14
lower secondary school, class spirit 15
16
17 18 19 20 21 22 23
4 1. Introduction
1
Problems in schools’ indoor air quality (IAQ) are widespread. For example, some 24% of schools in 2
Finland, 20% in the Netherlands, and 40% Spain were estimated to have moisture problems, such 3
as dampness or mold. 1 Furthermore, many studies have found that a large proportion of schools 4
are inadequately ventilated. 2–4 Such problems can increase the risk to students’ health, 5,6 5
absence rates, 7,8 and decreased academic performance (e.g., standardized test scores). 3,7,9 6
Despite these findings, little is known about whether and how poor IAQ associates with the 7
students’ perception of social climate in schools. The social climate reflects, for instance, the goals, 8
norms, interpersonal relationships and teaching practices, organizational patterns, and school 9
facilities present in a specific school. 10,11 Poor student-perceived social climate associates with 10
students’ decreased well-being and academic performance, 10–13 lower self-esteem 14 and 11
problems in their school adjustment 15,16, for example. Given that the perceived social climate 12
plays an important role in students’ psychosocial well-being and learning, it is essential to study 13
how schools’ IAQ problems relate to it. The need to study the effects of IAQ on the social climate 14
in schools is acknowledged in the “indoor air research” literature as well. 17 15
16
1.1. Student-perceived social climate and indoor air problems in schools 17
Although there is no previous research assessing whether and how schools’ IAQ problems relate to 18
the student-perceived social climate, some indirect evidence suggests that there may be an 19
association between them. Previous research has associated schools’ IAQ problems with increased 20
rates of teachers’ sick leave and decreased well-being, 18,19 and it may induce interpersonal 21
conflicts as well as anxiety and fear.20 Furthermore, it has been shown that teachers, who perceive 22
their school’s physical environment unsatisfactory, report more negative attitudes and lower 23
5 moral toward their work and notice more problems in the school’s social climate than teachers 1
who perceive the environment as satisfactory. 21–23 Finally, also principals’ perceptions of their 2
school’s physical environment has been associated with their understanding of the school’s ability 3
to deliver instruction.24 4
However, it is unlikely that IAQ problems influence only school personnel. First, given that 5
school’s organizational culture and teachers’ well-being and attitudes relate to the student- 6
perceived social climate, 25–28 it is plausible that also students in schools with IAQ problems report 7
lower social climate than students in schools without such problems. Furthermore, previous 8
research indicates that also students’ perceptions of their school’s physical environment associate 9
with how they perceive the school’s social climate. 11,29 Finally, students’ absence rates have been 10
found to be higher in schools with poor IAQ than in schools without such problems, 8 which may 11
also reflect issues in the social climate, since the social climate associates with school 12
absenteeism. 30 Based on the evidence, it appears that schools’ IAQ problems may relate to factors 13
which constitute the student-perceived social climate, such as perceived social support, discipline, 14
and peer relationships, in many ways.
15
16
1.2. The present study 17
In this study, we focus on two highly relevant factors of the student-perceived social climate:
18
perceived quality of teacher-student relationship and perceived class spirit (i.e., the classroom’s 19
emotional climate). 10,31 These factors are very influential for students’ academic performance, 20
school engagement, health, and health-related behaviors, for example. 32–34 Therefore, it is 21
important to know whether and how IAQ problems in schools relate to these factors. Our first 22
research question asks whether the perceived teacher-student relationship and class spirit among 23
6 lower secondary school students differ between schools with observed IAQ problems and schools 1
without such problems. Based on the literature cited above, 18,20,22,26 we hypothesize that students 2
in schools with IAQ problems report worse perceived quality of the teacher-student relationship 3
and class spirit than students in schools without such problems (H1).
4
Our second research question asks whether the associations between student-level 5
characteristics (e.g., gender) and the student-perceived social climate are different in schools with 6
and without IAQ problems. The need to study this issue is based on previous research showing 7
that students’ perceptions of their school’s social climate is associated with many student-level 8
characteristics, such as gender, socioeconomic status, ethnicity, social support, and academic 9
performance; 13,35,36 different students perceive the social climate of their school differently. Given 10
that not only student characteristics but also contextual factors can have effects on the student- 11
perceived social climate, 37 we also tested whether the association between school-level 12
characteristics (e.g., school size) and the student-perceived social climate are different in these 13
two school contexts. Analyzing these interactions was considered important since is provides 14
information on whether there are certain types of students or schools that are especially 15
susceptible to report poor teacher-student relationship or poor class spirit when facing IAQ 16
problems.Given that there are no previous studies considering this issue, no hypothesis is posed.
17
18
19
7 2. Material and methods
1
2.1. Data and participants 2
The data were obtained from two sources: a) the School Health Promotion Study (SHP) 2013, 3
focusing on comprehensive school students in grades eight and nine (14–16 years old) and b) the 4
Benchmarking System of Health Promotion Capacity Building (BSHPCB) data collections from 5
comprehensive schools in 2013 (for more details, see Finell et al., 2017). 38 The questionnaire of 6
BSHPCB is usually filled in by the school’s principals. Two variables from BSHPCB were used in the 7
analysis. The first variable measured if and when the triennial inspection required by Health Care 8
Act 1326/2010 had been carried out in the school. This regulatory inspection is done in co- 9
operation with the representatives of the school (e.g., a principal), the health authorities, and 10
authorities responsible for construction and maintenance of the school building. It includes a 11
number of factors (not just IAQ related) which can influence the well-being of the school 12
community. The inspection of the indoor environment includes review of existing documents, such 13
as results from possible questionnaires on IAQ and health, IAQ measurements, and other building 14
related reports as well as a building walkthrough focusing on areas where problems have been 15
found or suspected (see Finell et al., 2017; Hietanen-Peltola and Korpilahti, 2015). 38, 39 16
The second variable measured whether or not there were biological exposures observed in 17
the school during this regulatory inspection (see 2.2.2.). BSHPCB questionnaire also asks about 18
physical and chemical exposures. However, we focus only on the item measuring biological 19
exposures here because these issues, especially dampness and mould (“mouldy schools”) have been under 20
intensive public concern since 1990’s in Finland. In the future, it would be interesting to perform comparative 21
analyses on the other two items to test whether the associations with schools’ social climate would be 22
different. For the analysis, we included only those schools where a) the inspection was carried out in 23
8 2012 or 2013 and b) where 1) biological exposures were identified during the inspection but the 1
problems had not been remediated or 2) no indoor air problems were identified. This means that 2
73 schools (N=10181 students, 27%) were excluded from the group of schools where the regulatory 3
triennial inspection was carried out in 2012 and 2013. In these schools a) the biological exposures 4
were not included in the inspection, b) problems were found and they were already corrected or c) 5
no information were provided (see Measures). Sixteen schools with fewer than 10 students were 6
also excluded from the analysis (total of 66 students, 0.2%). In addition, respondents who reported 7
their age as at least two years younger or three years older than the average age of their classmates 8
were excluded from the analysis (n= 64, 0.2%). Two schools with 16 and 12 students were excluded, 9
because they were considered to be school-level outliers (in the teacher-student relationship). The 10
final data consist of 27153 students from 194 schools. About 63 per cent of the students were from 11
schools without observed indoor air problems (17127 students from 127 schools).
12
13
2.2. Measures 14
2.2.1. Outcome variables 15
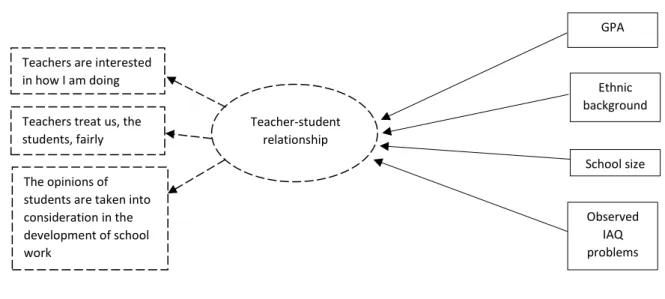
The perceived quality of the teacher-student relationship was measured by three items: “Teachers 16
are interested in how I am doing”, “Teachers treat us, the students, fairly”, and “The opinions of 17
students are taken into consideration in the development of school work”. The response scale was 18
1 = fully agree, 2 = agree, 3 = disagree, and 4 = fully disagree. These items have been used in many 19
previous studies as indicators of the teacher-student relationship. 27,40,41 We modeled teacher- 20
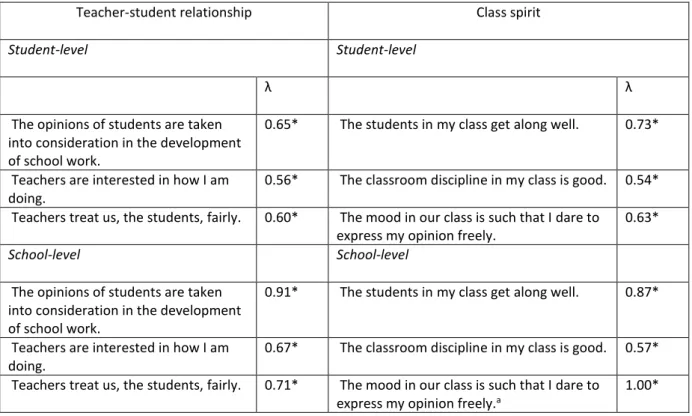
student relationship as a latent factor with these three items. The standardized loadings of the 21
confirmatory factor analysis are presented in Table 2. The fit indicators are reported in Result 22
section (see also Supporting information). The Cronbach alpha was 0.63.
23
9 The class spirit was measured by three items: “The students in my class get along well”, “The 1
classroom discipline in my class is good” and “The mood in our class is such that I dare to express 2
my opinion freely”. The response scale was the same as above. These items have been used 3
previously by Karvonen and colleagues 40 as an indicator of class spirit. As above, we modeled class 4
spirit as a latent factor. The standardized loadings are presented in Table 2. The fit indicators are 5
reported in Result section (see also Supporting information). The Cronbach alpha was 0.67. The 6
data source of the outcome variables was the SHP.
7 8
2.2.2. Predictor 9
The BSHPCB survey item “Were the following issues evaluated in the most recent inspection:
10
Exposure to biological agents (indoor air, mold, etc.)” had the following response options: no data 11
available; not included in the inspection; inspected, no deficiencies detected; inspected, 12
deficiencies detected but not yet corrected; inspected, deficiencies detected and corrected. In this 13
study, we focus only on the following options: 0 = inspected, no deficiencies detected and 1 = 14
inspected, deficiencies detected but not yet corrected. The resulting variable is referred to as 15
“observed IAQ problems”.
16 17
2.2.3. Background variables 18
Gender (0 = boy, 1 = girl), age, perceived health, parental support, and education of the mother 19
were included only at the student-level (see Statistical analyses and Figures 1 and 2 below).
20
Perceived health was measured by the item: “How is your health in general?” The response scale 21
was 1 = very good, 2 = fairly good, 3 = moderate, and 4 = fairly or very poor The scale was 22
categorized into two categories (0 = very good, 1 = not very good), because only a small 23
proportion reported moderate or bad health. The similar kind of categorization has been used in 24
10 other indoor air studies. 42, 43 Parental support was measured by a single item: “Can you talk about 1
things that concern you with your parents?” The response scale was 1 = hardly ever, 2 = every 2
once and a while, 3 = fairly often, and 4 = often. The scale was reversed so that 1 indicated good 3
support and 4 low support. Education of the mother was measured based on response options 1 = 4
comprehensive school or primary school, 2 = upper secondary school or vocational education 5
institution, 3 = occupational studies in addition to upper secondary school or vocational education 6
institution, 4 = university, university of applied sciences, or other higher education institution, and 7
5 = no education. The responses were categorized into two categories: 0 = no university degree 8
education, 1 = university, university of applied sciences, or other higher education institution (i.e., 9
university degree). Parents’ higher education has shown to relate strongly to many important 10
factors in Finland such as their children’s future participation in higher education 44 and school 11
choice. 45 12
Students’ self-reported grade point average (GPA) and ethnic background were included 13
both at the student- and the school-levels (see Statistical analyses and Figures 1 and 2 below). In 14
Finland, grades range from 4 (low) to 10 (high). In the original data, GPA was categorized into eight 15
categories (1 = < 6.5, 2 = 6.5–6.9, 3 = 7.0–7.4, 4 = 7.5–7.9, 5 = 8.0–8.4, 6 = 8.5–8.9, 7 = 9.0–9.4, and 16
8 = 9.5–10). These categories were recoded into three approximately equally sized categories: 0 17
corresponding to a GPA less than 7.5, 1 corresponding to a GPA between 7.5 and 8.4, and 2 18
corresponding to a GPA more than 8.4. Ethnic background was measured by two items: In which 19
country were your 1) mother and 2) father born? The items were recoded so that the value 0 20
means that one or both parents were born in Finland, whereas the value 1 means that both 21
parents were born outside Finland. Given that immigration on a larger scale started in Finland as 22
late as in the 1990s, 46 it is very unlikely that second generation immigrants would have children of 23
11 the target age. No missing items were accepted. The data source of all the aforementioned
1
background variables was the SHP.
2
The school’s size (i.e., number of students) reported in the BSHPCB was used only as a 3
school-level background variable.
4 5
2.3. Statistical analyses 6
Given that in our data, school children were nested within schools, we built and then analyzed a 7
multilevel structural equation model (MSEM). MSEM makes it possible to decompose both the 8
variance and the measurement error of the outcome variables at the student- and school-levels.
9
47,48 As previously, 38 we used full information maximum likelihood estimation (FIML) with robust
10
standard errors as an estimation method. Mplus statistical software 7.0 was used in the analysis. 49 11
First, we tested the model fit of each measurement model (see Figures 1 and 2). This was 12
done by carrying out a two-level confirmatory factor analysis for both the teacher-student 13
relationship and class spirit variables separately. The loadings were fixed equally at the student 14
and school-levels 47 (see Table 2 and further information on measurement models in Supporting 15
information). We used the Standardized Root Mean Square Residual (SRMR), Comparative Fit 16
Index (CFI), and Root Mean Square Error of Approximation (RMSEA) as fit indicators in all the 17
models. SRMR < 0.08, CFI > 0.95, and RMSEA < 0.06 indicates a good fit between the hypothetical 18
model and the observed data. 50 Due to the large sample size, the chi-squared test was not used.
19
After the two-level confirmatory factor analyses was carried out, we calculated the intraclass 20
correlations (ICC) of the latent factors (i.e., teacher-student relationship and class spirit) and each 21
predictor.47 22
23
12 _________________
1
Figures 1 and 2 here 2
___________________
3
In order to test whether observed IAQ problems associated with the teacher-student 4
relationship and class spirit (H1), we estimated two random intercept models (see Figures 1 and 5
2). In the random intercept model, the intercept coefficients are allowed to vary across schools. To 6
avoid biased results we used latent factors instead of aggregated variables in both level as recommended.
7
53 This method allowed us to decompose the covariates into two uncorrelated latent factors by 8
Mplus. The first component represents the deviation of students’ answers from their school mean 9
(i.e. student level). The second component represents the school mean (e.g. the cluster mean of 10
school-related stress) and it reflects the deviation of each school mean from the grand mean (i.e.
11
school level). 54, 55 All predictors, except the dichotomous ones, were centered by their grand 12
means.
13
The hypothesized random intercept models are presented in Figures 1 and 2. First, we used 14
gender, age, perceived health, and parental support only as student-level variables because of 15
their low intraclass correlations (ICC ≤ 0.01)47. We also included the mother’s education only at the 16
student-level because it had a high correlation with GPA at the school-level (r = 0.70).
17
Furthermore, the univariate associations between mother’s education and outcome variables 18
were not significant at the school-level. Second, we included school size and observed IAQ 19
problems only at the school-level. Finally, we included the ethnic background (ICC = 0.07) and GPA 20
(ICC = 0.04) both at the student and school-levels. This was possible by decomposing each variable 21
into two latent uncorrelated components (one at the student-level and one at the school-level) by 22
Mplus as explained above. 49,54 23
13 In the text we report the standardized estimates (i.e., when the predictor increases by one 1
standard deviation, the outcome variable increases by the standardized estimate) as well as 2
separate R2 for both the student- and school-levels provided by Mplus.56In the tables we also 3
report the unstandardized estimates. When necessary, we report the effect sizes. The effect size is 4
calculated as follows: the unstandardized beta divided by the standard deviation of the factor in 5
the measurement model. This index is equivalent to Cohen’s d. 57 Finally, we checked the linearity 6
of the main associations by including the quadratic terms of each variable (except the 7
dichotomous ones) in the models. If the quadratic term was significant (p < 0.05), it was included 8
in the final model and reported.
9
Next, we tested whether observed IAQ problems modify the associations between 10
background variables and outcome variables. Two identical models were built for 1) schools with 11
observed IAQ problems and 2) schools without observed IAQ problems. The models were tested 12
simultaneously (i.e., multigroup two-level structural equation modeling). 58 All included 13
background variables were the same as in Models 1a and 1b (see Table 2). The Wald-test was used 14
to determine whether the associations between background variables and outcome variables in 15
the two contexts (i.e., observed IAQ problems vs. no observed IAQ problems) differed significantly 16
from each other (p < 0.05).
17
18
2.4. Missing values 19
Gender and observed IAQ problems had the lowest percentages of missing values (0%) and the 20
mother’s education had the highest (10%). Values were assumed to be missing at random 21
(MAR).59 In order to deal with missing data, we used a full information maximum likelihood (FIML) 22
14 estimation that produces unbiased values of parameters by determining the value that maximizes 1
the likelihood function based on all available data. 560 2
3 4
3. Results 5
Descriptive statistics of the observed outcome variables and background variables are presented 6
in Table 1. Only one significant difference in background variables between schools were found:
7
students reported significantly worse perceived health in schools with observed IAQ problems 8
than in schools without such problems (see Table 1).
9 10 11 12 13 14 15 16 17 18
15 Table 1. Descriptive statistics of the full data by indoor environment context (outcome and 1
background variables N = 24451–27153students/192–194 schools).
2
No observed IAQ problems Observed IAQ problems
N % or Mean
(SD)
N % or Mean
(SD)
pf
Outcome variables
Teachers are interested in how I am doing (%)
Fully agree Agree Disagree Fully disagree
632 6725 7902 1697
4 40 47 10
337 3746 4795 1058
3 38 48
11 0.003
Teachers treat us, the students, fairly (%) Fully agree Agree Disagree Fully disagree
1836 10478 3713 897
11 62 22 5
899 6000 2386 629
9 61 24
6 0.000
The opinions of students are taken into consideration in the development of school work (%)
Fully agree Agree Disagree Fully disagree
962 8877 5885 1173
6 53 35 7
426 5050 3611 786
4 51 37
8 0.000
The students in my class get along well (%) Fully agree Agree Disagree Fully disagree
3645 9827 2832 646
22 58 17 4
1993 5684 1815 426
20 57 18
4 0.000
The classroom discipline in my class is good (%)
Fully agree Agree Disagree Fully disagree
1424 8464 5500 1562
8 50 32 9
709 4804 3428 972
7 49 35
10 0.000
The mood in our class is such that I dare to express my opinion freely (%)
Fully agree Agree Disagree Fully disagree
5046 8332 2802 785
30 49 17 5
2931 4787 1705 500
30 48 17
5 0.176
Background variables
Gender (female %) 8430 49 4990 50 0.382
Age (years) 16635 15.4 (0.6)a 9729 15.4 (0.6)b 0.639
Perceived health (very good %) 5915 35 3172 32 0.000
Parental support (%) Often
Fairly often
Every once and a while Hardly ever
4528 5424 5534 1325
27 32 33 8
2574 3278 3201 793
26 33 33
8 0.259
Grade point average (%) < 7.5 7.5–8.4 > 8.4
5556 6399 5054
33 38 30
3320 3731 2879
33 38
29 0.327
Education of mother (university degree %) 5727 37 3276 37 0.437
Ethnic background (both parents born outside of Finland %)
654 4 346 4 0.125
School size (students per school)
125e 332.7c
(187.5) 67 379.7d
(187.6) 0.099
3
a Min–max: 13.5–18.2 4
b Min–max: 13.5–18.1 5
c Min–max: 67–936 6
d Min–max:53–933 7
e Missing information from two schools 8
f Age and school size: F-test. All other variables: χ2 – test 9
16 3.1. The association between observed IAQ problems and the student-perceived schools’ social 1
climate 2
First, we tested the fit of each measurement model (see Figures 1 and 2) by carrying out a two- 3
level confirmatory factor analysis for each variable separately. In order to do that we fixed the 4
loadings equally at the student and school-levels. 47 The model fits were good both for the 5
teacher-student relationship (RMSEA = 0.01, CFI = 1.00, SRMR: student-level = 0.00, SRMR: school- 6
level = 0.08) and class spirit (RMSEA = 0.01, CFI = 1.00, SRMR: student-level = 0.00, SRMR: school- 7
level = 0.05). The standardized factor loadings are presented in Table 2 (see further information on 8
measurement models and the fit indicators in Supporting information).
9
Table 2. Standardized loadings of the teacher-student relationship and class spirit latent 10
variables(student-level: N = 27018–27025/ School-level: N = 194).
11
Teacher-student relationship Class spirit
Student-level Student-level
λ λ
The opinions of students are taken into consideration in the development of school work.
0.65* The students in my class get along well. 0.73*
Teachers are interested in how I am doing.
0.56* The classroom discipline in my class is good. 0.54*
Teachers treat us, the students, fairly. 0.60* The mood in our class is such that I dare to express my opinion freely.
0.63*
School-level School-level
The opinions of students are taken into consideration in the development of school work.
0.91* The students in my class get along well. 0.87*
Teachers are interested in how I am doing.
0.67* The classroom discipline in my class is good. 0.57*
Teachers treat us, the students, fairly. 0.71* The mood in our class is such that I dare to express my opinion freely.a
1.00*
* p < 0.001 12
a The residual variance is set to zero at the school-level.
13 14
17 There was a statistically significant variability both in the latent teacher-student relationship 1
- variable within (σ2W = 0.204, p < 0.001) and between schools (σ2B = 0.010, p < 0.001) and in the 2
latent school spirit - variable within (σ2W = 0.276, p < 0.001) and between schools (σ2B = 0.012, p <
3
0.001). The ICC of the both latent variables were 0.05 and 0.04 respectively, meaning that about 4
4–5% of the variability occurred between schools. Although the ICCs were relatively small, they 5
had strong design effects (DEFF;61 teacher-student relationship: DEFF = 7.46; school spirit: DEFF = 6
6.76).
7
Then we estimated two random intercept models (i.e., Model 1a and Model 1b) in order to 8
test whether the perceived teacher-student relationship and class spirit differed between schools 9
with and without observed IAQ problems (see Table 3). The model fits were good both for the 10
teacher-student relationship (Model 1a: RMSEA = 0.02, CFI = 0.97, SRMR: student-level = 0.01, 11
SRMR: school-level = 0.07, see Table 2) and for school spirit (Model 1b: RMSEA = 0.02, CFI = 0.99, 12
SRMR: student-level = 0.01, SRMR: school-level = 0.06, see Table 2). After all background variables 13
were inserted into Model 1a, observed IAQ problems associated significantly with the teacher- 14
student relationship. The effect size was 0.5, indicating a medium-sized effect 57. However, after 15
all background variables were inserted into Model 1b, observed IAQ problems did not associate 16
significantly with school spirit (see further information on univariate associations in Supporting 17
information) . 18
In Model 1a, the most important student-level background variables were parental support, 19
perceived health, and GPA. The most important school-level background variables were ethnic 20
composition (measured by students’ self-reported ethnic background)and the school’s average 21
GPA. In Model 1b, the most important student-level background variables were parental support, 22
gender, and perceived health. The most important school-level background variables were school 23
18 size and the school’s average GPA (see Table 2). Model 1a explained 11% of the total variance at 1
the student-level (R2 = 0.114) and 22% at the school-level (R2 = 0.222). Model 1b explained 8% of 2
the total variance at the student-level (R2 = 0.077) and 16% at the school-level (R2 = 0.157), 3
respectively (see Table 2).
4 5 6 7 8 9 10 11 12 13 14 15 16 17 18 19 20 21 22 23
19 Table 3. Parameter estimates for the teacher-student relationship and the classroom’s social 1
climate1 as a function of student- and school-level variables: A random intercept model 2
(N=27153 students/194 schools).
3
Model 1a
Teacher-student relationship
Model 1b Class spirit
B (SE)a β (SE)b B (SE)a β (SE)b
Student-level
Genderc -0.06 (0.01)*** -0.07 (0.01)*** 0.13 (0.01)*** 0.13 (0.01)***
Aged 0.01 (0.01) 0.02 (0.01) -0.02 (0.01) -0.02 (0.01)
Age squarede -0.06 (0.01)*** -0.06 (0.01)***
Perceived healthf 0.08 (0.01)*** 0.09 (0.01)*** 0.16 (0.01) *** 0.15 (0.01)***
Parental supportg 0.12 (0.00)*** 0.26 (0.01)*** 0.07 (0.01)*** 0.13 (0.01)***
Parental support squarede 0.03 (0.00)*** 0.06 (0.01)*** 0.02 (0.01)*** 0.03 (0.01)***
Education of mother h 0.05 (0.01)*** 0.06 (0.01)*** -0.02 (0.01) -0.01 (0.01) Grade point averagei -0.06 (0.01)*** -0.11 (0.01)*** 0.01 (0.01)* 0.02 (0.01)*
Grade point average squarede -0.02 (0.01)* -0.02 (0.01)*
Ethnic backgroundj -0.02 (0.03) -0.01 (0.01) 0.08 (0.03)** 0.03 (0.01)**
School-level
Observed IAQ problemsk 0.05 (0.02)** 0.25 ( 0.08)** 0.02 (0.02) 0.08 (0.08) Grade point averaged -0.22 (0.09)*l -0.28 (0.10)** -0.24 ( 0.09) ** -0.27 (0.10)**
Ethnic background -0.36 (0.12)** -0.19 (0.09)*n 0.03 (0.19) 0.02 (0.09) School size o 0.01 (0.00)m 0.16 (0.08)* 0.01 (0.01)* 0.24 (0.09)*
σ2W 0.17 (0.01) 0.89 (0.01) 0.24 (0.01) 0.92 (0.01)
σ2B 0.01 (0.00) 0.78(0.07) 0.01 (0.00) 0.84 (0.08)
*p < 0.05, **p < 0.01, *** p < 0.001 4
1 A higher value in the teacher-student relationship and the classroom’s social climatemeans more problems.
5
a Unstandardized beta 6
b Standardized beta 7
c Scale 0–1 (0 = boy) 8
d Grand mean centered 9
e Quadratic term. Only if the quadratic term was significant (p < 0.05), it was included in the final model and reported.
10
There were no significant quadratic terms at the school-level.
11
f Scale 0–1 (0 = very good health) 12
20
g Scale 1–4 (1 = good support, grand mean centered) 1
h Scale 0–1 (1 = university education) 2
i Scale 0–2 (0 = GPA less than 7.5, grand mean centered) 3
j Scale 0–1 (0 = one or both parents are born in Finland) 4
k Scale 0–1 (0 = no observed IAQ problems in the school) 5
l p = 0.012 6
m p = 0.064 7
n p = 0.027 8
o In these models the scale was changed as follows: school size/100.
9 10
3.2. The effect of the school’s IAQ problems on the associations between the background and 11
outcome variables 12
We tested differences on the associations between a) student-level characteristics and the 13
student-perceived social climate and b) school-level characteristics and the student-perceived 14
social climate in schools with and without IAQ problems. In order to test these differences we 15
used multigroup two-level structural equation modeling and Wald-test. The association between 16
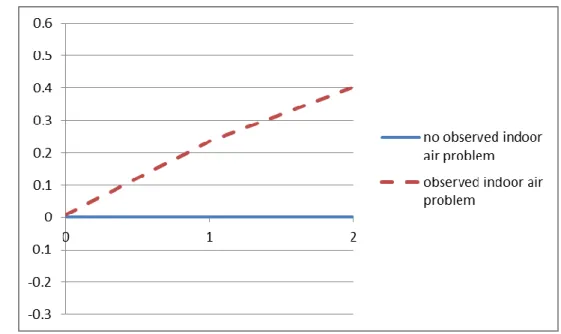
student-level GPA and class spirit was moderated by observed IAQ problems (Wald-test = 6.04, p = 17
0.014). This association was stronger in schools with IAQ problems (standardized beta = 0.05, p <
18
0.001) than in schools where there were no such problems (standardized beta = 0.00, p = 0.821;
19
see further information on univariate associations in Supporting information). In order to better 20
understand this result, we ran three separate analyses. We tested students whose GPA was a) less 21
than 7.5, b) between 7.5 and 8.4 and c) over 8.4. Except for GPA, the other background variables 22
in these three analyses were the same as in Model 1b (see Table 2). Students with the highest GPA 23
(i.e., over 8.4) perceived more problems in class spirit in schools with observed IAQ problems than 24
in schools without such problems (standardized beta = 0.19, p = 0.032). The effect size is 0.4, 25
indicating a small-sized effect. 57 There were no differences between schools among students in 26
the lower GPA clusters (GPA 7.5–8.4: standardized beta = 0.12, p = 0.193; GPA < 7.5: standardized 27
beta = 0.01, p = 0.948).
28
21 1
Figure 3. The mean difference of class spirit between schools with and without observed IAQ 2
problems divided by the standard deviation of class spirit.
3
0 = GPA < 7.5, p = 0.948; 1 = GPA 7.5–8.4, p = 0.193; 2= GPA > 8.4, p = 0.032 (N = 193–194 4
schools).
5 6
Furthermore, the linear terms of the parental support and teacher-student associations were 7
significantly different (Wald-test = 4.75, p = 0.029) between the two school contexts (no observed 8
IAQ problems: standardized beta = 0.27, p < 0.001; observed IAQ problems: standardized beta = 9
0.23, p < 0.001; see further information on univariate associations in Supporting information). The 10
Wald-test between quadratic terms was not significant (Wald-test = 0.50, p = 0.479). This small 11
effect indicates that the difference in the perceived quality of the teacher-student relationship 12
between the two school contexts was larger among students with high parental support than 13
students with low parental support. In total, students with low parental support, however, 14
evaluated their teacher-student relationship more negatively than students with high parental 15
support.
16
17
18
Grade point average
Class spirit
22 4. Discussion
1
Our main finding was that on average, students in schools with observed IAQ problems reported 2
worse teacher-student relationship than students in schools without such problems. Furthermore, 3
we found that students with a high GPA reported worse class spirit in schools with IAQ problems 4
than in schools without such problems.
5
Previous research has reported associations between poor IAQ in schools and both health 6
and learning outcomes (e.g., respiratory symptoms, illness absence, and academic performance).
7
3,7,9,62 Our findings contribute to this research by showing that IAQ problems in schools may have
8
an effect on the student-perceived social climate. To our knowledge, this is the first time when 9
these effects have been assessed. Given that social climate is shown to influence various factors, 10
such as academic performance, absence rates, and students’ psychosocial well-being, 10,30,31 our 11
findings are important. Furthermore, we found that a school’s observed IAQ problems significantly 12
modified the associations between student-level characteristics and the student-perceived social 13
climate. Although these associations were weak, the findings supported the previous research by 14
Finell and colleagues38 by concluding that schools with and without IAQ problems may represent 15
two different social contexts. They also suggest that the social and psychological consequences of 16
IAQ problems in schools result from complex processes where both the students’ and school 17
personnel’s characteristics play a role.
18
An important task for future research is to examine why IAQ problems in schools may 19
influence the student-perceived social climate. Our results and the literature provide three 20
potential intertwined paths. The first path relates to the impact of poor IAQ on school personnel, 21
for example by decreasing their well-being, increasing sick leave, and causing possible problems in 22
management and decision-making procedures. 19,20,26,28,63 The second path relates to the impact of 23
23 poor IAQ on students. The students’ perceived health is associated with the student-perceived 1
social climate, 10 as was also found in our study. The third path relates to the poor condition of the 2
school facilities as well as anticipated remediation of the school building. 22,23 In Finland, school 3
general management and facility management are independent from each other. In other words, 4
school principals and staff do not have a direct role or oversight of the facility management. They 5
can report any issues or concerns but the allocation of funds for school facility management and 6
remediation decisions are made by the municipality technical board. However, remediation 7
processes often result in disturbances (e.g., moving to temporal buildings and/or noise), which can 8
be stressful both to school personnel and students, and may therefore influence the student- 9
perceived social climate.
10
From a practical point of view, an important question is how it is possible to prevent the 11
potential social consequences caused by IAQ problems in schools. The main task is naturally to 12
investigate and properly remediate indoor air problems in the school building. However, these 13
processes are often slow. In case the remediation is delayed, the prevention of health problems 14
among teachers and students can involve source control (e.g., more frequent cleaning), enhanced 15
ventilation, and exposure prevention (e.g., not using problematic areas). Furthermore, 16
management and decision-making procedures should be developed in order to avoid conflicts 17
inside the school organization and experiences of injustice.64 Open communication and sharing 18
up-to-date (regular, factual) information with school personnel, students, and parents should help 19
to maintain trust between parties.
20
The strengths of the study include the large and representative sample. The use of multilevel 21
structural equation models has many advantages, including better statistical power compared to 22
models using aggregated school-level data and avoiding spurious findings from using student-level 23
24 data without taking the hierarchical data structure into account. 48 The limitations of the study 1
include the cross-sectional design and the use of questionnaire data. Furthermore, we did not 2
have physical measures. This means that we have to rely on principles report on the findings of 3
triennial inspection on biological exposures and that we are cannot better distinguish schools 4
based on the factors that have caused their IAQ problems. It is likely that there exists variation in 5
the severity of schools’ IAQ problems and their social consequences. We also do not know the 6
degree teachers and students were aware of their school’s IAQ problems. In the future, these 7
issues should be further studied using longitudinal data and physical measures. Future research 8
should also detect factors that can mediate the association between school’s indoor environment 9
and the perceived social climate. Also possible building-related confounders (e.g., poor sanitary 10
conditions or unpleasant school environment) should be considered.
11
The present study is part of a larger project aiming to clarify associations between 12
psychosocial factors and IAQ problems among comprehensive school students in Finland. In a 13
previous study, we found associations between both the physical and psychosocial environment 14
and subjective IAQ in schools. 38 In the present study, psychosocial factors are the outcome 15
variables. Our study underlines the fact that the associations between the perception of IAQ 16
problems and psychosocial factors are highly complex and are likely to influence each another in 17
various ways.
18
19
20
21
22
25 5. Conclusions
1
Our study found that problems in a school’s IAQ associated with the student-perceived social 2
climate. Furthermore, we found that the school’s observed IAQ problems significantly modified 3
the associations between student-level characteristics and the student-perceived social climate.
4
Our study points to a need to study schools’ IAQ problems from a multidisciplinary perspective in 5
order to better understand how IAQ problems influence students’ psychosocial well-being.
6
Furthermore, from practical point of view, when evaluating the urgency of remediation, also IAQ 7
problems’ possible social consequences should be taken into account. Fast and effective 8
remediation process not only prevent adverse health effects but can also prevent problems in 9
school’s social climate.
10 11 12 13 14 15 16 17 18 19 20 21 22 23 24
26 References
1
1. Haverinen-Shaughnessy U, Borras-Santos A, Turunen M, et al. Occurrence of moisture 2
problems in schools in three countries from different climatic regions of Europe based on 3
questionnaires and building inspections - the HITEA study: Occurrence of moisture problems in 4
schools. Indoor Air. 2012;22:457–466.
5
2. Haverinen-Shaughnessy U, Shaughnessy RJ, Cole EC,et al. An assessment of indoor 6
environmental quality in schools and its association with health and performance. Build.
7
Environ. 2015;93:35–40.
8
3. Toyinbo O, Shaughnessy R, Turunen M, et al. Building characteristics, indoor environmental 9
quality, and mathematics achievement in Finnish elementary schools. Build. Environ.
10
2016;104:114–121.
11
4. WHO. School environment: policies and current status. WHO Regional Office for Europe. 2015.
12
5. Annesi-Maesano I, Hulin M, Lavaud F, et al. Poor air quality in classrooms related to asthma 13
and rhinitis in primary schoolchildren of the French 6 Cities Study. Thorax.2012;67: 682–688.
14
6. Borràs-Santos A, Jacobs JH, Täubel M, et al. Dampness and mould in schools and respiratory 15
symptoms in children: the HITEA study. Occup. Environ. Med. 2013;70:681–687.
16
7. Mendell MJ, Eliseeva EA, Davies MM, et al. Association of classroom ventilation with reduced 17
illness absence: a prospective study in California elementary schools. Indoor Air. 2013;23:515–
18
528.
19
8. Simons E, Hwang SA, Fitzgerald EF, et al. The impact of school building conditions on student 20
absenteeism in upstate New York. Am. J. Public Health. 2010;100:1679–1686.
21
9. Haverinen-Shaughnessy U, Shaughnessy RJ. Effects of classroom ventilation rate and 22
temperature on students’ test scores. PLOS ONE. 2015;10:
23
e0136165.doi.org/10.1371/journal.pone.0136165.
24
27 10. Cohen J, McCabe EM, Michelli NM, Pickeral T. School climate: research, policy, practice, and 1
teacher education. Teach. Coll. Rec. 2009;111:180–213.
2
11. Zullig KJ, Koopman TM, Patton JM, Ubbes VA. School climate: historical review, instrument 3
development, and school assessment. J. Psychoeduc. Assess. 2010;28:139–152.
4
12. Anderson CS. The search for school climate: a review of the research. Rev. Educ. Res.
5
1982;52:368–420.
6
13. Thapa A, Cohen J, Guffey S, Higgins-D’Alessandro A. A review of school climate research. Rev.
7
Educ. Res. 2013;83:357–385.
8
14. Way N, Reddy R, Rhodes J. Students’ perceptions of school climate during the middle school 9
years: associations with trajectories of psychological and behavioral adjustment. Am. J.
10
Community Psychol. 2007; 40: 194–213.
11
15. Kuperminc GP, Leadbeater BJ, Emmons C, Blatt SJ. Perceived school climate and difficulties in 12
the social adjustment of middle school students. Appl. Dev. Sci. 1997; 1: 76–88.
13
16. Loukas A. Murphy JL. Middle school student perceptions of school climate: Examining 14
protective functions on subsequent adjustment problems. J. Sch. Psychol. 2007; 45: 293–309.
15
17. Magzamen S, Mayer AP, Schaeffer JW, Reynolds SJ. Advancing a multidisciplinary research 16
framework on school environment, occupant health, and performance. Indoor Air.
17
2015;25:457–461.
18
18. Ervasti J, Kivimäki M, Kawachi I, et al. School environment as predictor of teacher sick leave:
19
data-linked prospective cohort study. BMC Public Health. 2012;12:770.
20
19. Sahakian NM, White SK, Park JH, et al. Identification of mold and dampness-associated 21
respiratory morbidity in 2 schools: comparison of questionnaire survey responses to national 22
data. J. Sch. Health. 2008;78:32–37.
23
28 20. Lahtinen M, Huuhtanen P, Kähkönen E, Reijula K. Psychosocial dimensions of solving an indoor 1
air problem. Indoor Air. 2002;12:33–46.
2
21. Earthman G I, Lemasters LK. Teacher attitudes about classroom conditions. J. Educ. Adm. 2009;
3
47: 323–335.
4
22. Uline C, Tschannen‐Moran M. The walls speak: the interplay of quality facilities, school 5
climate, and student achievement. J. Educ. Adm. 2008;46:55–73.
6
23. Uline CL, Tschannen‐Moran M, DeVere Wolsey T. The walls still speak: the stories occupants 7
tell. J. Educ. Adm. 2009;47:400–426.
8
24. Duyar, I. Relationship between school facility conditions and the delivery of instruction.
9
Evidence from a national survey of school principals. J. Facil. Manag. 2010; 8: 8–25.
10
25.Cassidy DJ, King EK, Wang YC, et al. Teacher work environments are toddler learning 11
environments: teacher professional well-being, classroom emotional support, and toddlers’
12
emotional expressions and behaviours. Early Child Dev. Care.2016.
13
doi:10.1080/03004430.2016.1180516.
14
26. Elovainio M, Pietikäinen M, Luopa P, et al. Organizational justice at school and its associations 15
with pupils’ psychosocial school environment, health, and wellbeing. Soc. Sci. Med.
16
2011;73:1675–1682.
17
27.Hoglund WLG, Klingle KE, Hosan NE. Classroom risks and resources: Teacher burnout, 18
classroom quality and children’s adjustment in high needs elementary schools. J. Sch. Psychol.
19
2015;53: 337–357.
20
28.Virtanen M, Kivimäki M, Luopa P, et al. Staff reports of psychosocial climate at school and 21
adolescents’ health, truancy and health education in Finland. Eur. J. Public 22
Health.2009;19:554–560.
23