Influence of biogenic emissions from boreal forests on aerosol-cloud interactions
1 2
T. Petäjä1,2*, K. Tabakova1, A. Manninen1,3, E. Ezhova1, E. O’Connor3,4, D. Moisseev1,3,
3
V.A. Sinclair1, J. Backman1,3, J. Levula1, K. Luoma1, A. Virkkula1,2,3, M. Paramonov1,3,
4
M. Räty1, M. Äijälä1, L. Heikkinen1, M. Ehn1, M. Sipilä1, T. Yli-Juuti5, A. Virtanen5, M.
5
Ritsche6, N. Hickmon6, G. Pulik7, D. Rosenfeld7, D.R. Worsnop1,8, J. Bäck9, M.
6
Kulmala1,2,10,11 and V.-M. Kerminen1
7
1Institute for Atmospheric and Earth System Research (INAR) / Physics, Faculty of
8
Science, University of Helsinki, Finland
9
2Joint International Research Laboratory of Atmospheric and Earth System Sciences
10
(JirLATEST), School of Atmospheric Sciences, Nanjing University, Nanjing, China
11
3Finnish Meteorological Institute, Helsinki, Finland
12
4University of Reading, UK
13
5Department of Applied Physics,University of Eastern Finland, Kuopio, Finland
14
6Argonne National Laboratory, Lemont, IL, USA
15
7Institute of Earth Sciences, The Hebrew University of Jerusalem, Jerusalem, Israel.
16
8Aerodyne Research Inc., Billerica, MA, USA
17
9Institute for Atmospheric and Earth System Research (INAR) / Forest Sciences, Faculty
18
of Agriculture and Forestry, University of Helsinki, Finland
19
10Aerosol and Haze Laboratory, Beijing Advanced Innovation Center for Soft Matter
20
Sciences and Engineering, Beijing University of Chemical Technology (BUCT), Beijing,
21
China
22
11Faculty of Geography, Lomonosov Moscow State University, Moscow, Russia
23 24 25
*Correspondence to: [email protected]
26 27
Abstract
28 29
Boreal forest acts as a carbon sink and contributes to the formation of secondary organic
30
aerosols via emission of aerosol precursor compounds. However, these influences on the
31
climate system are poorly quantified. Here we show direct observational evidence that
32
aerosol emissions from the boreal forest biosphere influence warm cloud microphysics and
33
cloud-aerosol interactions in a scale-dependent and highly dynamic manner. Analyses of
34
in-situ and ground-based remote sensing observations from the SMEAR II station in
35
Finland, conducted over eight months in 2014, reveal significant increases in aerosol load
36
over the forest one to three days after aerosol-poor marine air enters the forest environment.
37
We find that these changes are consistent with secondary organic aerosol formation and,
38
together with water vapor emissions from evapotranspiration, are associated with changes
39
in the radiative properties of warm, low-level clouds. The feedbacks between boreal forest
40
interactions in air transported over the forest over timescales of several days suggest boreal
42
forests have the potential to mitigate climate change on a continental scale. Our findings
43
suggest that even small changes in aerosol precursor emissions, whether due to changing
44
climatic or anthropogenic factors, may substantially modify the radiative properties of
45
clouds in moderately polluted environments.
46 47 48
Interactions between aerosol particles and clouds constitute a key uncertainty in our
49
knowledge of the Earth’s energy budget and anthropogenic climate1. The aerosol-induced
50
radiative forcing of warm clouds results from changes in the cloud droplet number
51
concentration, cloud liquid water path and fractional cloud cover2. There is ample evidence
52
that aerosol particles are capable of modifying cloud microphysical properties, whereas
53
much less is known about the responses of cloud cover or liquid water path to aerosol
54
perturbations3-11. Very little is known about how cloud properties are affected by dynamic
55
changes in an ambient aerosol particle population over time and space. Here, we provide
56
an observation-based estimate of the effects that emissions from a boreal forest biosphere
57
have on the time evolution of the aerosol population, warm cloud microphysics, aerosol-
58
cloud interactions and precipitation. Our data set represents clean maritime air that is
59
transformed into continental air, addressing the specific need to reduce the large
60
uncertainties in the aerosol radiative forcing caused by natural aerosols12.
61 62
Boreal forests, situated in a circumpolar belt in the Northern latitudes13, are among the most
63
active areas of atmospheric new particle formation (NPF)14-16. The particles formed by NPF
64
in this environment grow in size during atmospheric transport (Fig. 1) and, for air masses
65
originating from clean areas outside the winter period, a vast majority of this growth can
66
be attributed to biogenic aerosol precursor emissions from the forest, their atmospheric
67
oxidation and consequent condensation during the air mass transport17-20. These processes
68
produce new cloud condensation nuclei (CCN)15,21 and, via activation, these CCN form
69
cloud droplets that can have large radiative effects22,23. Boreal forests provide, therefore, an
70
ideal locale to investigate aerosol-cloud interactions in an evolving natural aerosol system
71
affected to only a minor extent by anthropogenic emissions24.
72 73
We conducted intensive observations with comprehensive in-situ and ground-based remote
74
sensing instrumentation during Biogenic Aerosols – Effects on Clouds and Climate,
75
BAECC25 campaign for over 8 months in 2014, which complemented the long-term aerosol
76
observations at Station for Measuring Ecosystem-Atmosphere Relations (SMEAR II)26 in
77
Hyytiälä, Finland (Fig. 1a). The in-situ aerosol and ground-based remote sensing
78
instruments are presented in Methods section. We calculated a parameter “time over land”
79
that is determined from back-trajectory analysis (See Methods section for details). This
80
parameter corresponds to the exposure time of an air mass to the boreal forest environment
81
prior to being measured at the site. We concentrated on air masses originating from the
82
north-west direction in order to minimize the influence of anthropogenic emissions24,37,
83
(see also the discussion in the Methods section). We calculated medians of in-situ data
84
measured within 1 hour of the air mass arrival time for every time over land value. After
85
classifying the chosen data as a function of time over land, we found that the aerosol
86
number size distribution evolves considerably during its residence time over the biosphere
87
(Figures 1b, 1c), consistent with earlier analyses17.
88 89
Time evolution of the in situ-measured aerosol population
90 91
The following synthesis for the time evolution of the in situ-measured aerosol population
92
emerges: between the 20 and 75 hours of air mass transport time over land, the aerosol
93
mass concentration increases by a factor of 3–4 (Table 1). This mass consists largely of
94
organic material (Fig. 2a), especially at longer transport time over land, and is dominated
95
by oxidized organic compounds indicative of secondary organic aerosol formation28-30, see
96
also Extended Data Fig 2).
97 98
The particle number size distribution is initially dominated by nucleation mode particles
99
(diameter <25 nm), and later by Aitken mode particles (25–100 nm) with a growing tail
100
into the accumulation mode (>100 nm, Figure 1b). The simultaneous increase of both mass
101
and mean size of the aerosol population makes it optically more active, which is reflected
102
by the increasing aerosol scattering and backscatter coefficients (Fig. 2b and 2c, Table 1),
103
both by a factor of about 5.5. The aerosol backscatter fraction decreases (Extended Data
104
Fig. 3) with increasing time over land because, compared with smaller particles, larger
105
particles scatter more efficiently into the forward direction. CCN concentrations (at water
106
vapor supersaturations of 0.1–0.5 %) increase by factors of 4.0 – 4.6 between 20 and 75
107
hours of air mass transport over land (Table 1, Fig. 3a). This increase is almost entirely due
108
to the increasing particle size in the sub-100 size range, as the critical diameter for CCN
109
activity at higher water vapor supersaturations changes little during the aerosol aging
110
(Extended Data Fig. 4).
111 112
Aerosol particles in the boundary layer
113 114
High Spectral Resolution lidar (HSRL31) data expands in situ optical measurements
115
vertically into the boundary layer (see Methods section). We found that the backscatter
116
coefficient averaged for a 60 m layer (two HSRL range gates) at 200 m and at 500 m above
117
ground level (a.g.l) increases by a factor of about 1.3 between the 20 and 75 hours of air
118
mass transport time over land (Fig. 2d). Although based on a smaller dataset than in situ
119
optical measurements, the increase of the backscatter coefficient aloft indicates that the
120
changes in the time evolution of the aerosol population observed at ground level reflect
121
those taking place throughout the lower boundary layer in air masses transported to our
122
measurement site.
123 124
To complete the analysis, we derived cloud droplet number concentrations (CDNC) using
125
ground-based remote sensing (see Methods section). We restricted our analysis to non-
126
precipitating, low-level liquid clouds (cloud bases below 2000 m) in order to minimize the
127
potential effect of rain and ice-forming processes on cloud microphysics, and because such
128
clouds are more likely to interact with boundary-layer aerosol particles than mid- or higher-
129
level clouds. For this cloud type, the median CDNC almost doubles between the 20 and 75
130
hours of air mass transport time over land (Figure 3b, Table 1). A similar increase can be
131
observed in the cloud liquid water path (LWP), plausibly as a result of increasing specific
132
humidity due to evapotranspiration from the forest biosphere during air mass transport to
133
the site (Extended Data Fig. 5). In general terms, the albedo of a cloud is closely tied with
134
its optical thickness, τ, which can be approximated to be proportional to LWP5/6×CDNC1/3
135
for adiabatic liquid clouds32,33. The enhancement in CDNC and LWP observed in our
136
dataset could lead to a corresponding factor of 2 increase in τ between the 20 and 75 hours
137
of air mass transport over land. To complement our ground-based observations, we derived
138
CCN concentrations from satellite data34. As an example, the result of a case during August
139
17, 2014 is presented in Figure 3c, see also Extended Data Fig 6). The spatial pattern of
140
CCN concentrations shows that the CCN concentrations are higher in-land than they are at
141
the coast line. This snapshot analysis is consistent with our ground-based in-situ and remote
142
sensing data. Overall, these observations are indicative of major changes in cloud radiative
143
properties when clean air is transported over a boreal forest and is subsequently modified
144
by interactions with the forest biosphere. The overall radiative effect from aerosol-cloud
145
interactions is likely to experience changes of similar magnitude, as we found no
146
systematic change in the cloud fraction as a function of time over land (Extended Data Fig.
147
7).
148 149
Besides the influence of aerosols on clouds discussed above, clouds can influence the aging
150
of an aerosol particle population as well. For example, non-precipitating cloud processing
151
and associated cloud water chemistry create a bimodal particle number size distribution
152
with a clear minimum slightly below 100 nm in remote marine air35,36. We observed signs
153
of non-precipitating cloud processing after about 30–40 hours of time over land, and the
154
resulting minimum in the particle number distribution was quite evident at longer air mass
155
transport times (Fig. 1c). Precipitation scavenging is usually thought as the main removal
156
mechanisms for atmospheric aerosol particles37, 38. In our data set, the probability and
157
intensity of rain show considerable variability with a tendency to increase with an
158
increasing time over land (Extended Data Fig. 7). The observed behavior of extensive
159
aerosol properties (Figs. 1–3), CDNC (Fig. 3b) and LWP (Extended Data Fig. 5) suggests
160
that secondary aerosol formation clearly dominates over aerosol losses by precipitation
161
scavenging for air mass transport times of at least 70–80 hours over land.
162 163 164
Implications for aerosol-cloud interactions
165 166
Interestingly, during the approximately 75h time period we are able to observe the whole
167
chain of processes starting from condensable vapor production associated with emissions
168
from the biosphere, continuing with atmospheric new particle formation and growth, and
169
eventually leading to additional CCN and cloud droplets, with simultaneous signs of cloud
170
processing, initiation of precipitation and precipitation scavenging of the aerosol
171
population. Considering a typical air mass movement velocity, and distance of the
172
observations to the coastline, the corresponding spatial scale for this chain of processes is
173
approximately 1 million km2. This is the required temporal and spatial scale to study
174
aerosol impacts on cloud properties and precipitation in the boreal environment.
175 176
Figure 4 summarizes schematically how a boreal forest environment influences aerosols
177
and clouds, and how the time evolution of both aerosol and cloud properties evolve
178
together when being affected by forest biosphere emissions. Considerable changes were
179
observed in both aerosol and cloud properties, as well as in signatures of aerosol-cloud
180
interactions, for up to 3 days of air mass transport over the forest. The highly dynamic
181
nature of this system has several important consequences that probably hold for many other
182
continental environments which emit aerosol precursor vapors or primary aerosol particles.
183
First, there is no static natural background state for continental aerosol particle populations,
184
nor for cloud microphysical properties, unless the environmental system under
185
consideration is large enough; in our case several hundreds of kilometers in length. Second,
186
even small changes in aerosol precursor emissions due to changing climatic conditions3, or
187
due to anthropogenic influences39,40, may substantially affect the radiative and precipitating
188
properties of clouds in moderately-polluted environments. Finally, while it is generally
189
accepted that the behavior of atmospheric cloud systems depends on a wide variety of
190
temporal and spatial scales2,41, our results imply that such a scale-dependency is also a
191
characteristic feature of aerosol-cloud interactions involving low clouds over moderately-
192
polluted regions affected by surface emissions. Our findings call for similar studies in other
193
continental environments, and pose challenges not only for studies of aerosol-cloud
194
interactions, but also when using atmospheric aerosol or cloud data for model evaluation
195
or when investigating feedback mechanisms between the atmosphere and biosphere.
196 197
Acknowledgments: The work was supported by Academy of Finland via Center of
198
Excellence in Atmospheric Sciences (project no. 272041), Flagship program for
199
Atmospheric and Climate Competence Center (ACCC, 337549, 337552, 337550) and
200
grants 317380, 320094 and 334792, 328290, 302958, 325656, 316114, 325647, 325681
201
and 341271, European Research Council Advanced Grants (227463-ATMNUCLE,
202
742206-ATM-GTP,) and Starting Grants (638703-COALA, 714621-GASPARCON), the
203
Arena for the gap analysis of the existing Arctic Science Co-Operations (AASCO)
204
funded by Prince Albert Foundation Contract No 2859, and “Quantifying carbon sink,
205
CarbonSink+ and their interaction with air quality” INAR project funded by Jane and
Aatos Erkko Foundation. This work was partly supported by the Office of Science
207
(BER), U.S. Department of Energy via BAECC (Petäjä, DE-SC0010711), BAECC-
208
SNEX (Moisseev), European Commission via projects This project has received funding
209
from the European Union’s Horizon 2020 research and innovation program under grant
210
agreement No. 821205 (Understanding and reducing the long-standing uncertainty in
211
anthropogenic aerosol radiative forcing, FORCeS) and ACTRIS, ACTRIS-TNA,
212
ACTRIS2, ACTRIS-IMP, BACCHUS, eLTER, ICOS, PEGASOS and Nordforsk via
213
Cryosphere-Atmosphere Interactions in a Changing Arctic Climate, CRAICC, The
214
BAECC SNEX was also supported by NASA Global Precipitation Measurement (GPM)
215
Mission ground validation program. The deployment of AMF2 to Hyytiälä was enabled
216
and supported by ARM. Argonne National Laboratory's work was supported by the U.S.
217
Department of Energy, Assistant Secretary for Environmental Management, Office of
218
Science and Technology, under contract DE-AC02-06CH11357. The ground-based data
219
used in this study were obtained from the Atmospheric Radiation Measurement (ARM)
220
user facility, managed by the Office of Biological and Environmental Research for the
221
U.S. Department of Energy Office of Science. We acknowledge ACTRIS for providing
222
the products derived from the ground-based data in this study, which were produced by
223
the Finnish Meteorological Institute, and are available for download from
224
https://cloudnet.fmi.fi/. The authors gratefully acknowledge the support of AMF2,
225
SMEAR2 and the BAECC community for their support in initiating the BAECC
226
campaign, its implementation, operation, data analysis and interpretation. The authors are
227
grateful for the four anonymous referees for their comments which improved the paper
228
considerably.
229
230 231
Competing interests:
232
The authorsdeclare no competing interests.
233 234
Corresponding Author: Tuukka Petäjä, [email protected]
235 236 237
Tables:
238 239
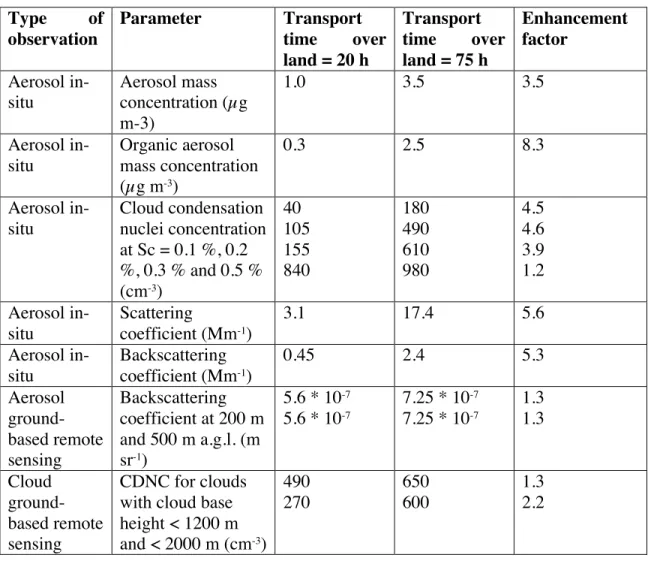
Table 1: Concentrations of aerosol total mass, organic aerosol mass and CCN, as well as
240
the scattering and backscatter coefficient at 20 and 75 hours of air mass transport time over
241
land, along with the enhancement factor between these two transport times. In case of the
242
cloud droplet number concentration (CDNC), the results were averaged over transport
243
times of 20–50 and 50–80 h over land.
244 245
Type of observation
Parameter Transport time over land = 20 h
Transport time over land = 75 h
Enhancement factor
Aerosol in- situ
Aerosol mass concentration (µg m-3)
1.0 3.5 3.5
Aerosol in- situ
Organic aerosol mass concentration (µg m-3)
0.3 2.5 8.3
Aerosol in- situ
Cloud condensation nuclei concentration at Sc = 0.1 %, 0.2
%, 0.3 % and 0.5 % (cm-3)
40 105 155 840
180 490 610 980
4.5 4.6 3.9 1.2 Aerosol in-
situ
Scattering
coefficient (Mm-1)
3.1 17.4 5.6
Aerosol in- situ
Backscattering coefficient (Mm-1)
0.45 2.4 5.3
Aerosol ground- based remote sensing
Backscattering coefficient at 200 m and 500 m a.g.l. (m sr-1)
5.6 * 10-7 5.6 * 10-7
7.25 * 10-7 7.25 * 10-7
1.3 1.3
Cloud ground- based remote sensing
CDNC for clouds with cloud base height < 1200 m and < 2000 m (cm-3)
490 270
650 600
1.3 2.2
246 247
Figures and Figure Captions:
248 249
250 251
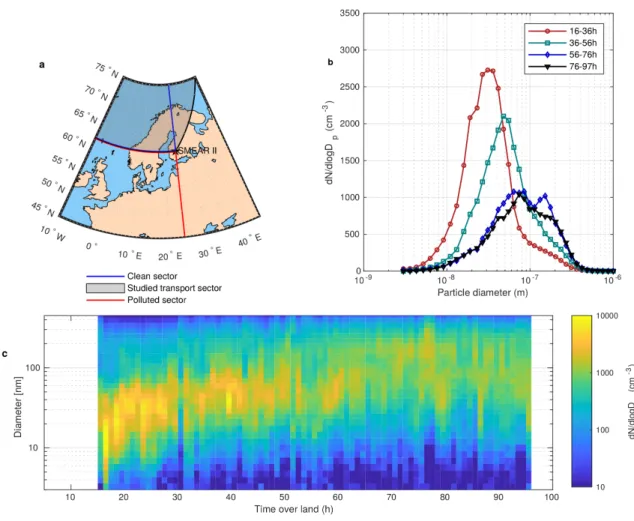
Fig. 1. Time evolution of the particle number size distribution. a. Location of the
252
SMEAR II station in Hyytiälä, Finland, and the three air mass transport sectors discussed
253
in this paper. Most of the analysis discussed in this paper is based on air masses residing
254
in the studied transport sector (STS, see Methods). b. Median particle number size
255
distributions for different time-over-land classes in STS. c. Evolution of the particle
256
number size distribution as a function of time over land for air masses in STS. Atmospheric
257
new particle formation (NPF) is frequent at short air mass transport times over the boreal
258
forest region (See Fig. Extended Data Fig. 1), leading to a pronounced mode of particles
259
in the sub-50 nm size range. Growth of pre-existing particles dominates over NPF at longer
260
transport times over land, increasing the mean size of the particle population. At the longest
261
transport times over land, the bimodality of the particle population and the pronounced
262
Hoppel-minimum32 between the Aitken and accumulation mode indicate non-precipitating
263
cloud processing.
264 265 266
Fig. 2
267
Time evolution of the particle mass concentration and optical properties. a. Total
268
aerosol mass concentration below below 450 nm estimated from the measured DMPS
269
volume size distribution assuming an aerosol density of 1.5 g cm-3, and organic mass
270
concentration measured with aerosol mass spectrometry. b. In-situ measured scattering
271
coefficient. c. In-situ measured backscattering coefficient. d. Backscattering coefficient
272
retrieved with the HSRL lidar at 200 m and 500 m above ground level. The increase in
273
backscatter coefficient aloft is consistent with the in-situ data. Shaded areas in the panels
274
represent 25th to 75th percentile ranges. Solid lines show weighted least-squares fit to the
275
data up to 75 h time over land. Regression equations, correlation coefficients and p-values
276
are shown in legends. In summary, results are consistent with the assumption that the
277
residence time over land affects the aerosol population throughout the lower boundary
278
layer.
279 280
281
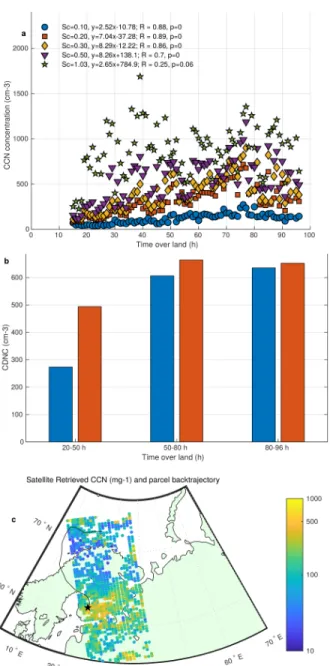
Fig. 3 Cloud-related variables. a. CCN number concentration at different water vapor
282
supersaturations (Sc) as a function of time over land. The legend shows the regression
283
equations of weighted least-squares fit to the data up to 75 h time over land, correlation
284
coefficients and p-values. b. Median retrieved cloud droplet number concentration
285
(CDNC) in liquid single-layer, non-precipitating clouds. The data were binned according
286
to the time that an air parcel spent over land: 20–50, 50–80 and 80–96 hours. The two
287
colors differentiate between the cases with the cloud base located below 2000 m and 1200
288
m. c. A map of CCN concentrations determined from satellite for an exemplary case study
289
on August 17, 2014 when the air masses arrive at Hyytiälä from the Arctic Ocean. The
290
satellite-derived CCN concentrations show a substantial increase from the coast-line to in-
291
land.
292
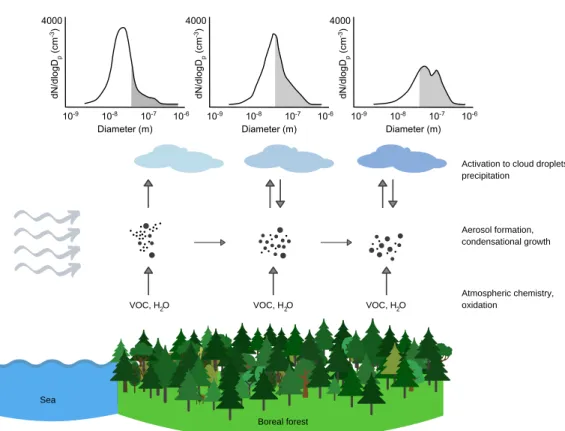
293 Fig. 4 Schematic representation of processes affecting aerosols and clouds during an
294
air mass transport over boreal forests. When initially clear air enters the boreal forest
295
environment (left part of the figure), it begins accumulating aerosol precursors together
296
with water vapor from the forest biosphere. This leads to cloud formation, probably
297
relatively soon after the air mass enters the forest environment45. At longer air mass
298
transport times over the forest (right part of the figure), the accumulating water vapor
299
makes the existing clouds optically thicker, and thereby more reflective to incoming solar
300
radiation; eventually leading to precipitation. Atmospheric oxidation of biogenic aerosol
301
precursors vapors initiates a sequence of processes starting from NPF and secondary
302
aerosol formation and ending with increased CCN and cloud droplet number
303
concentrations. This further enhances cloud reflectivity at longer air mass transport times
304
over the forest, while at the same time delaying the onset of precipitation expected from
305
accumulating water vapor.
306 307
Sea
B ea f e VOC, H O2
A e c c e ,
da
Ae f a ,
c de a a g Ac a c d d e ,
ec a
VOC, H O2 VOC, H O2
References:
308 309
1 Boucher, O. et al. Clouds and Aerosols in: Climate Change 2013: The Physical Science
310
Basis. Contribution of Working Group I to the Fifth Assessment Report of the
311
Intergovernmental Panel on Climate Change, T. Stocker, et al. (Eds), Cambridge
312
University Press. (2013).
313 314
2 Rosenfeld, D. et al. Global observations of aerosol-cloud-precipitation-climate
315
interactions. Rev. Geophys. 52, 750-808 (2014).
316 317
3 Twohy, C.H. et al. Impacts of aerosol particles on the microphysical and radiative
318
properties of stratocumulus clouds over the southeast Pacific Ocean. Atmos. Chem. Phys.
319
13, 2541-2562 (2013).
320 321
4 Goren, T. & Rosenfeld, D. Extensive closed cell marine stratocumulus downwind of
322
Europe – A large aerosol cloud mediated radiative effect or forcing? J. Geophys. Res.
323
Atmos. 120, 6098-6116 (2015).
324 325
5 Liu, Y. et al. Analysis of aerosol effects on warm clouds over the Yangtze River Delta
326
from multi-sensor satellite observations. Atmos. Chem. Phys. 17, 5623-5641 (2017).
327 328
6 Malavelle, F.F. et al. Strong constraints on aerosol-cloud interactions from volcanic
329
eruptions. Nature 546, 485-491 (2017).
330 331
7 Lu, Z. et al. Biomass smoke from southern Africa can significantly enhance the brightness
332
of stratocumulus over the southeastern Atlantic Ocean. Proc. Natl. Acad. Sci. 115, 2924-
333
2929 (2018).
334 335
8 Ross, A.D. et al. Exploring the first aerosol indirect effect over Southeast Asia using a 10-
336
year collocated MODIS, CALIOP, and model dataset. Atmos. Chem. Phys. 18, 12747-
337
12764 (2018).
338 339
9Gryspeerdt, E. et al. Constraining the aerosol influence on cloud liquid water path. Atmos.
340
Chem. Phys., 19, 5331-5347 (2019).
341 342
10 Mülmentstädt, J. et al. Reducing the aerosol forcing uncertainty using observational
343
constraints on warm rain processes. Sci. Adv., 6, eaaz6733 (2020).
344 345
11 Bellouin, N. et al. Bounding global aerosol radiative forcing of climate change. Rev.
346
Geophys., 58, doi.org/10.1029/2019RG000660 (2020).
347 348
12 Carslaw, K.S. et al. Large contribution of natural aerosols to uncertainty in indirect
349
forcing. Nature 503, 67-71 (2013).
350 351
13 Bonan, G.P. Forests and climate change: forcings, feedbacks, and the climate benefits of
352
forests. Science 320, 1444-1449 (2008).
353 354
14 Kulmala, M. et al. Direct observations of atmospheric nucleation. Science 339, 943-946
355
(2013).
356 357
15 Paasonen, P. et al. Warming-induced increase in aerosol number concentration likely to
358
moderate climate change. Nature Geosci. 6, 438-442 (2013).
359 360
16 Kerminen, V.-M. et al. Atmospheric new particle formation and growth: review of field
361
observations. Environ. Res. Lett. 13, 103003 (2018).
362 363
17 Tunved, P. et al. High natural aerosol loading over boreal forests. Science 312, 261–263
364
(2006).
365 366
18 Riipinen, I. et al. The contribution of organics to atmospheric nanoparticle growth.
367
Nature Geosci. 5, 453-458 (2012).
368 369
19 Ehn, M. et al. A large source of low-volatility secondary organic aerosol. Nature 506,
370
476–479 (2014).
371 372
20 Tröstl, J. et al. The role of low-volatility organic compounds in initial particle growth in
373
the atmosphere. Nature 533, 527-533 (2016).
374 375
21 Pierce, J.R., Westerveld, D.M., Atwood, S.A., Barne, E.A., & Leaitch, W.R. New-
376
particle formation, growth and climate-relevant particle production in Egbert, Canada:
377
analysis of 1 year of size-distribution observations. Atmos. Chem. Phys. 14, 8647-8663
378
(2014).
379 380
22 Spracklen, D.V., Bonn, B. & Carslaw, K.S. Boreal forests, aerosol and the impacts on
381
clouds and climate. Phil. Trans. R. Soc. A., doi:10.1098/rsta.2008.0201 (2008).
382 383
23 Scott, C.E. et al. The direct and indirect radiative effects of biogenic secondary organic
384
aerosol. Atmos. Chem. Phys. 14, 447-470 (2014).
385 386
24 Riuttanen, L., Hulkkonen, M., Dal Maso, M., Junninen, H. & Kulmala, M. Trajectory
387
analysis of atmospheric transport of fine particles, SO2, NOx and O3 to the SMEAR II
388
station in Finland in 1996–2008. Atmos. Chem. Phys. 13, 2153-2164 (2013).
389 390
25 Petäjä, T. et al. BAECC, A field campaign to elucidate the impact of Biogenic Aerosols
391
on Clouds and Climate. Bull. Am. Met. Soc. 97, 1909-1928 (2016).
392 393
26 Hari, P. & Kulmala, M. Station for Measuring Ecosystem – Atmosphere Relations
394
396
27 Petäjä, T. et al. Effects of SO2 oxidation on ambient aerosol growth in water and ethanol
397
vapours. Atmos. Chem. Phys. 5, 767-779 (2005).
398 399
28 Aiken, A.C. et al. O/C and OM/OC ratios of primary, secondary, and ambient organic
400
aerosols with high-resolution time-of-flight aerosol mass spectrometry. Environ. Sci.
401
Technol., 42, 4478-4485 (2008).
402 403
29 Yatavelli, R.L.N et al. Estimating the contribution of organic acids to northern
404
hemispheric continental organic aerosol. Geophys. Res. Lett., 6084-6090, doi:
405
10.1002/2015GL064650 (2015).
406 407
30 Äijälä, M. et al. Constructing a data-driven receptor model for organic and inorganic
408
aerosol: a synthesis analysis of eight mass spectrometric data sets from a boreal forest site.
409
Atmos. Chem. Phys. 19, 3645-3672 (2019).
410 411
31 Eloranta, E.W. High Spectral Resolution Lidar in Lidar: Range-Resolved Optical
412
Remote Sensing of the Atmosphere, Springer Series in Optical Sciences (Springer-Verlag,
413
New York, 2005).
414 415
32 Brenquier, J.L., Pawlowska, H. & Schüller, L. Cloud microphysical and radiative
416
properties for parameterization and satellite monitoring of the indirect effect of aerosol on
417
climate. J. Geophys. Res. 108, 8632, doi:10.1029/2002JD002682 (2003).
418 419
33 Gettelman, A. Putting the clouds back in aerosol-cloud interactions. Atmos. Chem. Phys.
420
15, 12397-12411 (2015).
421 422
34 Rosenfeld, D. et al. Satellite retrieval of cloud condensation nuclei concentrations by
423
using clouds as CCN chambers. Proc. Nat. Acad. Sci. 113, 5828-5834 (2016).
424 425
35 Hoppel, W.A., Frick, G.M. & Larson, R.E. Effect of nonprecipitating clouds on the
426
aerosol size distribution. Geophys. Res. Lett. 13, 125-128 (1986).
427 428
36 Covert, D.S., Kapustin, V.N., Bates, T.S. & Quinn, P.K. Physical properties of marine
429
boundary layer aerosol particles of the mid-Pacific in relation to sources and
430
meteorological transport. J. Geophys. Res. 101, 6919-6930 (1996).
431 432
37 Andronache, C. Estimated variability of below-cloud removal by rainfall for observed
433
aerosol size distributions. Atmos. Chem. Phys. 3, 131-143 (2003).
434 435
38 Pryor, S.C., Joerger, J.M. & Sullivan, R.C. Empirical estimates of size-resolved
436
precipitation scavenging coefficients for ultrafine particles. Atmos. Environ. 143, 133-138
437
(2016).
438 439
39 Bollasina, M.A., Ming, Y. & Ramaswamy, V. Anthropogenic aerosols and the
440
weakening of the South Asian summer monsoon. Science 334, 502-505 (2011).
441 442
40 Coopman, Q., Garrett, T.J., Finch, D.P. & Riedi, J. High sensitivity of Arctic liquid
443
clouds to long-range anthropogenic aerosol transport. Geophys. Res. Lett. 45, 372–381
444
(2018).
445 446
41 Brient, F. & Bony, S. Interpretation of the positive cloud feedback predicted by a climate
447
model under global warming. Clim. Dyn. 40, 2415-2431 (2013).
448 449
42 Teuling, A.J. et al. Observational evidence for cloud cover enhancement over western
450
European forests. Nature Comm. 8, 14065 (2017).
451 452
Methods
453
SMEAR II station. The Station for Measuring Ecosystem – Atmosphere Relations
454
(SMEAR II28) station at Hyytiälä (61°51’N, 24°17’E, 180 m above sea level) has extensive
455
facilities for measuring forest-atmosphere relations and has been active since 1996. This
456
site is the flagship of the SMEAR network providing, for example, the longest continuous
457
time series of sub-micron aerosol number size distribution measurements. The main
458
research fields are: analysis of gas and particle concentrations and fluxes and their role in
459
aerosol and cloud formation; analysis of water, carbon and nutrient budgets of the forested
460
catchment, and analysis of environment and tree structure on gas exchange, water transport
461
and growth of trees.
462
http://www.atm.helsinki.fi/SMEAR/index.php/smear-ii
463
BAECC campaign. Biogenic Aerosols – Effect on Clouds and Climate (BAECC) was an
464
intensive 8-month campaign in Hyytiälä, Finland, where the U.S. Department of Energy
465
(DOE)’s Atmospheric Radiation Measurement (ARM) Program deployed their Second
466
ARM Mobile Facility (AMF2). The AMF2 was operational from February to September
467
2014. The AMF2 included in-situ aerosol instruments as well as a suite of ground-based
468
remote sensing instruments. The campaign aims43 and the observational capacity and initial
469
results25 are presented elsewhere.
470
In-situ instrumentation
471
DMPS. The aerosol number size distribution was measured with Differential Mobility
472
Particle Sizer (DMPS) for the size range from 3 nm to 1000 nm in electrical equivalent
473
diameter. The DMPS is a twin-DMPS system44 with a closed loop flow arrangement45. The
474
time resolution for a full particle size distribution scan is 10 min. The instrument was
475
operated following guidelines46 from the Aerosols, Trace Gases, and Clouds Research
476
Infrastructure (ACTRIS). The sample was drawn from 8 m height inside the canopy.
477
Nephelometer. The measurements of aerosol scattering and backscattering at the ground
478
level were conducted at three wavelengths using an integrating nephelometer (TSI model
479
3563). The sample air is taken through a PM10 inlet (Digitel low volume inlet,
480
DPM10/01/00/16) and alternating either directly to the instruments or via a PM1 impactor
481
(Dekati PM impactor with a PM1 cut-off). The Nephelometer data was truncation corrected
482
in accordance with the size cut of the impactor.47
483
Cloud Condensation Nuclei Counter (CCNC). The concentration of aerosol particles
484
that activate in different supersaturations (Sc = 0.1 %, 0.2 %, 0.3 %, 0.5 % and 1.03%)
485
with respect to water vapor was determined with Droplet Measurement Technologies Inc.
486
Cloud Condensation Nuclei Counter48. The instrument sampled from the same inlet as the
487
DMPS that extracted the sample from 8 m height inside the canopy.
488
Aerosol Chemical Speciation Monitor (ACSM). Submicron aerosol chemical
489
composition was analyzed using the Aerosol Chemical Speciation Monitor49. In the ACSM,
490
all non-refractory aerosol is vaporized and subsequently ionized using hard 70eV electron
491
ionization (EI). A mass spectrum of the ions is then measured with a quadrupole mass
492
analyzer. Organic aerosol sub-species (semi-volatile and low volatile organic aerosol
493
classes; SV-OOA and LV-OOA) were de-convolved from the data using Positive Matrix
494
Factorization50 (PMF).
495
High Spectral Resolution Lidar (HSRL). Vertical profiles of optical depth, backscatter
496
cross-section, depolarization and backscattering coefficients were determined with
497
HSRL51. As an internal calibration, molecular scattering was used as a refence at each point
498
of the lidar profile. More details can be found from31. The instrument was operated as part
499
of AMF2 facility52.
500
Radiosoundings. Meteorological radiosonde soundings53 were performed 4 times per day
501
during the campaign. Relative humidity, air temperature and pressure readings from
502
radiosondes were used to calculate specific humidity at the levels of 200, 500 and 1000 m
503
above ground level. Additionally, specific humidity near the surface (4 m above ground)
504
was estimated from near-surface measurements.
505
Weather Sensor. Vaisala FD12P weather sensor located at 18 m height provided data on
506
precipitation amount. The AMF2 provided additional supporting in-situ weather
507
parameters54.
508
Cloud observations
509
CEILOMETER. Vaisala CL31 was used to derive cloud base height55.
510
MWACR. W-Band vertically pointing Doppler cloud radar operating at 95.04 GHz
511
provided data on reflectivity that was used in the cloud properties retrieval scheme56.
512
Microwave radiometer. Column-integrated liquid water path content was measured with
513
a microwave radiometer (MWR57). MWR operates at two frequencies: 23.8 and 31.4 GHz.
514
Integrated liquid water path is derived from radiance measurements with a statistical
515
retrieval algorithm that uses monthly derived and location-dependent linear regression
516
coefficients. MWR provides data in cm that is converted to g m-2.
517
Cloudnet. The Cloudnet target classification product58 that provides information on cloud
518
and hydrometeor types as well as cloud boundaries was used to select cases for CDNC
519
retrieval. The cloud fraction product was also used in the analysis59.
520 521
Satellite retrieval of Cloud Condensation Nuclei. The satellite retrieval of CCN is based
522
on the methodology of Rosenfeld et al34. More specifically, the satellite-retrieved adiabatic
523
cloud drop concentrations (Nd) and cloud base updraft (Wb). The peak water vapor super
524
saturation (S) near cloud base is calculated based on Nd and Wb. Nd is then by definition
525
the CCN(S). The retrieval of CCN and S are mapped by an automatic procedure60 for
526
running windows of 36 x 36 km.
527
Data analysis and processing
528
Data coverage
529
The SMEAR II station was operational during the whole BAECC campaign while the
530
September 13, 2014. To harmonize the data used in the analysis, we compiled a specific
532
campaign data set used in the analysis described in Extended Data Table 1.
533
Origin of measured air masses and selection of air mass transport sectors
534
For all of the data measured at the SMEAR II station, a 27-member ensemble of 96-h
535
backtrajectories arriving hourly at 100 m a.g.l. was computed with the HYSPLIT model61.
536
With the model, we used meteorological data files NCEP/GDAS with horizontal resolution
537
1°.62 Ensemble mean trajectories were calculated. Ensemble mean trajectories that spent at
538
least 90% of their time in the selected sector qualified to be further used in time-over-land
539
analysis. The 90% criterion is aimed to minimize effect of adjacent sectors on passing air
540
masses.
541
Three air mass transport sectors were considered in this work (see Fig. 1a in the main text),
542
termed clean, studied and polluted transport sector. The clean sector is the same as that was
543
used originally by Tunved et al.17, representing air masses with minimal anthropogenic
544
influence during the March-September period each year. In order to increase the number
545
of data points related to cloud measurements, we extended the clean sector slightly to the
546
east (See Figure 1a in the main text). The risk associated with this procedure is the potential
547
contamination of measured air by anthropogenic activities in the Kola Peninsula area,
548
known to influence atmospheric new particle formation and growth downwind from this
549
area63. We found little difference between the clean and studied sector in terms of how the
550
aerosol mass concentration or sub-100 nm particle size distribution evolves as a function
551
of time over land (Figs. 1b, 2a, Extended Data Fig 8 and 9), which justifies the use of this
552
extended transport sector in our analyses. Contrary to these two air mass transport sectors,
553
measured aerosol properties are very different in the polluted sector (Extended Data Figs.
554
8-10).
555
Overall, between February 1 to September 31, 2014, there are 224 days with a total of 5376
556
ensemble trajectories. Out of this, there were 1342 trajectories that fulfilled the selection
557
criteria for studied sector, 646 for the clean sector and 823 for the polluted sector. In
558
percent, the coverage is therefore 24.9%,12.0% and 15.3%, for the studied, clean and
559
polluted sectors, respectively.
560
The concept “time over land”
561
For each air mass back trajectory ensemble mean, we determined the time that this air had
562
spent over a land area prior to its arrival at the SMEAR II station.
563
In the case of the studied (and clean) transport sector, the “time over land” has a very simple
564
interpretation: it is the time that air originating from either Atlantic or Arctic Ocean spends
565
over a boreal forest region before arriving at the measurement site SMEAR II. By plotting
566
any measured quantity as a function of time over land, we show how this quantity, having
567
initially a value typical for relatively clean marine air, is expected to evolve in time when
568
being exposed to various sink and source processes associated with an atmospheric
569
boundary layer over boreal forest.
570
In the case of the polluted sector, the situation is more complicated: the measured quantity
571
does not necessarily correspond to originally clean marine air, in addition to which it may
572
have been affected by anthropogenic emissions before being measured at SMEAR II.
573
Selection of cloud cases and Cloud Droplet Number Concentration (CDNC)
574
retrieval
575
The Cloudnet target classification product was used to select suitable data for the study of
576
cloud profiles. The Cloudnet target classification algorithm59 utilizes cloud radar, lidar and
577
microwave radiometer measurements to identify the presence and type of hydrometeors in
578
the atmosphere. Warm non-precipitating clouds with cloud bases lower than 2000 m were
579
selected for the analysis. A threshold of 2000 m was selected as a proxy for the mixing
580
layer height to limit the number of cases where the cloud layer is decoupled from the
581
surface. If drizzle / rain, the melting layer or ice crystals were present in the cloud profile,
582
it was discarded from consideration. Multilayer cloud profiles were discarded from the
583
analysis as well, however profiles containing ice clouds present aloft were retained if the
584
distance between the warm cloud and the ice cloud was at least 1 km.
585
To derive cloud droplet number concentration (CDNC) the Frisch et al.64 method was
586
used. The method assumes the cloud droplet size distribution can be approximated by a
587
gamma distribution with the fixed shape parameter65. It is also assumed that the CDNC is
588
constant with height, which is one reason why our case selection was limited to non-
589
precipitating, non-drizzling clouds. The retrieval uses measurements of LWP by MWR
590
and radar reflectivity factor as given by MWACR. One of the major sources of
591
uncertainties is the instrument calibration. The radar was cross calibrated against other
592
radars operating on the site66. It should also be noted that the radar calibration during
593
BAECC was rather stable67. The LWP observations follow ARM standard practices.
594 595
Data availability.
596 597
Measurement data for the analysis and figures in this study are archived on the Zenodo
598
repository (doi:10.5281/zenodo.5645340). Source data is provided with this paper.
599 600
The SMEAR II data is available through avaa-portal (smear.avaa.csc.fi).
601 602
The ground-based data used in this article are generated by the Atmospheric Radiation
603
Measurement (ARM) user facility and are made available from the ARM Data Discovery
604
website (https://adc.arm.gov/discovery/) as follows:
605 606
ceilometer data (CEIL) from https://doi.org/10.5439/1181954,
607
dual-channel microwave radiometer (MWR) from https://doi.org/10.5439/1046211,
608
high spectral resolution lidar (HSRL) from https://doi.org/10.5439/1025200,
609
optical rain gauge (MET) from https://doi.org/10.5439/1786358,
610
W-band cloud radar (MWACR) from https://doi.org/10.5439/1150242.
611
The products derived from the ground-based remote-sensing data used in this article
613
(target classification, cloud fraction, liquid water content) are generated by the European
614
Research Infrastructure for the observation of Aerosol, Clouds and Trace Gases
615
(ACTRIS) and are available from the ACTRIS Data Centre using the following link:
616
https://hdl.handle.net/21.12132/2.c85c6a6c2bc348f8.
617 618
Code availability.
619 620
The codes for time over land calculations are available from the authors upon request.
621
The CCN retrieval package can be obtained upon request from the first author of the
622
following paper: Yue, Z., Rosenfeld, D., Liu, G., Dai, J., Yu, X., Zhu, Y., Hashimshoni,
623
E., Xu, X., Hui, Y. and Lauer, O. (2019). Automated Mapping of Convective Clouds
624
(AMCC) Thermodynamical, Microphysical and CCN Properties from SNPP/VIIRS
625
Satellite Data. J. Appl. Met. Clim.https://doi.org/10.1175/JAMC-D-18-0144.
626 627
Methods references
628 629
43 Petäjä, T. Science Plan: Biogenic Aerosols – Effects on Clouds and Climate (BAECC).
630
US Department of Energy, Office of Science, DOE/SC-ARM-13-024 (2013).
631 632
44 Aalto, P. et al. Physical characterization of aerosol particles during nucleation events.
633
Tellus B, 53, 344-358 (2001).
634 635
45 Jokinen, V. & Mäkelä, J.M. Closed loop arrangement with critical orifice for DMA
636
sheath/excess flow system. J. Aerosol Sci. 28, 643-648 (1997).
637 638
46 Wiedensohler, A. et al. Mobility particle size spectrometers: harmonization of technical
639
standards and data structure to facilitate high quality long-term observations of
640
atmospheric particle number size distributions. Atmos. Meas. Tech. 5, 657–685 (2012).
641 642
47 Anderson, T.L. & Ogren, J.A. Determining aerosol radiative properties using the TSI
643
3563 integrating nephelometer. Aerosol Sci. Technol. 29, 57-69 (1998).
644 645
48 Paramonov, M. et al. A synthesis of cloud condensation nuclei counter (CCNC)
646
measurements within the EUCAARI network. Atmos. Chem. Phys. 15, 11999-12009
647
(2015).
648 649
49 Ng, N.L. et al. An Aerosol Chemical Speciation Monitor (ACSM) for routine
650
monitoring of the composition and mass concentrations of ambient aerosol. Aerosol Sci.
651
Technol. 45, 780–794 (2011).
652 653
50 Paatero, P. & Tapper, U. Positive matrix factorization: A non-negative factor model
654
with optimal utilization of error estimates of data values. Environmetrics, 5, 111-126
655
(1994).
656 657
51 Bambha, R., Eloranta, E., Garcia, J., Michelsen, H., Goldsmith, J., & Ermold, B. High
658
Spectral Resolution Lidar (HSRL), 2014-02-01 to 2014-09-12, from the ARM Mobile
659
Facility (AMF2, TMP) at the U. of Helsinki Research Station (SMEAR II), Hyytiala,
660
Finland, https://doi.org/10.5439/1025200 (ARM, accessed 2014-10-13).
661 662
52 Goldsmith, J. High Spectral Resolution Lidar (HSRL) instrument handbook. US
663
Department of Energy, Office of Science, DOE/SC-ARM-TR-157 (2016).
664 665
53 Atmospheric Radiation Measurement (ARM) user facility. 2014, updated hourly.
666
Balloon-Borne Sounding System (SONDEWNPN). 2014-02-02 to 2014-09-12, ARM
667
Mobile Facility (TMP) U. of Helsinki Research Station (SMEAR II), Hyytiala, Finland;
668
AMF2 (M1). Compiled by D. Holdridge, J. Kyrouac and R. Coulter. ARM Data Center.
669
Data set accessed May 2015 at http://dx.doi.org/10.5439/1021460.
670 671
54 Kyrouac, J., & Shi, Y. Surface Meteorological Instrumentation (MET), 2014-02-01 to
672
2014-09-13, from the ARM Mobile Facility (AMF2, TMP) at the U. of Helsinki
673
Research Station (SMEAR II), Hyytiala, Finland, https://doi.org/10.5439/1786358,
674
(ARM, accessed 2014-10-13).
675 676
55Morris, V., Zhang, D., & Ermold, B. Ceilometer data (CEIL), 2014-02-01 to 2014-09-
677
13, from the ARM Mobile Facility (AMF2, TMP) at the U. of Helsinki Research Station
678
(SMEAR II), Hyytiala, Finland, https://doi.org/10.5439/1181954 (ARM, accessed 2014-
679
10-13).
680 681
56 Lindenmaier, I., Bharadwaj, N., Johnson, K., Isom, B., Hardin, J., Matthews, A.,
682
Wendler, T., & Castro, V. Marine W-Band (95 GHz) ARM Cloud Radar (MWACR),
683
2014-02-01 to 2014-09-13, from the ARM Mobile Facility (AMF2, TMP) at the U. of
684
Helsinki Research Station (SMEAR II), Hyytiala, Finland,
685
https://doi.org/10.5439/1150242 (ARM, accessed 2014-10-13).
686 687
57 Cadeddu, M. Microwave Radiometer (MWRLOS), 2014-02-01 to 2014-09-13, from
688
the ARM Mobile Facility (AMF2, TMP) at the U. of Helsinki Research Station (SMEAR
689
II), Hyytiala, Finland, https://dx.doi.org/10.5439/1046211 (ARM, accessed 2014-10-13).
690 691
58 Cloud profiling products: Classification, Liquid water content, Categorize; 2014-02-02
692
to 2014-09-09; from Hyytiälä. Generated by the cloud profiling unit of the ACTRIS Data
693
Centre, https://hdl.handle.net/21.12132/2.c85c6a6c2bc348f8 (ACTRIS, accessed 2017-
694
09-01.
695 696