The amount of information is increasing rapidly, while the devices with which the information is accessed are decreasing in size. This thesis introduces a variety of information visualization techniques as solutions to the presentation problem, as well as devices in which the techniques can be used. Furthermore, an evaluation framework is presented, which can be used to evaluate the suitability of information visualization techniques for use in the devices in question.
This shows that only a third of the proposed solutions are suitable for use as such on low-end display devices, such as mobile phones.
INTRODUCTION
A context is then established for evaluating the solutions by introducing the concept of small screens and actual devices with small screens. Finally, the suitability of solutions for use on small screen devices is analyzed and evaluated with the proposed framework. This will result in a relative ranking of the proposed solutions based on the type of device in question.
Finally, the presentation problem, its solutions and the suitability of the solutions will be discussed, together with the issues that emerged during the evaluation.
INFORMATION VISUALIZATION
D EFINITIONS
R EFERENCE MODEL FOR VISUALIZATION
- Data transformations
- Visual mappings
- View transformations
- Human interaction
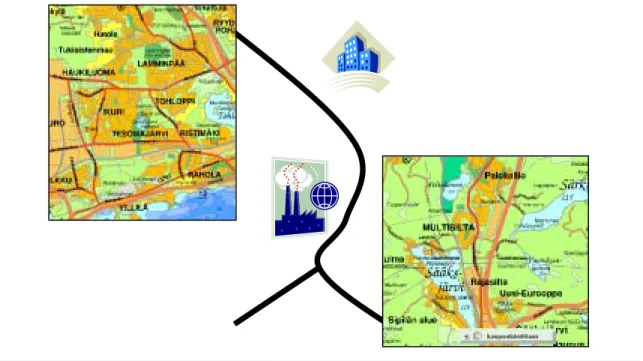
The focus area is used to show the basic details of the visual structure in an undistorted view, while the context area has the details distorted to save space. One example of the non-graphical fisheye view technique is the Power Browser by Buyukkokten et al. In the data transformation phase, the user can control which parts of the raw data are included in the visualization.
In the visual mapping stage, the user chooses, for example, the mapping between the axes of the visual structure and the variables in the data table.
![Table 1. A depiction of a data table. After Card et al. [1999, p. 18].](https://thumb-eu.123doks.com/thumbv2/9pdfco/1890664.266830/9.892.151.765.222.389/table-depiction-data-table-card-et-al-p.webp)
THE PRESENTATION PROBLEM
A PPROACHES FOR SOLVING THE PRESENTATION PROBLEM
- Focus + context techniques
- Suppression techniques
- Magic lenses
- Riffling techniques
- Zoom and pan techniques
The Bifocal Display by Spence and Apperley [1977] is one of the first focus + context techniques. Only centered items are readable by the user, but the user may still be aware of off-center items. An extension of the Bifocal Screen principle, the Perspective Wall, was developed by Mackinlay et al.
For example, in the simplest case, the perceived value could be calculated as a factor of the object's distance from the current viewpoint.
![Figure 7. Comparison of step vs. continuous magnification functions [Leung and Apperley, 1994]](https://thumb-eu.123doks.com/thumbv2/9pdfco/1890664.266830/18.892.127.769.470.752/figure-comparison-step-continuous-magnification-functions-leung-apperley.webp)
S UMMARY
SMALL DISPLAY DEVICES
D EFINITIONS
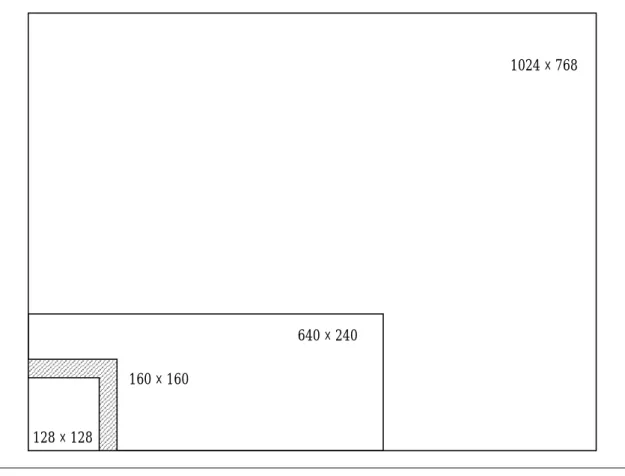
However, when determining the effective size of a screen, the aspect ratio of the screen should also be taken into account along with the resolution. The resolution of the screen measures how many individual pieces of information the screen can present, while the aspect ratio indicates the shape of the screen. Studies in the entertainment industry have shown that a screen with an aspect ratio of 16:9 is most attractive to users based on the characteristics of human vision.
This would suggest that the aspect ratio of the screen can be used to determine the effective screen size assuming that a screen with an aspect ratio of 16:9 is optimal when compared to other screens that have the same resolution. A screen with a resolution of 75 × 133 pixels is much more useful for visualizing a street map than a screen with a resolution of 10 × 1000 pixels, although both screens have the same amount of pixels. Of course, the situation is not so simple, since the type of data that is visualized also has a profound impact on the optimal form of the display.
In addition, there are other factors that contribute to the actual size of the display, such as the amount of colors that the display element is capable of reproducing. However, since formal methods for unambiguously determining size have not yet been introduced, screen resolution has been used to establish a boundary between small, medium, and large screens. In this study, eleven types of screens of different sizes from existing devices were used to calculate the data presented in Table 2.
Based on these figures, it can be concluded that a device belongs to the category of small screens if it has a resolution of approximately 150,000 pixels. Devices with resolutions below 10,000 pixels are in a "low-end" category, while devices with more than 10,000 pixels are in a "high-end" category.
D EVICES
- Nokia 6310i
- Palm TM m515
The phone's connectivity features include, for example, GPRS (General Packet Radio Service12) and BluetoothTM13 technologies. This means that custom visualizations can be implemented for the phone using the Mobile Information Device Profile (MIDP)15 application programming interface and the Connected Limited Device Configuration (CLDC)16 implementation of the JavaTM programming language. It has a 160 x 160 pixel screen that supports more than 65,000 colors and is operated with a stylus in addition to five application keys.
The PalmTM operating system (Palm OS) provides its own application programming interface for developers to produce applications for PalmTM devices. A number of development environments are also available for creating Palm OS applications in a variety of languages such as C, C++, Visual BASIC or Java.

EVALUATION FRAMEWORK
- O VERVIEW
- V ISUAL CONSTRAINTS
- Graphical properties
- Resolution
- I NTERACTION CONSTRAINTS
- Interactions with data transformations
- Interactions with visual mappings
- Interactions with view transformations
- I MPLEMENTATION CONSTRAINTS
- S UMMARY
On the one hand, the type of screen (colour, greyscale or monochrome) determines which of the above graphic properties can be reproduced on the screen; on the other hand, visualization techniques make use of these same graphical properties to encode information. An overview of the relative effectiveness of the different graphic properties is given by Card et al. It includes only those variables whose use is dependent on the capabilities of the display elements found in typical handheld devices.
One of the most important stages in the information visualization process is human interaction – the user's ability to explore data interactively by rearranging it in different ways. The degree to which these interaction requirements and available methods overlap is used to determine the relative suitability of the technique for the device with respect to interaction constraints. Direct manipulation in the context of information visualization (as opposed to direct manipulation in graphical user interfaces in general) allows for changing the parameters of the data transformation itself, for example via a user interface component embedded in the visualization.
It allows the user to quickly manipulate the mapping of data to rows and columns in the spreadsheet. Camera movement is used to move the position of the viewpoint through which the visualization is viewed. In addition, the application programming interface (API) of the device operating system governs how visualizations can be developed on the device.
For example, the API may restrict access to certain parts of the operating system or the physical features of the device. The type of the device in question determines what resources, such as display type or interaction methods, the device can offer for the visualization techniques.

EVALUATION OF VISUALIZATION TECHNIQUES
L OW - END DISPLAY DEVICES : N OKIA 6310 I
- Focus + context techniques
- Suppression techniques
- Magic lenses
- Riffling techniques
- Zoom and pan techniques
- Summary
Due to the low resolution and limitations of the display hardware, the use of a single focus technique such as Bifocal Display would be more advisable. A summary of the evaluation of focus + context techniques on a low-end display device is presented in Table 7. An overview of the evaluation of suppression techniques on a low-end display device is presented in Table 8.
A summary of the evaluation of magic lenses on a low-end display device is presented in Table 9. The RSVP browser is an extension of the RSVP principle proposed by De Bruijn and Spence [2000]. These interaction tasks should be easily performed using the numeric keypad and control keys of the Nokia 6310i.
A summary of the evaluation of riffling techniques on a low-end display device is shown in Table 10. These tasks can be quite accomplished by using the Nokia 6310i's numeric keypad. A summary of the evaluation of zoom and pan techniques on a low-end display device is shown in Table 11.
Based on the evaluation of the visualization techniques, the Bifocal Display, non-graphical fisheye views, riffling and semantic zoom appear to be the most suitable techniques on low-end small display devices such as the Nokia 6310i. The rest of the techniques are not suitable for low-end displays, mainly due to the limitations imposed by the resolution of the Nokia 6310i display.

H IGH - END DISPLAY DEVICES : P ALM TM M 515
- Focus + context techniques
- Suppression techniques
- Magic lenses
- Riffling techniques
- Zoom and pan techniques
- Summary
The increased screen resolution on the PalmTM m515 device over that of the Nokia 6310i mobile phone alleviates some of the problems associated with focus + context techniques in the context of low-end display devices. A summary of the evaluation of focus + context techniques in a high-end display device is shown in Table 12. In the context of mobile phone displays such as the one in the Nokia 6310i, it was observed that color imposes limitations on the use of z -through technique map.
In the case of the PalmTM m515, no such restrictions exist due to the high color display used. A summary of the evaluation of suppression techniques on an advanced display device is shown in Table 13. A summary of the evaluation of magic lenses on an advanced display device is shown in Table 14.
A summary of the evaluation of riffling techniques in a high-end display device is shown in Table 15. Also, the color display increases the potential application areas of zoom and pan techniques. A summary of the evaluation of zoom and pan techniques in a high-end display device is shown in Table 16.
The evaluation of the visualization techniques on a high-end display device indicates that the majority of the techniques are suitable for use on the PalmTM m515 device. Semantic zoom, on the other hand, is still likely to be somewhat hampered by the limited processing capacity of the m515.
![Figure 26. WEST interface in keyword mode with focus on the 4 th card in the sequence [Björk et al., 1999]](https://thumb-eu.123doks.com/thumbv2/9pdfco/1890664.266830/64.892.133.770.118.518/figure-west-interface-keyword-mode-focus-sequence-björk.webp)
E VALUATION RESULTS
However, it should be emphasized that these results are not necessarily conclusive, given the nature of the evaluation, and that prototyping and empirical testing are likely to yield more sustainable results. However, such an extensive evaluation process was not a feasible approach considering the nature of this thesis.
CONCLUSIONS
This was mainly due to the improved visual and interactive properties of the device in question. First, it presents a critical information visualization problem and possible solutions to the problem, based on relevant research results reported in the literature. These results and the proposed framework can be used as guidelines in selecting appropriate techniques for visualizing information on small display devices.
Holmquist, POWERVIEW: Using Information Links and Information Views to Navigate and Visualize Information on Small Screens. In Proceedings of Mobile HCI 2001: Third International Workshop on Human Computer Interaction with Mobile Devices, M.D. Lamping, The Hyperbolic Browser: A Focus+Context Technique Based on Hyperbolic Geometry for Visualizing Large Hierarchies.
Card, Tabletop Lens: Combining Graphical and Symbolic Representations in Interactive Focus+Context Visualization for Tabular Information.
![Figure 4. The Perspective Wall by Mackinlay et al. [1991].](https://thumb-eu.123doks.com/thumbv2/9pdfco/1890664.266830/12.892.123.771.119.527/figure-perspective-wall-mackinlay-et-al.webp)
![Figure 6 illustrates this idea as implemented by Lieberman in an earlier prototype [1994]](https://thumb-eu.123doks.com/thumbv2/9pdfco/1890664.266830/16.892.129.768.217.646/figure-illustrates-idea-implemented-lieberman-earlier-prototype.webp)
![Figure 8. The Bifocal Display principle [Leung and Apperley, 1994].](https://thumb-eu.123doks.com/thumbv2/9pdfco/1890664.266830/19.892.128.763.119.387/figure-bifocal-display-principle-leung-apperley.webp)
![Figure 9. The Document Lens by Robertson and Mackinlay [1993].](https://thumb-eu.123doks.com/thumbv2/9pdfco/1890664.266830/20.892.123.776.120.553/figure-document-lens-robertson-mackinlay.webp)
![Figure 10. The Hyperbolic Browser by Lamping and Rao [1996].](https://thumb-eu.123doks.com/thumbv2/9pdfco/1890664.266830/21.892.130.767.210.666/figure-hyperbolic-browser-lamping-rao.webp)
![Figure 12. Graphical fisheye view by Sarkar and Brown [1994].](https://thumb-eu.123doks.com/thumbv2/9pdfco/1890664.266830/23.892.128.778.450.934/figure-graphical-fisheye-view-sarkar-brown.webp)
![Figure 13. Z-thru mapping by Silvers [1995].](https://thumb-eu.123doks.com/thumbv2/9pdfco/1890664.266830/24.892.136.769.624.1099/figure-z-thru-mapping-by-silvers.webp)