Adhesion between the FBB and the hot melt can be improved by matching the polarity of the hot melt close to that of the FBB. The condensed water can break the hydrogen bonds formed between the FBB and the hot melt.
INTRODUCTION
FROZEN FOOD PACKAGING PROCESS
Packaging operation for folding boxboard
Gluing of the paperboard
Deep freezing
FORMATION OF ADHESION
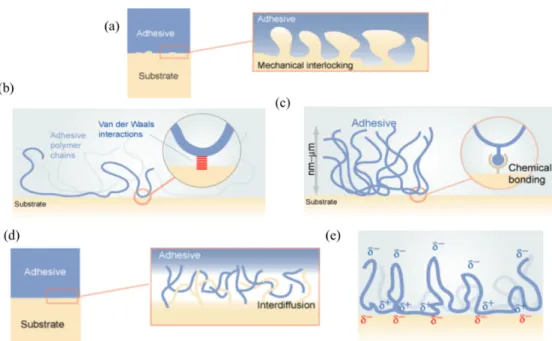
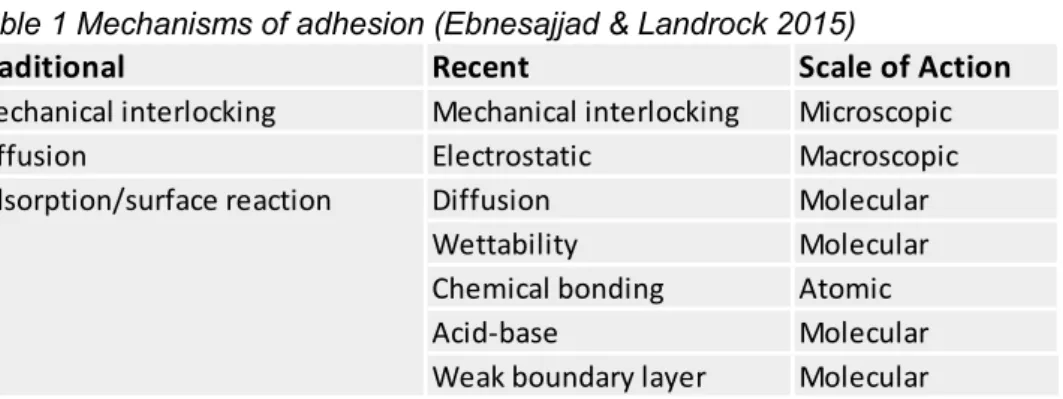
- Adhesion theories
- Mechanical interlocking
- Electrostatic theory
- Diffusion theory
- Chemical bonding
- Acid-base interaction
- Wettability
- Weak-boundary layer
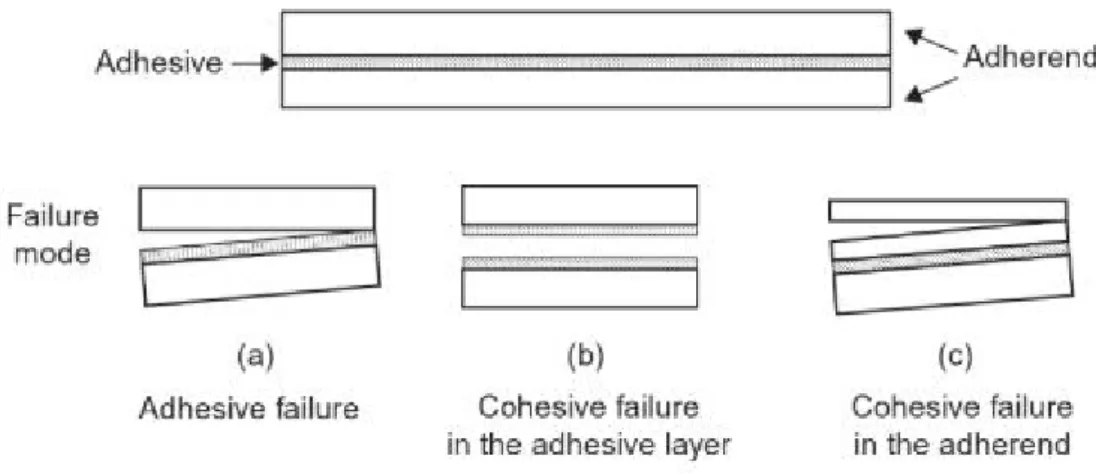
- Structure of the adhesive joint
- Testing of adhesive bonds
- Failure modes
The adhesive displaces air at the interface which penetrates into the voids of the substrate. Adhesive forces attract the adhesive to the substrate and cohesive forces are the internal strength of the adhesive.
ADHESIVES
Hot melt adhesives
After the adhesive is applied, the second substrate is pressed against the hot melt. The compatibility of the resin with the polymer and the wax greatly affects the properties of the hot melt adhesive.
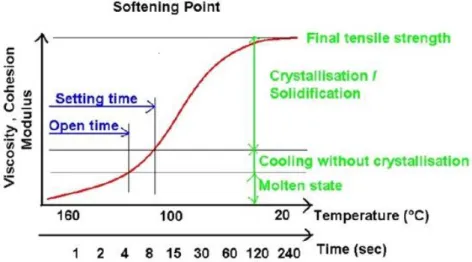
Rheology
Third main component is wax which has the function of changing the viscosity suitable for processing and adjustment of the setting time. The study by Honiball (Honiball et al. 1997, p.18-26) indicates that the softening points and high temperature properties of the adhesives are largely controlled by the waxes and their degree of crystallinity and crystallization temperature. Application temperature also has a great effect on the viscosity, higher temperature lowers the viscosity and the opposite, lower temperature increases the viscosity.
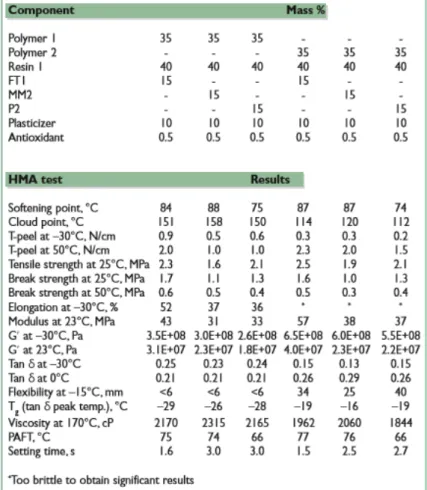
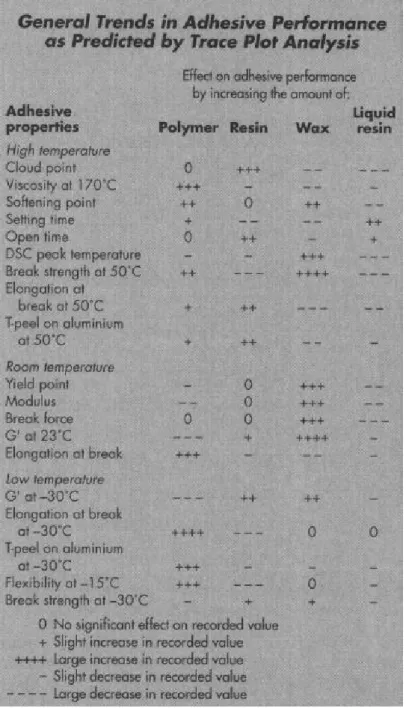
Different components affect the viscosity of the adhesive at elevated temperatures in different ways, as shown in Table 4. The components that affect the performance of the hot melt under deep freeze conditions are of particular interest to the topic of this thesis.
Deep freeze hot melts
FOLDING BOXBOARD MATERIALS
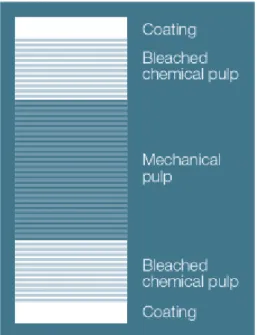
- Structure of folding boxboard
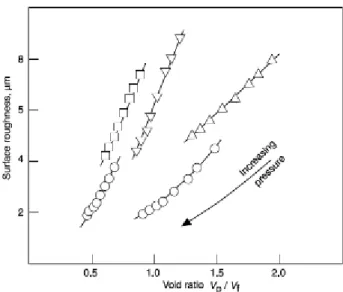
- Surface structure and topography
- Effect of substrates topography in adhesion
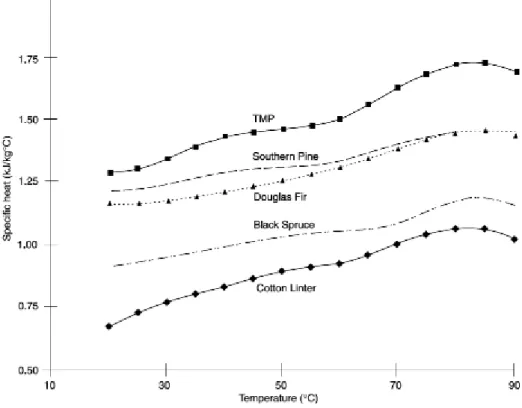
- Thermal properties of paperboard
- Effect of moisture and temperature on adhesion
- Internal and surface sizing
- Migration of sizing agent
- Promoting adhesion through surface modification
Theoretically, the coefficient of friction would indicate adhesion forces until the surface of the cardboard is deformed. Effective heat transfer can cause the hot melt adhesive to harden prematurely, resulting in inadequate adhesion between the adhesive and the substrate. Moisture condenses on the surface of the carton when you take it out of the freezer.
Low density FBB has the highest moisture content of the three board types in the comparison. The surface size is applied to the top of the cardboard and creates a smooth surface that improves water resistance, printability and surface strength. Unreacted AKD can lie on the upper fibers of the paperboard, creating hydrophobic local patches and thus hindering the adhesion between paperboard and the hot melt adhesive.
The surface of the board can be modified in many ways to promote adhesion, such as flame or corona treatment.
METHODS AND MATERIALS
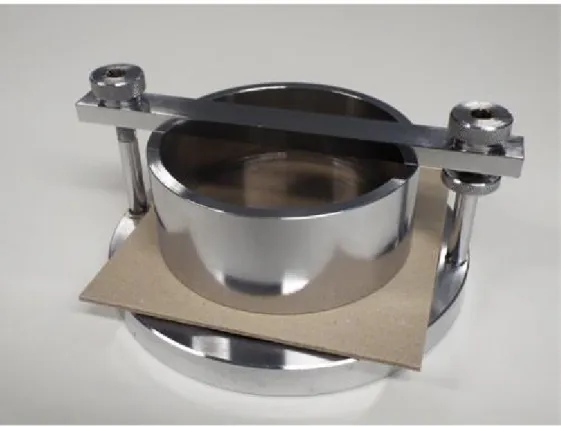
- Water absorption
- Coefficient of Friction
- Air permeability
- Surface topography and roughness
- Surface energy
- Gluing and deep freeze conditioning
- Surface strength
- Surface pH
- Folding boxboard materials
- Adhesive materials
Air flows out of the measuring head for a predetermined test time and the pressure in the measuring head is recorded. Open time (second) = Time taken after applying hot melt until the next substrate is pushed against it. The amount of adhesive applied greatly affects placement and opening time, as does the thermal conductivity of the substrate.
The diameter of the hot melt application nozzle was maintained at 0.46 millimeters throughout the measurement. DSC allows the detection of phase changes such as melting of materials (Tm), glass transition and crystallization (Tc) of polymers. The transition enthalpy can be calculated from the curves by integrating the given peak (Vesna Nikolićet al., 2019).
For this thesis, a variety of substrates were chosen to clarify which properties affect the stickiness of the cardboard.
RESULTS AND DISCUSSION
Water absorption
Air permeance
Surface variation and roughness
Optitopo-calculated roughness values from gradient images in table 13 show similar results to Bendtsen roughness values where baseboards have significantly higher roughness and coated grades are the smoothest. Emveco roughness gets its values from medium-roughness, while Bendtsen / Sheffield get their results from roughly the same medium-scale region. PPS is often used to predict printability, its scale lies between fine and medium scale.
Surface variance taken from the gradient images was divided into three categories: large-, medium-, and fine-scale surface variances in Figures 35–37. Fine-scale roughness is an important factor, especially in printing, and it correlates better with missing dots than PPS. At fine scale, the surface variations between samples even out, although the characters with the most variation at large and medium scales still show greater variation among the comparison group.
The rear-coated species have the least surface variation, but not by a large margin, and on a small scale, some uncoated species have the same variation as the coated species.
Coefficient of friction
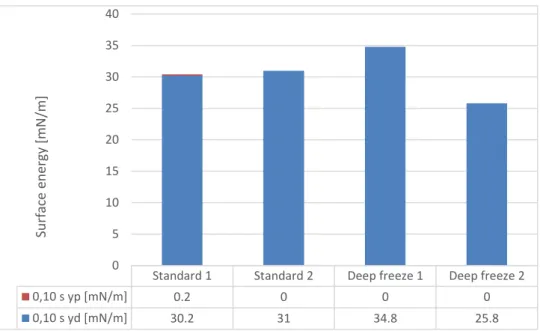
Surface energy
DIM was rapidly absorbed by two samples, meaning that the polar component and thus the total surface energy could only be received and calculated in a time frame of 0.1 seconds. Surface polarity, which is often linked as a requirement for good adhesion, was relatively low in most samples, but grades such as plate 18 and 15 had polarities of 27.1% and 40.4. Comparing the test results of 0.1 second and 1 second in some grades, the surface energy and polarity increased more than others, suggesting that the water penetrates differently between the cardboard grades.
Surface pH
The surface pH of most board grades was in the alkaline range, as shown in Figure 41. The test results showed a large variance mainly due to the position and angle of the gauge, but the above grades stood out from the rest of the samples in this comparative group.
Differential scanning calorimetry of hot melts
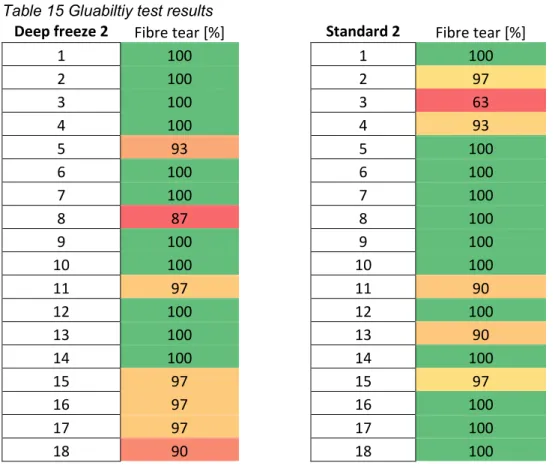
Gluability testing
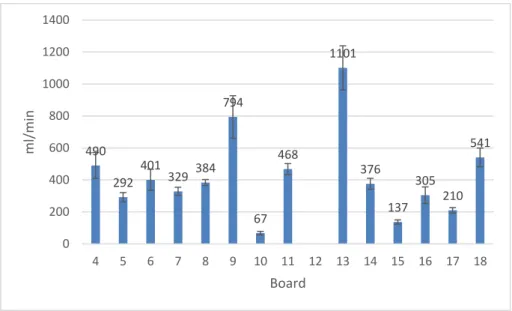
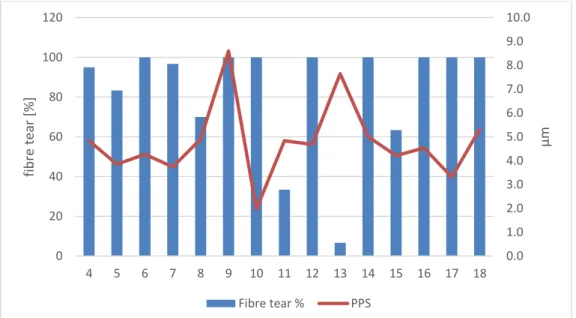
However, this effect can be considered negligible since the phenomena mostly occurred in freezer 2, which still achieved the highest fiber tearing results. In general, the adhesive test results indicate that freezer adhesives exhibit higher fiber tear values when exposed to temperatures of -40°C, as shown in Tables 15 and 16. With Freezer 2, all samples could be categorized as having sufficient fiber tear as the lowest value was 87.
Adhesive test results with the adhesives from the other supplier followed the same trend with adhesives deep freeze 1 and standard 1. Adhesives intended for deep freeze applications provided almost perfect fiber tear across all samples, while with standard grade adhesive there were samples such as board 13 where almost no fiber tearing did not occur at all. With adhesive freezing 2, the lowest grade had a fiber tear percentage of 87 and the same as with deep freezing 1, this can be considered a good level of adhesion.
The results show that when the same board type is used on both sides of the glue seam, the fiber tear results decrease further.
Scanning electron microscope
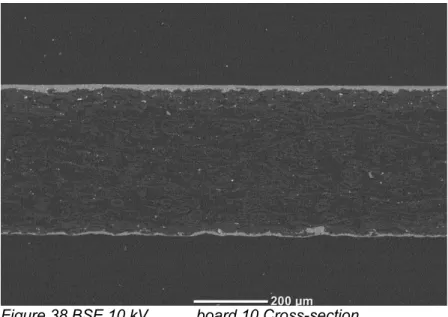
Both grades have similar surface areas, but in table 11 the filler particles, shown as brighter white dots, are larger than those with table 16, also the amount of filler appears to be slightly greater. Since the back of the cardboard is mostly covered with heavier particles, this can have an impact on thermal conductivity. The cross-sectional microtome images in Figures 49-51 have been stained with potassium iodide to highlight possible starch content within the cardboard.
In figures 49 and 50 there is very little or no trace of the cationic starch used as a sizing agent. However, in Figure 51, the size of the surface can be clearly seen against the bulk which has a yellow color. In Figure 51, dark purple stains can be clearly seen under the top layers of the sidecoat and even more widespread areas of starch on the back of the board.
As the name implies, the surface size lies mostly on the surface of the cardboard, but still penetrates about 100 micrometers inside the surface of the cardboard.
Surface strength
Other qualities, which received a perfect fiber tear percentage in the glue tests, show a surface strength of 3 meters per second or even higher, so weak surface strength does not fully explain the good bondability results, but is an important factor when assessing adhesion through fiber. tear.
Summary of the test results
Since fiber tear is the factor being evaluated, the surface strength of the board must be considered. The surface images taken from the back of the cardboard showed that the surface was filled with heavier particles. In short, too much glue can have a negative effect on the glueability of the cardboard.
The area size was found to soften the cardboard surface to some extent in the case of Plates 5 and 6 which are essentially the same but the latter without area dimensions. In this case, the low interfacial tension with the water can cause the adhesive to dislodge. The moisture content of the cardboard can affect the stability of the adhesive joint after freezing due to the expansion of the bound water.
Low DSC melting enthalpy of the hot melt adhesive may be the cause of premature solidification of hot melt combined with good thermal conductivity of cardboard.
CONCLUSIONS
The formation of weak boundary layers between the FBB and the hot glue interface would easily form due to weakly bonded material such as low molecular weight compounds on the surface of the paperboard substrate. This can lead to improper wetting of the substrate, leaving trapped air and voids without the adhesive acting as a weak boundary layer. Good wettability of FBB is a prerequisite for adhesion between FBB and hot melt adhesive, as the hot melt must wet the substrate to create an intimate contact.
Although several failure modes included cohesive failure of the adhesive, the only failure mode evaluated was fiber tearing. Adhesive failure was limited to standard grade adhesives operating below their glass transition temperature. The properties of the hot melt adhesive that affect molding were found to be the critical surface tension of the hot melt, which affects how the adhesive will wet the surface of the paperboard.
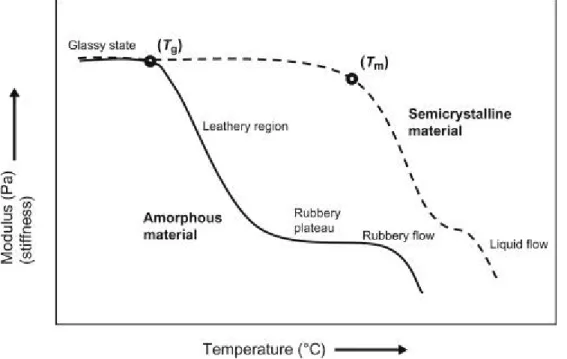
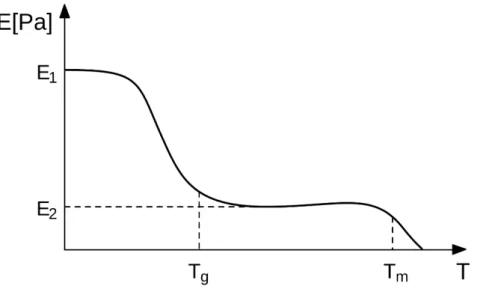
The glass transition temperature of the hot melt was found to have a major influence on the mechanical performance of the hot melt.
FURTHER STUDY SUGGESTIONS
However, the gluing problems occur on the surface that is pressed against the glue line, which means that the wetting of the substrate where the hot melt is applied is not the problem, but rather its counterpart. Adhesives - World (4th Edition)" Limited Access." https://www.cere-sana.com/en/market-studies/industry/adhesives-world. Role of Acid-Base Interfacial Bonding in Adhesion.” Journal of Adhesion Science and Technology.
Effect of temperature on the spring back of cellulose-based skin in hot press. The International Journal of Advanced Manufacturing Technology. AKD Sizing - Dispersion colloidal stability, dispersion and sizing with pre-flocculated dispersion.” https://www.bth.se/com/aje.nsf/bilagor/Lic Åse Jevinger_1_pdf/$file/Lic Åse Jevinger_1.pdf. Routes of Administration for Nanodrugs and Characterization of Nanodrug Loading.” In Characterization and Biology of Nanomaterials for Drug Delivery, 587–625.
Determination of Specific Heat for Dry Fiber Material." In Conference: 82nd Annual Meeting Technical Section CPPA.