I really enjoyed the experience of working in a collaborative and friendly environment as a member of the Wireless Sensors Networks group at Aalto University. Knowing the location of the network nodes is essential to support many applications and protocols.
Our field of interest
At present, reliable outdoor positioning systems based on the Global Positioning System (GPS) have been successfully deployed over the past decade for those systems where form and cost are not major concerns.
Problem definition
Additionally, the solution attempts to counteract random shadow fading by using "shadow-independent" path loss estimates for distance prediction1. Ultimately, the solution implements a weighted least-squares localization algorithm that reduces the impact of distance estimation errors on location estimation.
Methodology
Thesis outline
In Chapter 3, sources of RSS variability are first analyzed, and then the path loss estimation of the current serial system is discussed. In Chapter 6, the performances of the proposed array system and of the overall localization solution are analyzed.
Range methods
- Received signal strength
- Time of flight
- Beamforming
- Radio interferometry
Major sources of error are the multipath effect and the non-linearities of the power amplifier at the transmitter. Therefore, the location of the transmitter (blind node) can be approximated when multiple receivers (anchor nodes) detect the shift.
Range-free methods
Connectivity-based
Connectivity-based methods are commonly known as shortest path or distance vector methods, because they estimate distances based on the number of hops over the shortest path and the average radio range [16, 17]. Connectivity-based methods attempt to alleviate two main problems in large-scale multi-hop networks, such as short-distance measurements and a limited number of anchors, while simultaneously providing coarse-grained localization.
Proximity-based
In practice, the suitability of shortest path methods is limited by the large errors of the coarse-grained distance estimates, especially in the case of anisotropic networks, i.e. non-uniform node distribution. On the other hand, proximity information is also used to infer distances, such as in the proximity-distance mapping approach [31].
Fingerprint-based
Then, in the second step, called fine-grained localization, the center of gravity is calculated, i.e. the intersection of the regions containing the blind node that was classified in the first step. In this way, the approach tries to avoid outliers as they occur in the shortest path approaches in the case of anisotropic networks.
Hybrid measurements and solutions
Just like hybrid measurements, hybrid range-based and range-free solutions can improve the overall performance of the solution while dealing with two main problems in multi-hop networks, such as short-range measurements and limited number of anchor nodes. In a similar way, the combination of distance measurements and the proximity-distance map approach for estimating one-hop distances and multi-hop distances, respectively, can also improve the overall performance of the solution, while outliers in the case of anisotropic network at the expense of of the costs are avoided. of more anchor nodes than in the two-phase localization algorithm.
Solution approach
Furthermore, the solution attempts to counteract the shadow fading by using "shadow independent" path loss curves for distance prediction. As will be noted later, the path loss estimates are performed online, bypassing impractical offline path loss estimates that require prior planning efforts and distance estimation errors caused by such outdated path loss estimates.
Sources of RSS variability
Extrinsic sources of RSS variability
Here, the random fading of the channel is the major concern for path loss estimation, which is analyzed in detail in Section 3.2. b) Interference and additional noise. In the current solution, high activity is assumed when the channel is busy more than 30% of the time.
Intrinsic sources of RSS variability
In [46], the impact that the presence/absence of an edge has on the overall structure of the network graph is estimated by calculating the amount of disruption that removing the edge (i, j) has on the spectrum of the graph. . The current chapter consists of a brief description of the IEEE 802.15.4 standard [43] and the Sensinodes motes [41].
Path loss modelling
Distance-dependant signal loss
Therefore, the prediction of the total change in signal intensity involves both the inverse square law and an estimate of the atmospheric attenuation along the path. The effect of the atmospheric attenuation in relatively small spaces, such as indoor environments, can be neglected as its impact on the path loss estimate is minimal, for example the attenuation is less than 10 dB/km.
Multipath effect
Here it is known that the total received power is the vector sum of the multipath components of a signal. Here the strengths of a signal's multipath components and their relative phase shifts are not determined solely by the distances traveled.

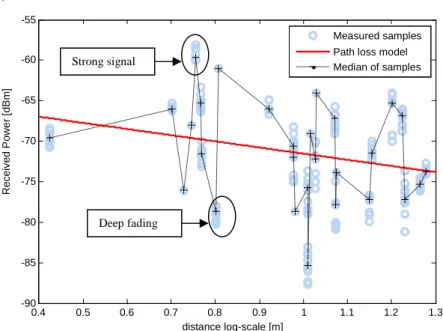
Shadow fading
The current ranking system implements a new and practical approach to account for random shadow fading. Unlike cumbersome approaches such as offline attenuation calibrations presented by static obstacles, the current ranking system incorporates shadow fading that affects observations into path loss estimates, which are calculated online. The attenuation of the shadow affecting the observations varies in different locations, but generally exhibits spatial correlation.
Optimization
In the bounding box algorithm, the shader draws a pair of horizontal lines and a pair of vertical lines around each anchor such that the minimum distance between each line and the anchor location is equal to the distance estimate [24]. In the global optimization approach, all available distance information is used, i.e. the distance is estimated and used for sensor localization as long as it can be measured because not all blinds have enough surrounding anchors in their radio range to localize. The converted anchors are then used to reference other not-yet-localized shaders in the network.
Localization algorithm approach
As an alternative to the global optimization approach, researchers have sought recursive methods to overcome both the incomplete range problem and the limited number of anchors problem in large-scale multi-hop networks. The localization process thus propagates from the area closer to the start-up anchors to the area inaccessible to them.
Problem statement
Least-squares optimization
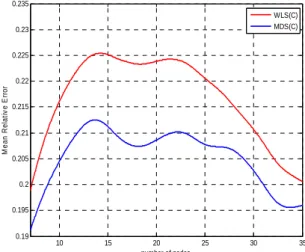
In particular, as with the multilateration approach, the distance adjustment approach adjusts all estimated distances equally based on the belief that they have the same error distribution. In [47], the authors argue that this distance matching approach guarantees that the matrix of fitted distances is indeed a Euclidean distance matrix. However, no performance comparison of the WLS with respect to a standard least squares approach such as the MDS has been provided.
Weights function
The error distributions of the distance estimates depend on the accuracy of the prediction of the received signal strength expressed in dBm. The above equation relates to the proportional distance estimation error for a particular estimated distance, so that the expected proportional error of the distance estimates is given by Finally, the displacement ρi,j that conditions the accuracy of the estimated distance δi,j is also proportional to the estimated distance and is defined as follows.
Simulative performance analysis
Simulations results
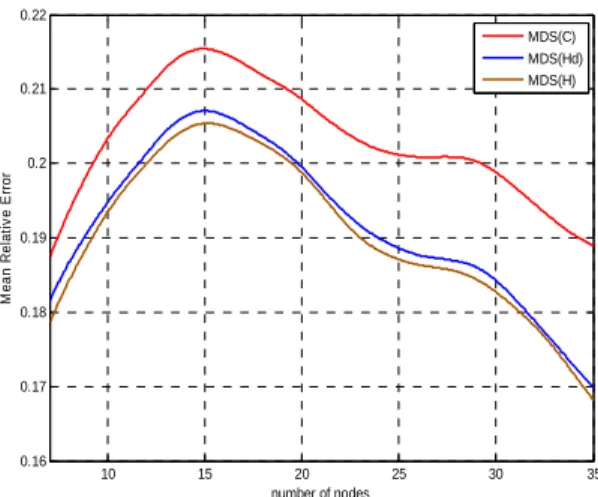
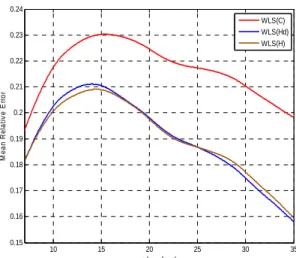
In the present study, the sensitivity of the algorithms with respect to the parameters σε and η, which affect the error distribution of the distance estimates according to equation (4.9), is not analyzed. Figures 4.2 and 4.3 show the performance of the MDS and WLS algorithm, respectively, when different weight matrices are used. 23 The sensitivity of the various parameters in the weight function of equation (4.6) is discussed in [46].
The IEEE 802.15.4 Standard
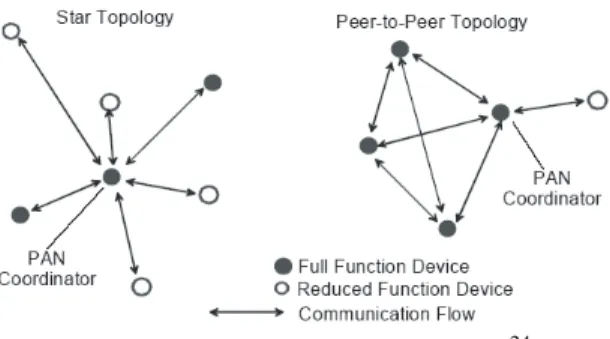
Network topology
In the star topology, one node acts as the network controller, also called the PAN coordinator. The controller mainly controls and routes communications between nodes in the network, but can also fulfill other roles depending on the application strategy. In the peer-to-peer topology, network nodes communicate in a mesh-like manner as long as connectivity exists, where communication paths can be multi-hop, i.e. ad-hoc.
Layers
Application side
In event-driven applications, the sleep interval will ultimately depend on the frequency of events. Then the sleep interval of the localization application will depend on how often targets need to be located, which in turn depends on their movement speed. Another important aspect that affects power consumption and determines the scalability of the application is the amount of traffic the application generates.
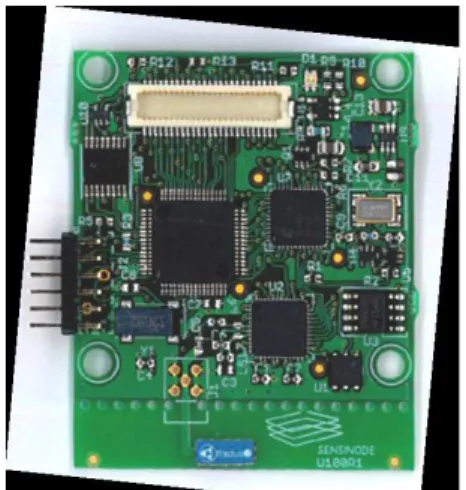
Sensinodes
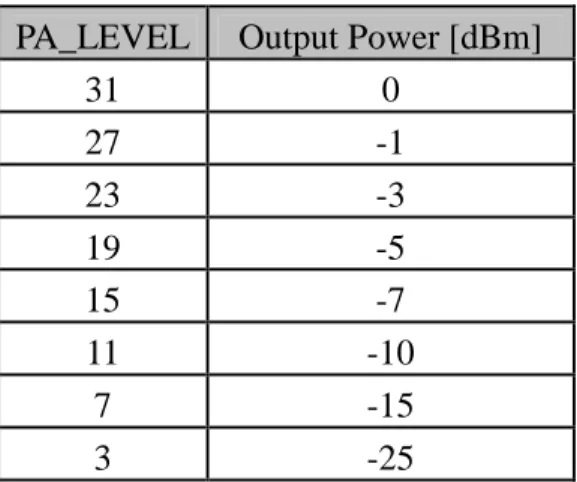
Output power
In the CC2420 radio chip, the output power level of the radio transmitter can be controlled by configuring the TXCTRL.PA_LEVEL register. Note that the TXCTRL.PA_LEVEL register consists of 5 bits, so there are 32 adjustable output power levels possible. In [4], the total standard deviation of transmitted power inaccuracy was found to be 2.24 dB.
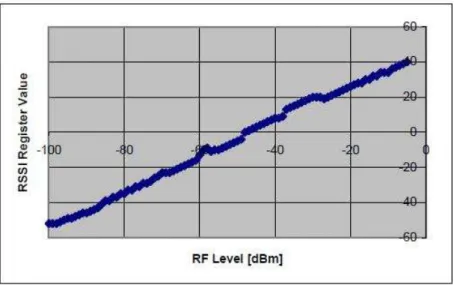
RSSI / Energy detection
The measured RSSI value is then received at the second last byte of the packet. In fact, the standard error of the path loss curve fitting is halved with respect to the case when diversity techniques are not used. It can be observed that the standard error of the path loss curve fitting is reduced by approximately 25% on average when anchor-specific path loss estimates are performed.
The achievable average range estimation accuracy is about 10% of the radio range when seven anchors. The achieved average localization accuracy is about 14% of the radio range when seven anchor nodes are used.
Creating the application
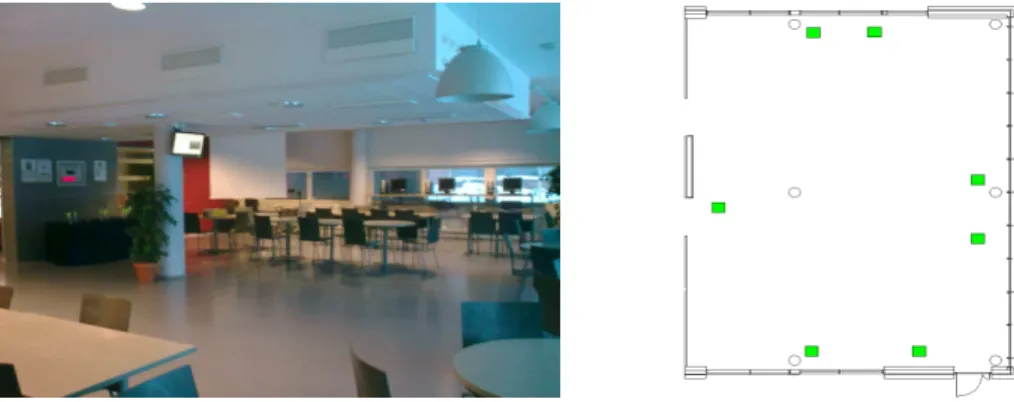
Empirical set-up
Each radio module was equipped with an external monopole antenna mounted a wavelength apart from the PCB, as shown in Figure 6.1, to reduce the impact of the electrical components and ground of the PCB on the antenna radiation pattern. An important aspect of the experiment becomes the parameter configuration such as the output power, time interval between successive beacons, channel hopping order and number of beacons that each node transmits. In a typical office room, where the maximum moving speed of a person is about 1 m/s, the time coherence of the channel is below 100 ms.
Results analysis
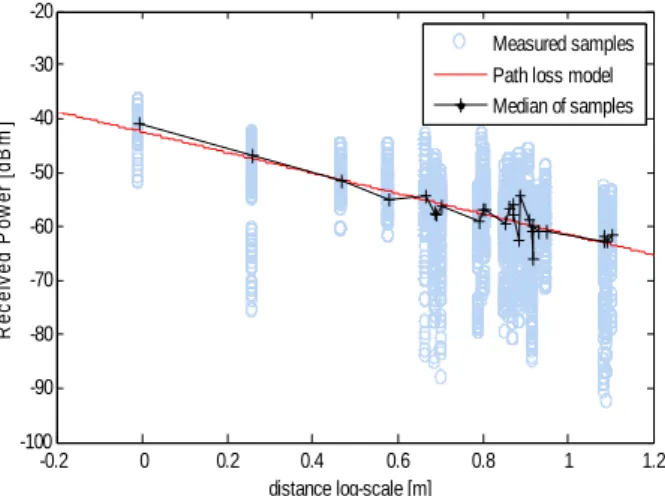
Counteracting multipath effect
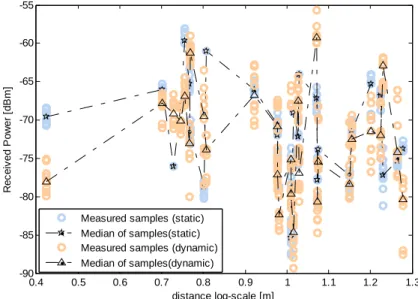
On the other hand, to enable frequency diversity for RSS measurements while avoiding interference, the channel hopping sequence was chosen such that two consecutive channels in the four-channel sequence are at least four carriers apart, which follows MHz. It can be observed that the accuracy of the estimation of the path loss improves, i.e. the median of data follows the fitted curve better when frequency and spatial diversity are used to perform RSS measurements, which can be better noticed at large distance values. As a result, the error of the distance estimates is also reduced when diversity techniques are used to obtain RSS measurements.
Counteracting shadow fading
Location estimate
Conclusions
In turn, the solution applies an unconstrained optimization algorithm, such as the weighted least squares algorithm, in order to detect blinds. This algorithm was shown to reduce the impact of distance estimation errors on location estimation, where the gain achieved in distance matching accuracy increases as the number of beacons increases to infinity. It can be concluded that propagation-based localization solutions can lead to unpredictable results in hostile situations, except that they are limited to the region where the radiated power is uniform; however, they can provide localization services for many fault-tolerant applications in good situations.
Future work …
Nath, "DV Based Positioning in Ad hoc Networks," Journal of Telecommunication Systems, 2003, accessed online on February 2, 2010, http://www.springerlink.com/content/gt57ju03517v2076/fulltext.pdf. Experimental Comparison of RSSI-Based Localization Algorithms for Indoor Wireless Sensor Networks,” REALWSN'08, April 1, 2008, Glasgow, UK, available online February 16, 2010, http://portal.acm.org/citation.cfm ?id. Morse, “Localization with imprecise distance information in sensor networks,” Proceedings of the Joint IEEE Conference on Decision and Control and European Control Conference, 2005, p.
Matlab™ source code on the workstation 71
Well-known anchor locations (true louvre locations are attached. %to calculate end error) Xnodes. %estimate of location, i.e. distance adjustment) alpha_m=1;. expected standard error of received signal estimates. used to adjust path loss curves) alpha_dBm=3;. Global path loss estimate (necessary to compensate for the small number of observations in the anchor-specific path loss estimates).
C-source code on the measuring nodes 83
C-source code on the sink node 91