The research report is a final report of a second research phase on moisture behavior of floor constructions. This publication is the final report of a series of studies into the temperature and moisture behavior of slab-on-soil constructions.
External temperature and moisture load
Outdoor air moisture and temperature
Potential moisture sources of slab-on-ground structures relate to the outer boundaries of the structure and the prevailing conditions along these boundaries as well as the moisture and temperature levels within the structure. Therefore, the external moisture loads of slab-on-ground structure are significantly different from those directed to the building envelope or the superstructure.
Indoor air moisture and temperature
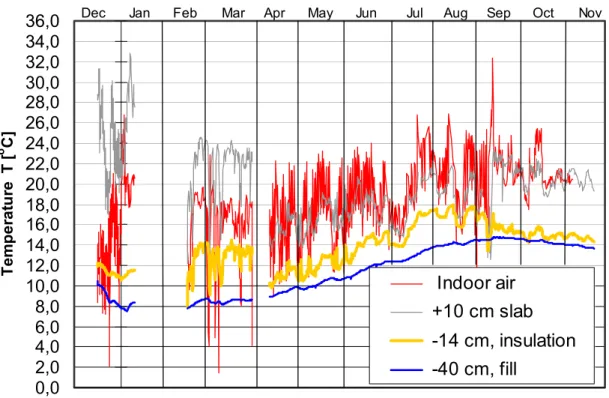
Seasonal and weather changes outdoors, changes in ventilation volumes and indoor air temperatures, and the slow evaporation process of structural moisture cause changes in the operating conditions of slab-on-ground structures. The indoor air quality of the room is excellent and the temperature conditions are comfortable during the summer and winter months.
Temperature and water content of the soil
The water vapor content of the pore air is also high due to constant evaporation from gravity water and groundwater. Watershed drainage is continuous by gravity flow through outlets below the water table into river and lake systems or wetlands.
Internal moisture and temperature load
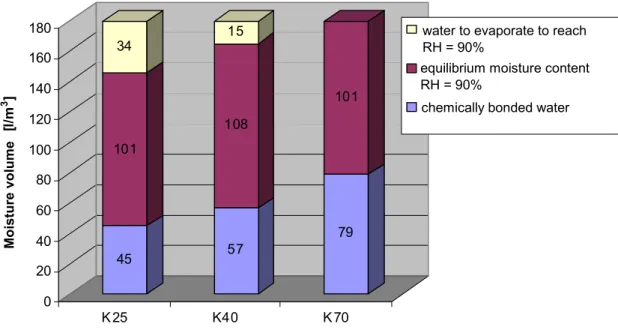
The volume of the inflowing water depends on the rainfall and also on the amount of gravity water that reaches the groundwater basin. The amount of physically binding water depends on the temperature and humidity of the environment.
Bonding of water
Hygroscopic sorption
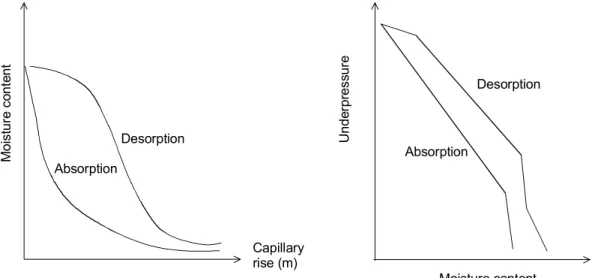
The curves of the equilibrium moisture content of the same material upon wetting and drying show a strong hysteresis. The moisture capacity of a material is high if only a small change in relative humidity causes a large change in the water content of the material.
Capillary suction
In general, the average diameter of these tubes increases as the grain size of the groundmass increases. This is due to the complexity of the capillary tube in porous materials and the.
Chemical bonding and osmosis
However, in complex porous materials, some of the smallest channels remain full of water as the general water level falls below their location. As discussed before, adsorption and osmosis also keep water near the solid walls of the pore structure.
Transforming mechanisms of moisture
- Diffusion
- Capillary moisture flow
- Simultaneous diffusion and capillary movement
- Gravitational movement of water
- Evaporation and moisture convection
The permeability depends on the underpressure pc, which further depends on the water content of the material w. If the moisture content of the medium is above the critical level, only capillary moisture flow is considered.
Specific heat and thermal conductivity of soil
Specific heat of soil
Thermal conductivity of soil
Moisture conditions of the subsoil
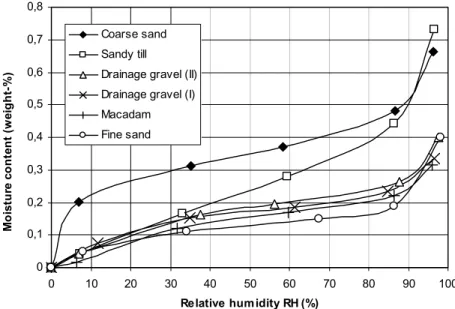
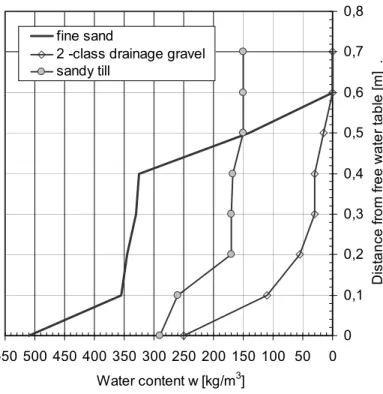
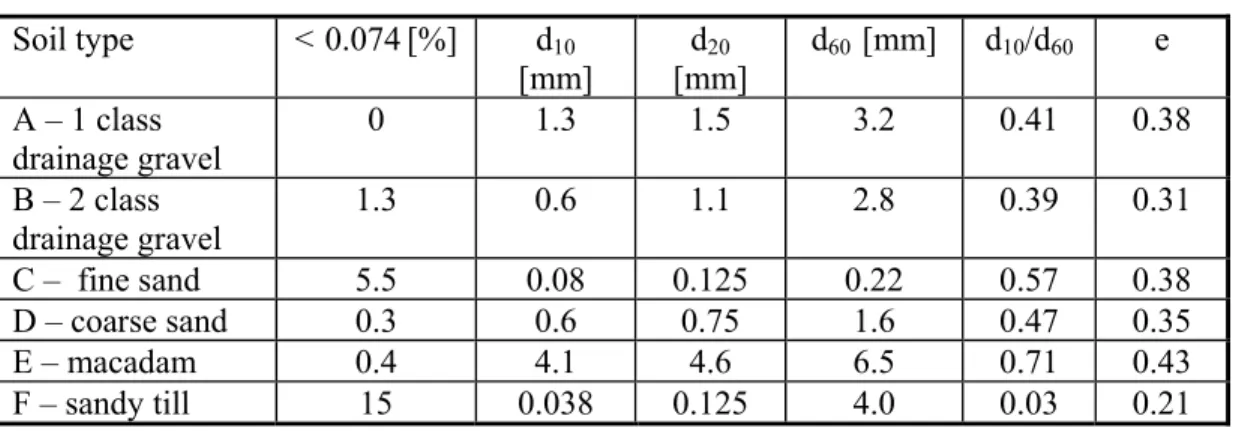
- Moisture content of typical coarse-grained fill and drainage materials
- Moisture flow through slab-on-ground structures
- Capillary flow through slab-on-ground structures
- Diffusion flow through slab-on-ground structures
The results show that the equilibrium moisture content of the gravel was about w = 0.2% in RH = 100%, i.e. below the water table, the pore structure of the soil is assumed to be fully saturated.
Slab-on-ground structure in steady state conditions
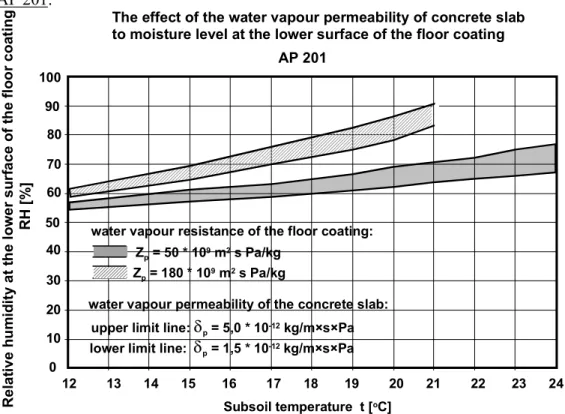
Effect of the water vapor permeability of the concrete slab and floor
The effect of the water vapor permeability of the concrete slab on the moisture content at the underside of the floor coating. Relative humidity at the underside of the floor coating The effect of the water vapor permeability of concrete slabs on the moisture content at the underside of the floor coating.
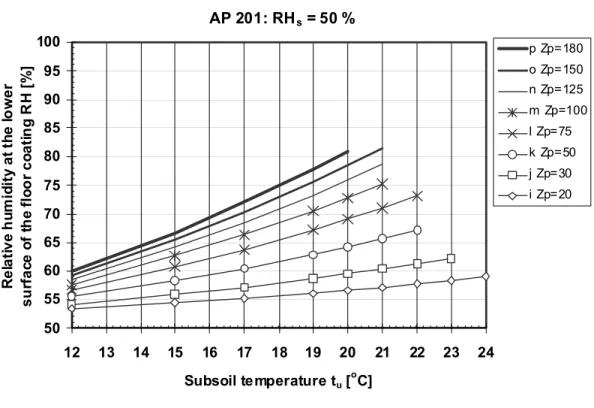
Effect of the relative humidity of the indoor air and the water vapor
Zp m2 s Pa/kg The effect of the relative humidity of the indoor air to moisture level at the bottom surface of the floor covering. The effect of the relative humidity of the indoor air on the moisture level of the lower surface of the layer. The effect of the relative humidity of the indoor air to moisture level at the bottom surface of the floor covering.
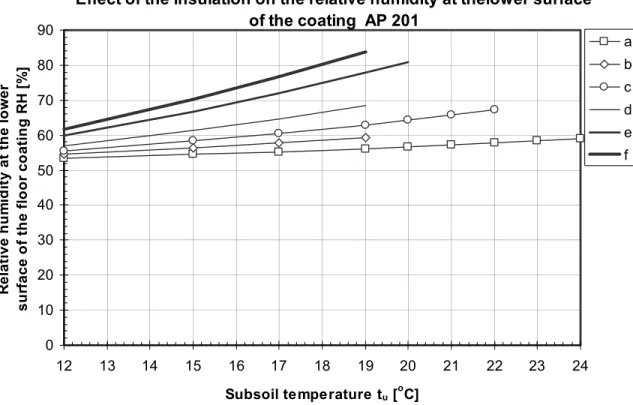
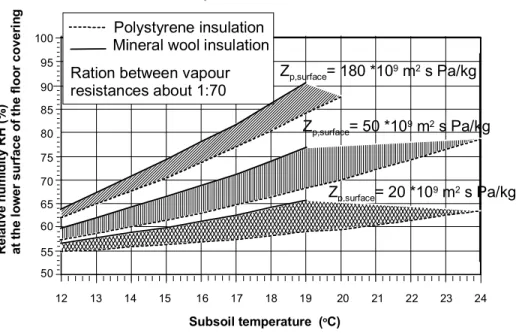
Effect of the material of the insulation and the water vapor permeability
The effect of the insulation on the relative humidity at the lower surface of the covering AP 205. Figures 4.10 and 4.11 show that insulation with low vapor permeability reduces the relative humidity at the lower surface of the floor covering approx. 2. The increased thickness of the insulation also has an indirect effect on the moisture balance of the structure by reducing the heat flow in the subsoil and lowering the temperature and partial pressure of the water vapor in the fill layers.
The influence of the thickness of the insulation and the vapor permeability of the covering material on the relative humidity of the lower surface.
Ventilated slab-on-ground structure under steady state conditions
Ventilated slab-on-ground structure
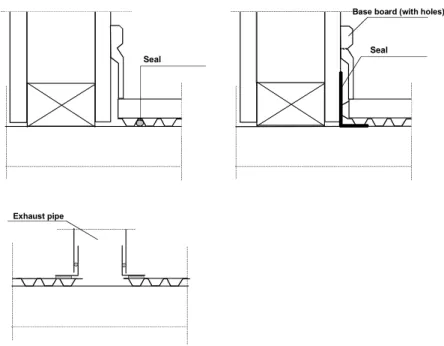
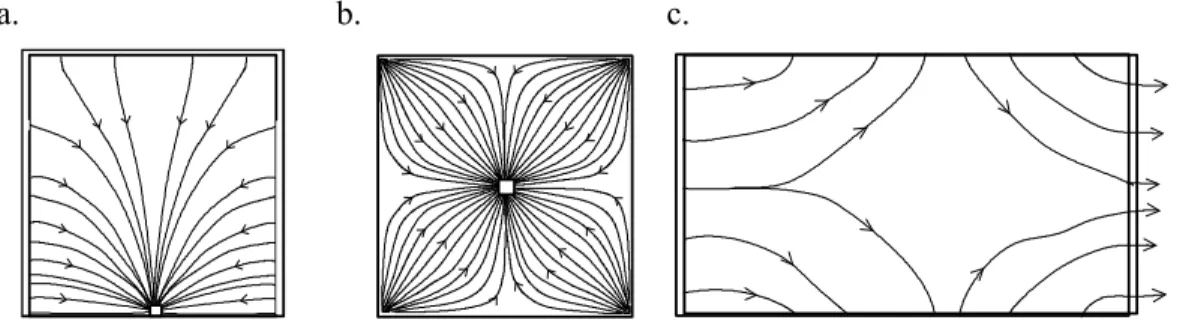
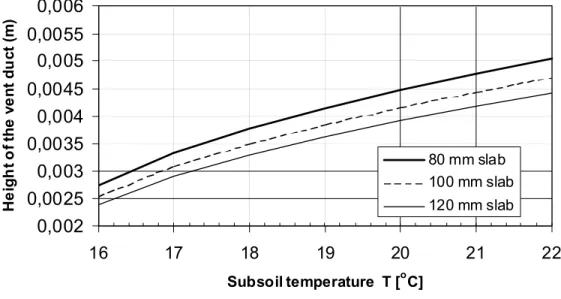
The joints between the new floor construction and the wall vary depending on the function of the interface. The basic ideas of inlet or outlet interfaces between the floor and the wall are shown in Figure 4.15. The required ventilation volume depends on the relative humidity and temperature of the air duct air, the initial humidity and temperature of the ventilation air as well as the subsoil temperature and the moisture flow through the panel construction.
According to measurements, the ventilation of the slab structure on the ground reduces the relative humidity of the slab surface.
Principles of the design
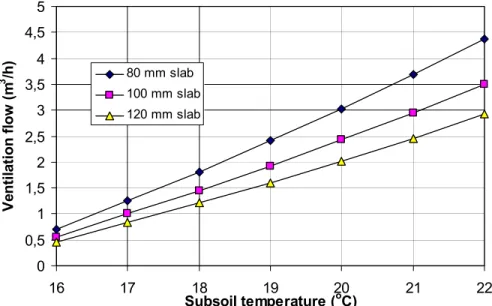
The limit value for the relative humidity of the duct air is usually RH = 75% or less. Relative humidity in the subsoil RH = 100% and temperature and vapor content in duct and ventilation air is Ti=20°C, v = 12 g/m3. The effect of the concrete quality and thickness of the slab on the capillary flow through the structure of the slab is shown in Figure 4.20.
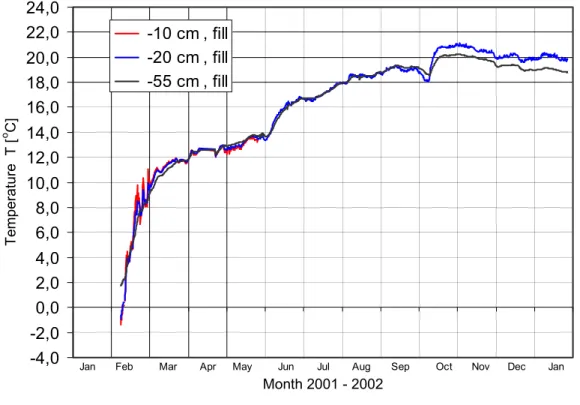
The measured variables were temperature and water content in the filling layers and relative humidity and temperature in the slab and the insulation layer.
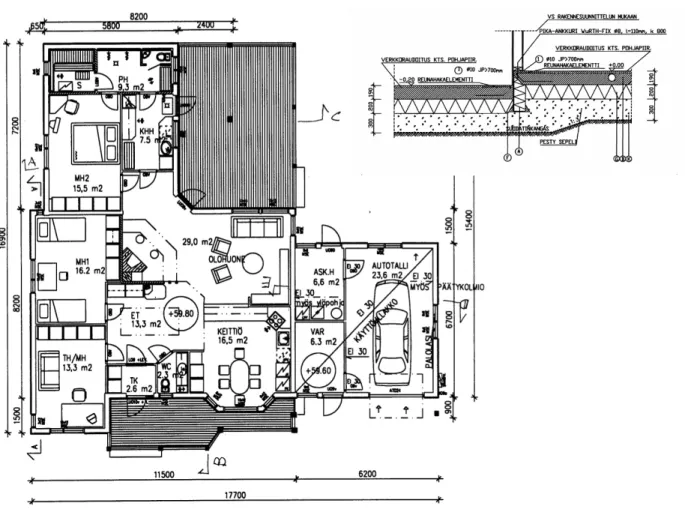
Detached house in Järvenpää
Instrumentation
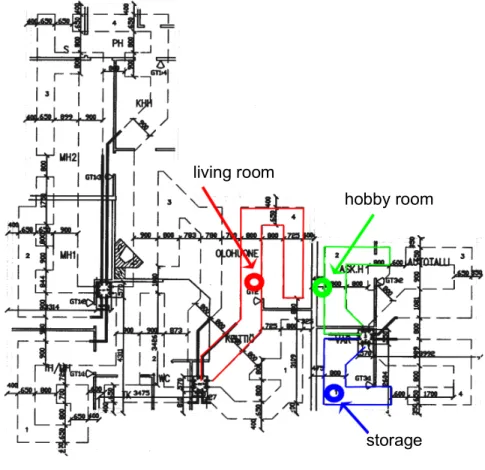
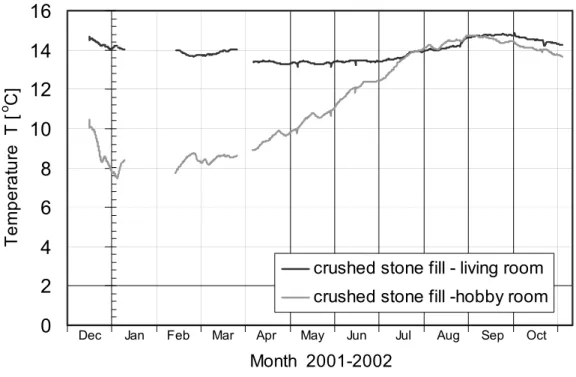
The instrumentation in the living room measured temperatures on the board and insulation as well as the water content and temperature in the hump fill. The instrumentation in the hobby room measured the temperatures of the filling, insulation and board as well as the water content of the filling. The temperature and water content sensors were collected in crushed stone layers during the construction of the slab in the early summer of 2001.
Board and insulation humidity and temperature sensors, as well as indoor and outdoor temperature and humidity sensors were fitted with the automatic data acquisition system in December 2001.
Results of the in situ survey
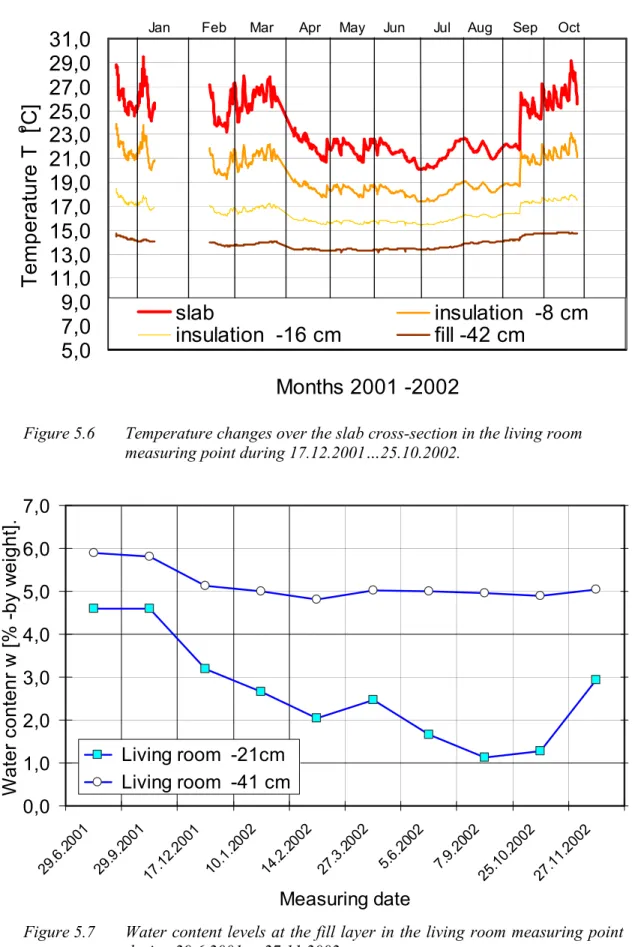
During the autumn and winter, the upper part of the fill layer dried out strongly. The water content in the lower part of the filling also decreased, but only about one percent by weight, to the level w = 5%. The water content of the fill layer near the subsurface remained at the same level as in the living room measurements.
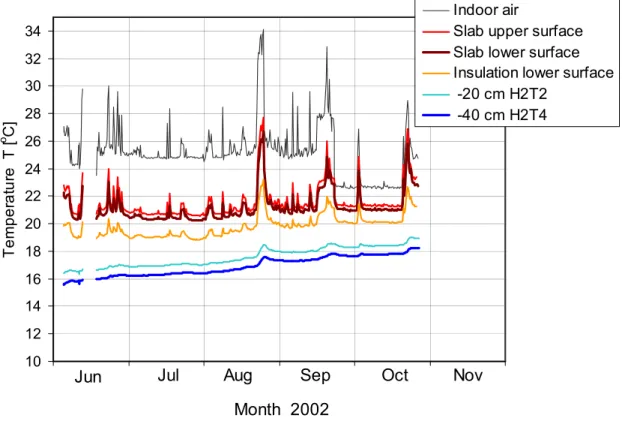
Changes in the relative humidity and temperature of the panel construction and the indoor air are shown in figure 5.10.
Row house in Tampere
Instrumentation
During the construction period in late summer 2001, temperature and water content sensors were installed in the fill layer.
Results of the in situ survey
The measured initial values of the water content of the filling were also slightly higher at this measurement point, approximately w = 3%. The water content of the fill decreased to a constant value w = 2% during the late summer and early autumn of 2002 (Figure 5.18). At the bathroom measuring point, the course of the filling temperature was comparable to the other observations.
The fill water content at the bath measuring point was significantly higher than at the parallel measuring points.
Office building in Hervanta
Instrumentation
The temperature and water content sensors were placed in three measurement points along the slab surface (Figure 5.21) at levels shown in Figure 5.23.

Results of the in situ survey
The relative humidity in the lower part of the insulation layer remained close to RH=95% throughout the measurement (Figure 5.27). The relative humidity of the panel also remained stable, as the humidity at the bottom of the panel was RH=80% and near the surface RH=65%. According to measurements, the water content in the fill remained between 1-3% throughout the summer.
At the beginning of September the water content clearly increased due to the rain and voluminous irrigation of the surrounding plantation.
Evaluation of the results
The fill temperature under the hobby room varied greatly due to the changes in the heating power in the room's heating circuit. The water content of the lower part of the filling layer was w= 6% and near insulation w = 5.5%. The water content changes of the fill in all three measurement points are shown in Figure 5.35.
The changes in the water content of the fill at the three measurement points are shown in Figure 5.28.
Case study review
Classification of the moisture damages of slab-on-ground structures
Case studies
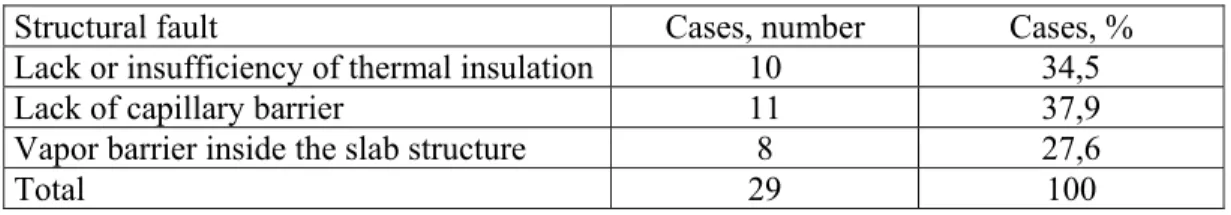
Analysis of the case studies
A vapor barrier is particularly problematic in cases of damage where a pipe leak wets the concrete slab and the barrier is placed under the slab. Excess moisture is now trapped between two high resistance vapor barriers, the floor covering and the vapor barrier under the tile. Often the increase in moisture potential around the slab structure on the ground is due to the ineffectiveness of the drainage layers and pipes around the foundation of the building.
In most cases, more than one individual cause is responsible for exceeding the moisture capacity of the panel construction.
Structural behavior
Limit values for the temperature and moisture design
Temperature and moisture conditions during the lifespan of a slab
The most common cause for the damage condition is a pipe leak in built-in water or sewer pipes. Part of the imported excess water flows downwards by gravity to the subsoil, part remains within the structure through capillary and adsorption forces and slowly dries up through evaporation and diffusion. Again, it must be possible for the excess water in the structure to dry out.
Likewise, the damage condition design ensures that excess water introduced into the structure can escape either to the indoor air, which in practice usually means removing the slab coating during the drying period, or to the subsoil, if it is possible.
Standards for the moisture conditions
Damage control' refers to an unexpected weight increase inside a slab-on-soil structure that raises the moisture content above the long-term phase equilibrium.
Insulation
The Finnish Building Regulation C3 defines the thermal transmission coefficient of the laboratory structure to the ground to be equal to or less than 0.25 W/m2 K. The regulation is based on minimizing energy consumption by minimizing heat flow through the building envelope. This provides a higher slab temperature and lower moisture content than a structure where the insulation is placed on top of the slab.
Vapour barrier
Water vapor permeability of the floor covering
The relative humidity at the underside of the floor covering increases as the diffusion potential, i.e. the effect of the water vapor permeability of the thermal insulation on the relative humidity of the surface structure, increases. Effect of water vapor permeability of the thermal insulation on the relative humidity of the surface structure.
Relative humidity at the underside of the floor covering in different constructions, water vapor resistance of the floor covering is 50*109 m2 s Pa/kg (370*103 s/m).
Design of the ventilated slab structure
TUT Structural Engineering Moisture damage report, structure on the ground Probable cause of failure: Capillary water from the ground rises to the structure. TUT Structural Engineering Moisture Damage Report, Structures on Floor. Probable cause of errors: Floor flooding. TUT Structural Engineering Moisture Damage Card, Slab-on-Ground Structures Probable cause of failure: The ventilation system is not working properly.
TUT Structural Engineering Moisture Damage Report Card, Slab-on-Ground Structures Probable cause of the failures: Pipe leakage.
![Figure 2.1 The average monthly rainfall [mm] 1961-1990 under the climatic conditions of Jyväskylä, Sodankylä and Helsinki /37/](https://thumb-eu.123doks.com/thumbv2/9pdfco/1889864.266030/14.918.164.806.586.998/figure-average-rainfall-climatic-conditions-jyväskylä-sodankylä-helsinki.webp)