The periodic DFT method was found to be a useful tool in modeling D–A copolymers. The dispersion-corrected OT-LRC function gives the best description of individual PSC compounds and their local interfaces.
Research objectives
Thus, the goal was to determine if multi-state treatment would have an effect on the electronic connections of PSC systems relative to 2-state schemes. The aim was also to investigate whether the multi-state FCD scheme is also applicable to NF PSC systems and what is the effect of including dispersion corrections in the electronic coupling values.
Outline
However, none of the schemes for these systems had yet taken into account the multi-state effects. Next, the structural and optoelectronic properties of the individual eD and eA compounds are presented.
Polymer solar cells
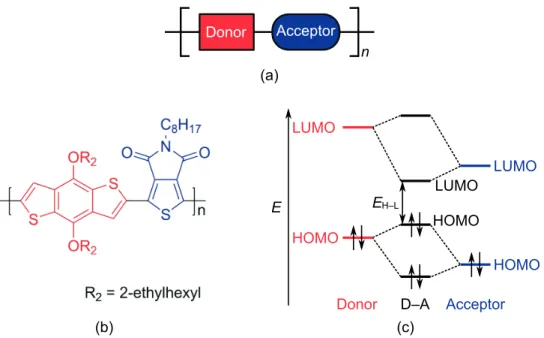
Electron donor materials: conjugated polymers
When considering this concept at the level of one-electron molecular orbitals (MOs), the MOs of the donor and acceptor units. The side chains of the polymer can influence its molecular weight, solubility and processability [59].
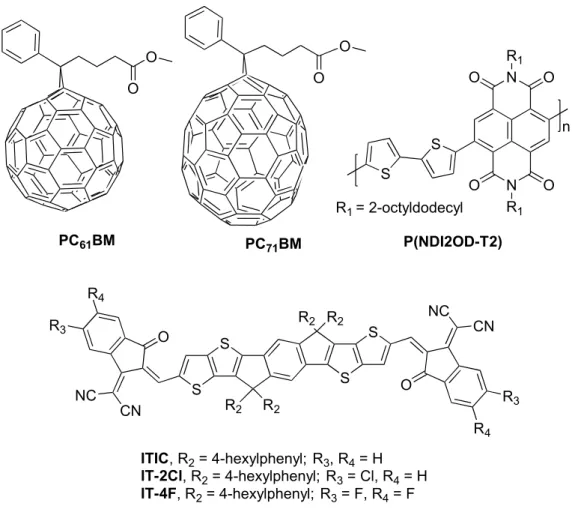
Electron acceptor materials
The advantage of ITIC derivatives is that their optoelectronic properties can be easily tuned by molecular modifications, while retaining their key aspects of efficient eAs. Furthermore, they have strong light absorption, high electron mobility, and good miscibility with eD polymers.
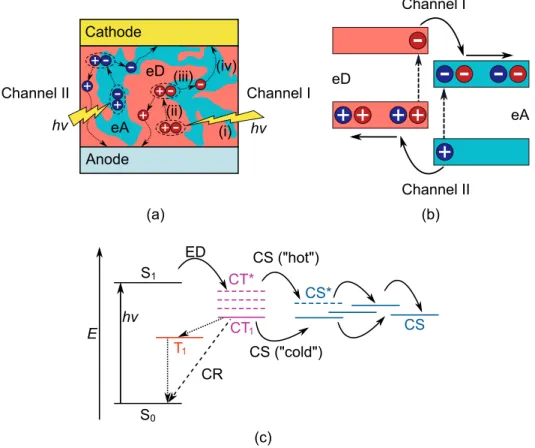
Charge generation in polymer solar cells
The Marcus theory has been applied in several theoretical studies for the calculation of the CT rates of the PSC systems. In the case of the symmetric systems, the simplest approach for the electronic coupling is to calculate it as half.
Density functional theory calculations
Electronic structure and Hartree–Fock theories
It can therefore be assumed that the electrons react immediately to the movement of the nuclei. The Kohn–Sham equations (Equation 2.11) are solved self-consistently by an initial guess of the electron densityρ(r).
Approximations to the exchange-correlation functional
They must therefore be taken into account in the calculations of the eD–eA interface complexes. In the latter case, the general form of the total energy obtained with this kind of DFT-D scheme is [31].
Models
Electron donor compounds
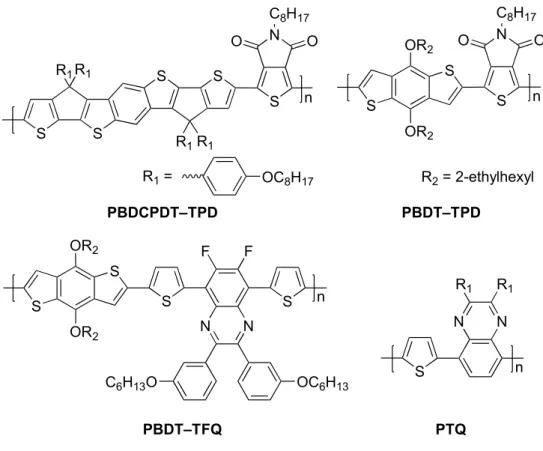
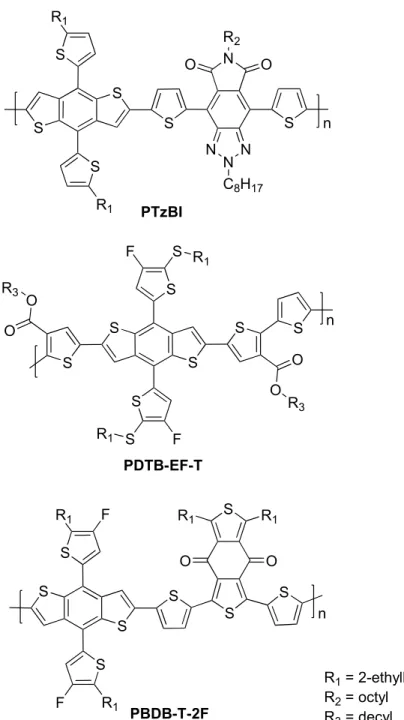
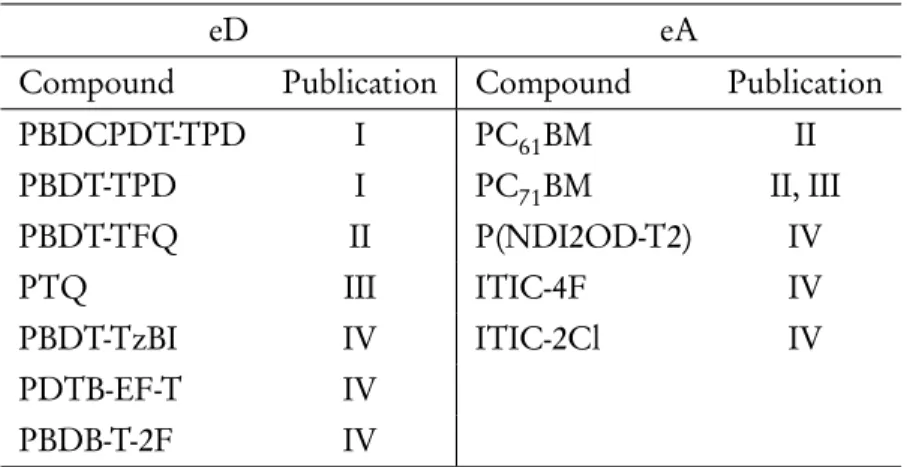
Section 3.1 presents the models of the isolated compounds eD and eA and their interfacial complexes. For example, the term BDCPDT-TPD will be used for theoretical models of the PBDCPDT-TPD copolymer.
Electron acceptor compounds
However, those conformations of PBDCPDT-TPD and PBDT-TPD, which had arcuate backbones, did not converge due to the incorrect repetition of the repeating unit. The oligomeric and periodic models of the studied D–A copolymers will be referred to as the acronyms presented in Table 3.1, but without the letter "P", which will only be used when referring to the actual polymers.
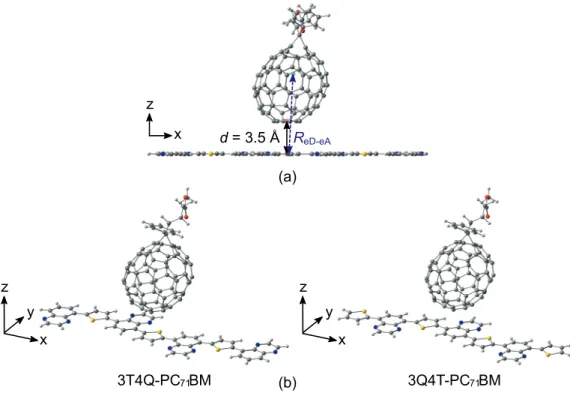
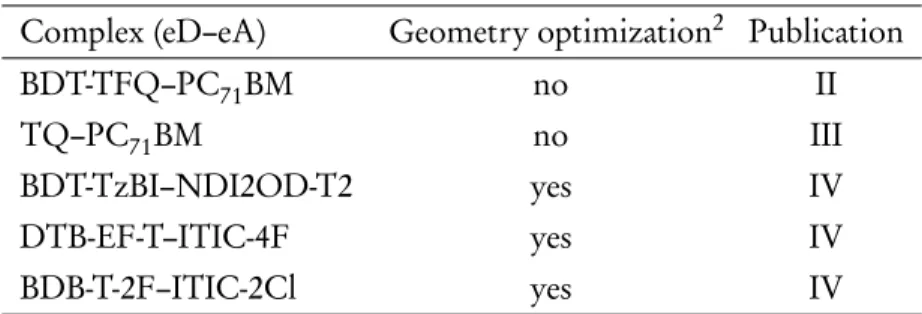
Local interfacial eD–eA complexes
The centers of mass of specific rings (pink spheres) and those of compounds (green spheres) are determined, respectively. Similarly, those where the acceptor unit of compound eA is ultimately closer to the acceptor unit of compound eD are referred to as "AA" configurations.
Computational details
- Ground state calculations
- Excited state calculations
- Optimal tuning of long-range corrected functionals
- Solution and blend environments
- Extrapolation techniques
- Calculation of charge transfer rates
For the eD–eA complexes, the modified version[162] of the gap tuning procedure was used:. 3.2) whereεωHOMO(N) and IEω(N) are respectively the HOMO energy and the (vertical) IE of the neutral eD, andεωHOMO(M+1) and IEω(M+1) are the HOMO energy and the (vertical) IE of the anion of eA or Similarly to the previous studies of the PSC systems, Weller's equation[171] was used to calculate ∆G◦ from the energies of the individual eD and eA compounds, while the Coulombic attraction (∆ECoul) between their charged states were taken into account[91, 167].
In the limiting case of the 2-state GMH scheme, the coupling between initial and final charge is localized, i.e.
Optimally tuned range-separation parameters
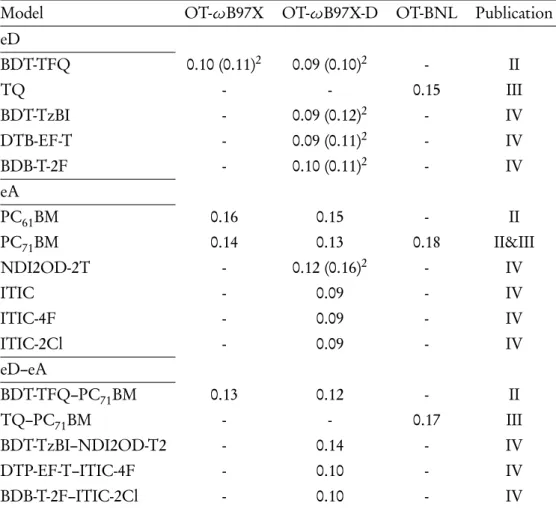
1 The OTω values of individual compounds and complexes were obtained using equation 3.1 and equation 3.2, respectively. In OT-ωB97X and OT-ωB97X-D, the OTω values for oligomers of eD D–A copolymers are generally the same, indicating a similar extent of π-conjugation in their backbone with characteristic length scales (1/ω) [173]approx. The OT ω values determined for the eD–eA complexes are in between those of individual molecules, although they are somewhat closer to those of the eA compounds.
Another shortcoming of OT-LRC functionals is the failure to couple the ω setting to the continuum solvation model [163] .
Structural properties of polymer solar cell compounds
Ground-state structural properties
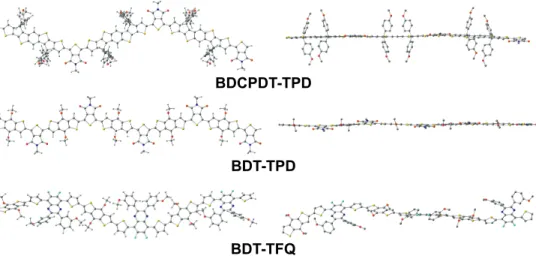
Indeed, among the compounds studied, the geometries of GS oligomers D–A have different shapes and degrees of curvature (Figures 4.1 and 4.2). The GS BDT-TPD geometry predicted here is in agreement with previous theoretical studies of the same compound [8, 9]. Backbones of eD-type oligomers consisting of additional thiophene spacers between the donor and acceptor units, i.e.
Similar trends in the effect of the functional on the dihedral angles and BLA values have been predicted by Niskanen and Hukka[14].
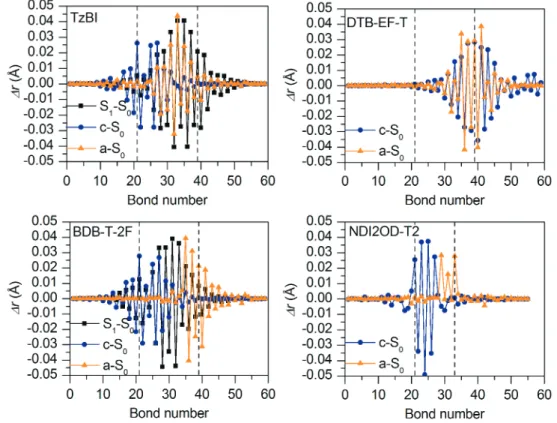
Structural changes induced by ionization and excitation
The regions corresponding to the middle CRUs (or middle donor and acceptor units in the case of NDI2OD-T2) are marked with the dotted lines in the graphs. In DTB-EF-T, both oxidation and reduction cause the largest changes mostly in the substituted (i.e. acceptors) and unsubstituted thiophenes, while the BDT donor units are only rarely affected. In the eA compound NDI2OD-T2, oxidation and reduction cause similar changes in the bond lengths as for BDT-TzBI and BDB-T-2F, namely the oxidation takes place in the thiophene donor units and reduction in the NDI acceptor unit (with additional thiophene -units).
For BDCPDT-TPD and BDT-TPD, B3LYP predicts that the largest structural changes upon excitation to the S1 state occur in the middlemost unit of the donor and acceptor, where relaxation to the T1 state is more localized in the donor units.
Oligomeric versus periodic approaches
The extrapolations to the infinite chain lengths were performed with the linear (dashed lines), Kuhn (solid lines) and scaled Kuhn (dashed lines) fits. For both compounds, the linear fit slightly overestimates the HOMO energies and underestimates the LUMO and HOMO-LUMO gap energies compared to the periodic values. The LRC functional CAM-B3LYP predicts the same trends, although the HOMO energies are energetically-destabilized and the LUMO energies are energetically-stabilized with respect to the B3LYP values, leading to the notable larger gap values.
In Publication I, the oligomeric and periodic HOMO and LUMO predicted for BDCPDT-TPD and BDT-TPD are also observed to be similar, but due to the absence of the chain-end effects in the periodic models, the periodic HOMO and LUMO are delocalized along the entire backbone, where the oligomeric is located mostly on the middle CRUs.

Optoelectronic properties of polymer solar cell compounds
Electronic properties
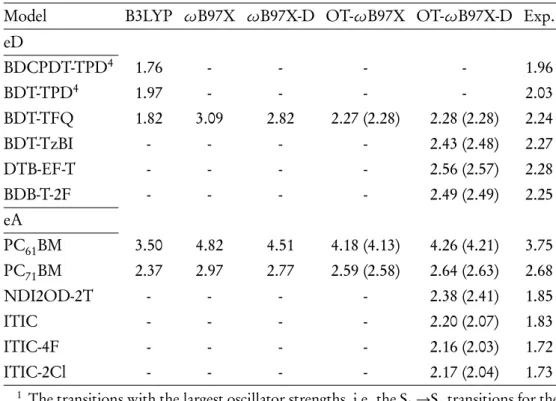
In publications I and II, the HOMO, LUMO and HOMO-LUMO gap energies of the oligomers of the D-A copolymers used as the eD linkages in the polymer-fullerene systems have been investigated. The FMO energies and HOMO-LUMO gaps of the PSC compounds calculated by DFT are usually compared to the experimental values derived from the oxidation and reduction potentials determined by electrochemical, e.g. Similarly, in publication IV, the IEs of the eD and eA compounds used in the NF-PSCs are close to the experimental values.
This may be due to the inaccuracies in deriving EA from the IE of the anionic system (see Equation 3.1).
Vertical excitation energies and absorption spectra
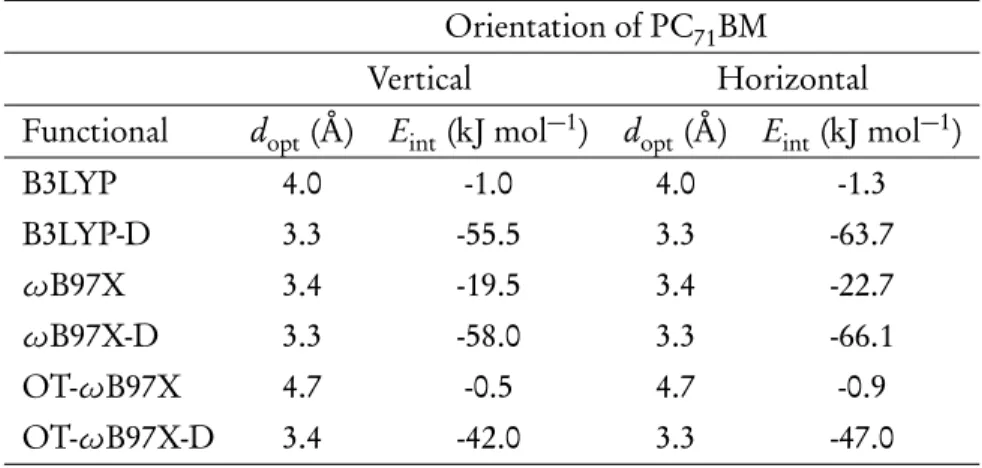
In Publication II, it is observed that for PC71BM, OT-ωB97X-D gives the functional HOMO energy (-7.05 eV) closest to the (negative of) experimental IE determined in the gas phase by ultraviolet photoelectron spectroscopy[185]. The global hybrid functionals provide the destabilized HOMO for PC71BM, whereas the untuned LRC functionals provide stabilized HOMO compared to the experiments. However, as observed for the excitation energies reported in Table 4.3, the functional has a large effect on the relative position of the spectra with respect to the experiments[143].
As observed for the S0→S1 excitation energies predicted by different functionals in Table 4.3, OT-ωB97X and OT-ωB97X-D give the spectra closest to the experimental one.
Intramolecular charge transfer in the donor–acceptor copoly-
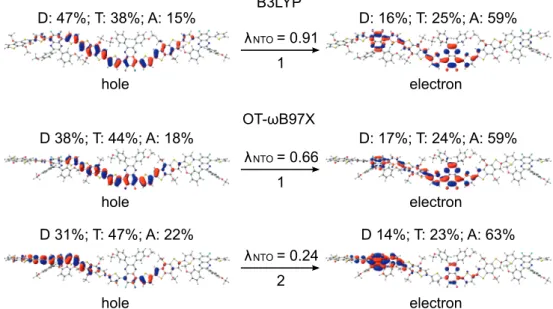
The amount of charge density transferred from donor units and thiophene to acceptor units is somewhat larger in BDT-TzBI (about 30 percentage points, i.e. pp) than in BDB-T-2F (16 pp). In general, the LRC functionals tend to give a somewhat different description of the NTOs of the S0→S1 transitions of D–A oligomers compared to the hy- global ones. However, the overall contributions of the backbone units to the main NTOs are close to those predicted by B3LYP.
In the case of the eD BDT-TFQ oligomer, the OT-LRC functionals also give the similar CT character for the NTO head pair of the S0→S1 transition as B3LYP (1 in Figure 4.7).
Local interfacial eD–eA complexes
Structural characteristics of eD–eA complexes
1 The results are only for the complexes, where PC71BM is on top of the acceptor unit of BDT-TFQ. In publication II, all functionals are observed to predict the smallest intermolecular distances and largest interaction energies, when PC71BM is on top of the quinoxaline acceptor unit of BDT-TFQ. In publication IV, the DA configuration of DTB-EF-T–ITIC-4F, where the electron-withdrawing end-group of ITIC-4F is located at the top of the BDT donor unit of DTB-EF-T, is predicted to be the more energetically favorable configuration than the AA configuration.
In the AA configuration, the end group of ITIC-4F has initially been placed on top of the acceptor unit, i.e.
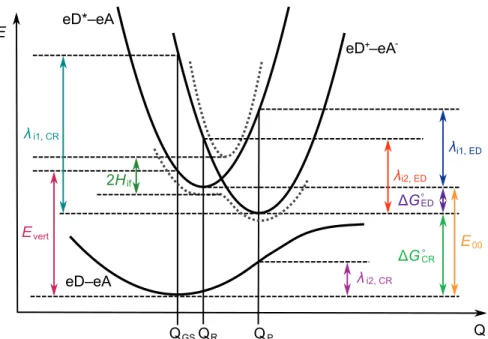
Nature of the excited states in the eD–eA complexes
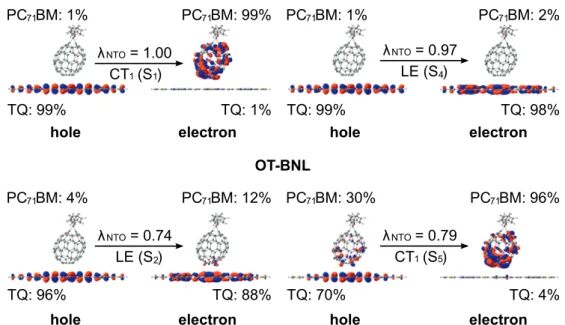
In the polymer-fullerene system BDT-TFQ-PC71BM, the tuning of ω seems to affect the appearance of the CT states, since the corresponding untuned LRC functionals ωB97X and ωB97X-D do not predict any CT states below the ten lowest excited states . The intermolecular distance also plays a particular role on the appearance of the CT states for BDT-TFQ–. In the case of the studied NF PSC systems, OT-ωB97X-D predicts the same order of the states as the global hybrids do for the polymer-fullerene systems, i.e.
As with the polymer-fullerene systems, a small amount of a local excitation of the eA compound NDI2OD-T2 is mixed with the CT1 state in the polymer-polymer system BDT-TzBI-NDI2OD-T2 (the AA(1) configuration, figure 4.9 ).
Calculating the charge transfer rates at local eD–eA interfaces
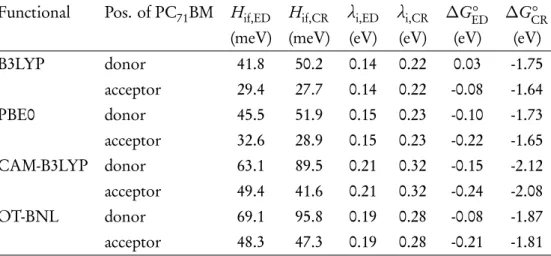
Electronic couplings with the multi-state treatments
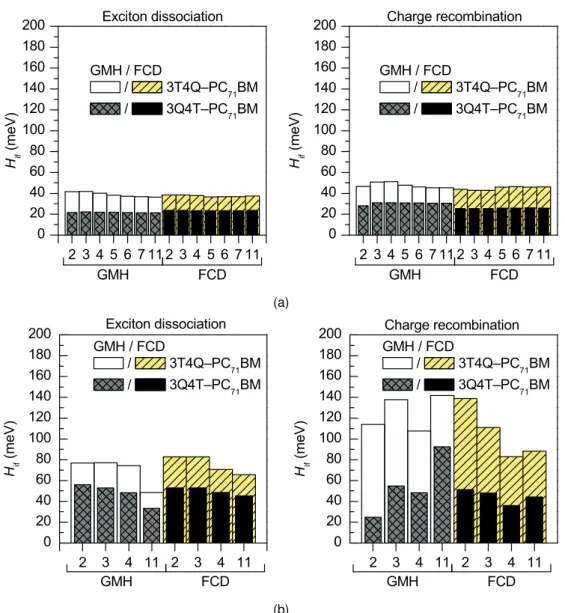
However, with the LRC, CAM-B3LYP and OT-BNL functionals (Figure 4.11b), the number of states has a more pronounced effect on the electronic couplings. Both ED and CR couplings calculated with the FCD scheme and OT-ωB97X-D are very constant regardless of the number of states. It is well known that electronic couplings are very sensitive to the relative orientations of the studied compounds.
In the case of the polymer SMA systems, the strongest electronic couplings are predicted for the most stable, i.e.
Charge transfer parameters and rates
The syn conformations of the O1 (Table S4, SI) and O2 (Table S5, SI) oligomers are the most energetically stable. BLAs of the oligomers (n= 3−5), the values are close to those of the periodic models (see Table S6, SI). In the models, PC71BM (eA) is positioned vertically on the donor (1a), thiophene spacer (2a) or acceptor (3a) unit of the flattened O3p trimer model (eD) of the D-A copolymer.
Moreover, the interaction between the acceptor unit of the copolymer and PC71BM (3a and 3b) is predicted to be the strongest (except with oB97X for 3a). In the horizontal model 3b, the extent of CT predicted by B3LYP (6 percentage points) is quite negligible. In addition, the contributions (%) of TQ and PC71BM to NTO and the contributions (lNTO) of a pair of NTOs to a given state are presented.