The purpose of the work was to understand the effects of the studied buffers and active layer materials on cell performance and photovoltaic properties. Simo Ali-Löytty for his advice on the statistical analysis of the solar cell results. The comparison of organic cells is based on the cell's power conversion efficiency and photovoltaic parameters.
Structure of the inverted organic solar cell
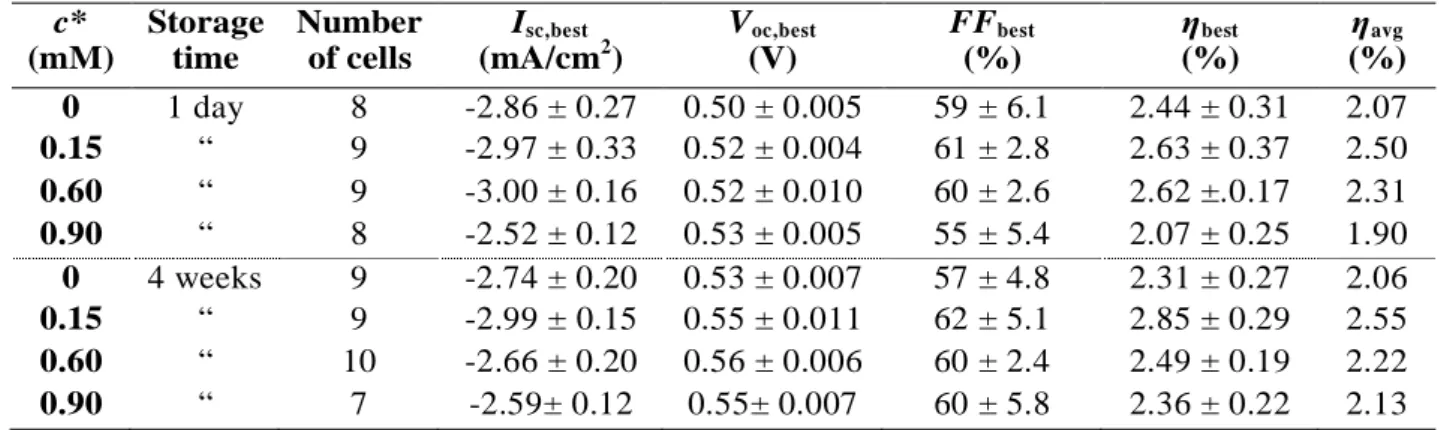
This chapter first introduces the structure and function principles of the inverted organic solar cell configuration used in this work. In this work, standard deviations of the measured photovoltaic parameters are presented to demonstrate their variation. At the end of this chapter, the typical variation of the parameters between solar cell samples is shown by an example table.
Function principles of the inverted organic solar cell
If the exciton reaches the interface of the donor and acceptor material during its lifetime, the positive and negative charges are separated (Figure 2.2). If the exciton reaches the donor-acceptor interface, the Coulombic binding energy must be overcome by the differences in the chemical potentials of the donor and acceptor materials to separate the hole and electron. Migration of the separated charges to the electrodes is also highly dependent on the morphology of the interpenetrating network of donor and acceptor phases in the BHJ layer.
Photovoltaic parameters and cell efficiency analysis
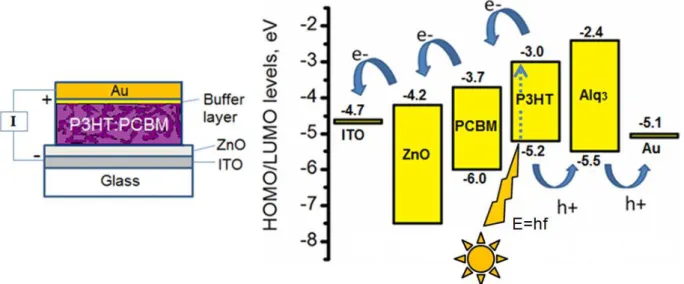
Therefore, the lifetime ( ) of the excited state partly limits the diffusion length of the exciton. The photovoltaic parameters are obtained and calculated from a current-voltage (I-V) curve, which represents the current produced by the cell as a function of a voltage applied to the cell. I-V curves of the inverted ITO |ZnO|P3HT:PC60BM|Alq3 |Ag cell in the dark (dashed red curve) and under illumination (solid black curve) are shown together with photovoltaic parameters in Figure 2.4a. An external photon-to-current efficiency (EPCE) spectrum presents the current produced by the cell as a function of the illumination wavelength.

Experimental variation of the photovoltaic parameters
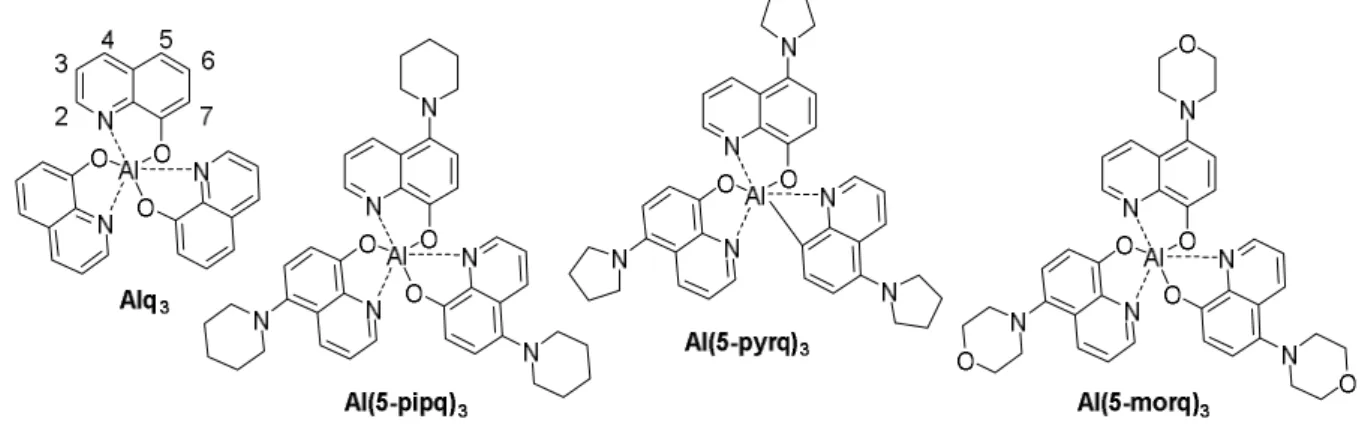
The typical experimental variation of the photovoltaic cell structure parameters used in this work is less than 10% of the measured values. Numbering of possible substituent positions is shown around the 8-hydroxyquinoline ligand in parent Alq3. The properties of the derivatives were intended to reduce the hole extraction barrier when used as anode buffer layers in an inverted organic solar cell structure.
Conjugated benzodithiophene/fluorine-benzotriazole donor-acceptor (D-A) copolymers
Aryl, Alq 3 , and 8-phenoxyquinoline end-capped oligothiophenes
In this work, four different aryl-end-capped quaterthiophenes, 3a, 3b, 4a and 4b (Figure 3.3) and an Alq3-end-capped hexathiophene, (Alq3)2-OT (Figure 3.4) were used as anode buffer layers in the inverted organic material. solar cell structure.III,IV The p-type aryl-end-capped materials, together with then-type 5-amino-substituted Alq3 derivs., and combined p- and n-type (Alq3)2-OT, provided a diverse selection of buffer material. 4b was compared with DPP-(2TPhCN)2 as electron donor material and additional dopant molecule mixed with P3HT and PC60BM (Figure 3.5) in the BHJ photoactive layer of the cell. V The effect of the DPP group in the properties and function of p-cyanophenyl-end-capped oligothiophene- doping material was investigated. 8-phenoxyquinoline end-capped hexathiophene, compound 5 (Figure 3.4) and Alq3 (Figure 3.5) were used as reference materials in the solar cell and spectroscopic studies of (Alq3)2-OT.

Photoactive layer components P3HT, PC 60 BM and PC 70 BM
The purpose of the doping experiments was to understand the effect of the dopant molecules on cell performance and photovoltaic performance. Spectroscopic studies of the interaction of dopant molecules with P3HT and PC60BM were performed using steady-state and time-resolved spectroscopic methods.
Solar cell preparation and analysis
The studied oligothiophenes were synthesized in the Department of Chemistry, University of Oulu. rpm) in the spin coater under N2 flow. The cells were kept in the ambient atmosphere in the dark prior to measurements and analysis. A voltage between -0.2 and 0.6 V was applied in steps of 10 mV and the measurements were performed in air at room temperature (20°C) without encapsulation of the devices.
Steady state absorption and fluorescence measurements
The evaporation rate and film thickness were controlled by evaporator crystals to deposit the desired buffer thickness and a 50 nm thick metal anode layer on top of the photoactive layer. Illumination was produced with a filtered Xe-lamp (Oriel Corporation & Lasertek) in a solar simulator (Zuzchem LZC-SSL). However, the reported efficiencies and relative changes in efficiency are comparable within the devices presented.
Time resolved fluorescence and absorption measurements
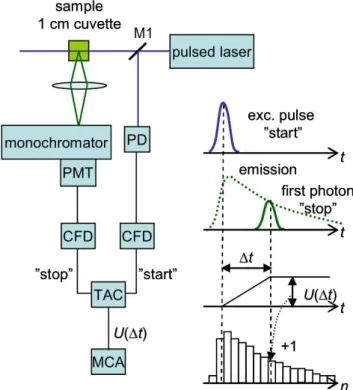
TCSPC
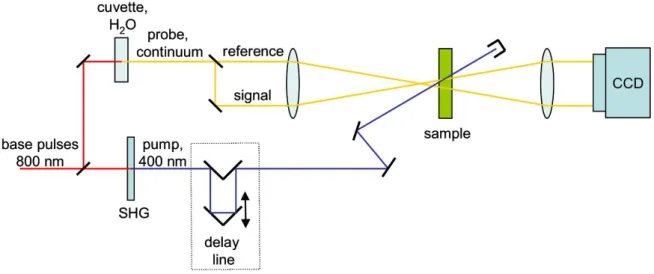
Pump-probe
The pump beam is passed through a delay line with a moving angled reflector, which is used to match the optical path of the pump pulse relative to the probe pulse, and is focused on the signal beam in the sample cell. The transient species formed after excitation of the sample are identified from the detected absorbance changes. The raw data obtained from the measurements consists of the differential transient spectra with different delay times.
Differential pulse voltammetry (DPV)
Optical profilometry
Differential scanning calorimetry (DSC)
The results of transient absorption measurements are presented III,V as decay component spectra, where the amplitude of each component is shown as a function of wavelength. The temperature program of the DSC instrument increases the temperature of the sample holder linearly with time. A thermoanalyzer (Mettler Toledo DSC821e) was used for DSC measurements to analyze the thermal properties of the compounds. I-IV The crystallinity and thermal stability of the samples were determined based on observed glass transition rates, endothermic melting peaks or exothermic decomposition and oxidation signals.
Computational modelling
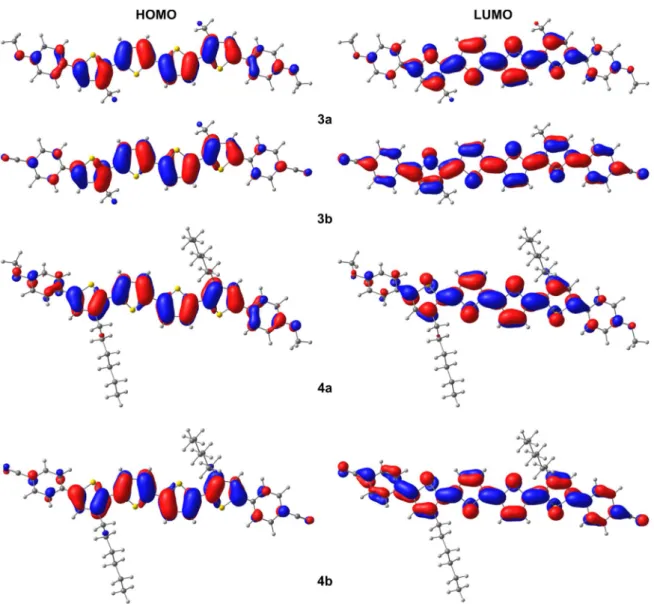
The effect of the used buffer material on the solar cell performance is rationalized by means of their HOMO and LUMO energy levelsI,III,IV relative to that of the cell structure. The distributions of the calculated molecular frontier orbitals provided additional understanding about the buffer properties. IV The possible photoactivity of the buffer layer is also considered. The effect of the dopant molecules on the cell function and efficiency is discussed on the basis of the performed spectroscopic measurements.
Solar cell experiments varying the hole transporting buffer layer material
Organometallic 5-amino substituted Alq 3 derivatives as buffer layers
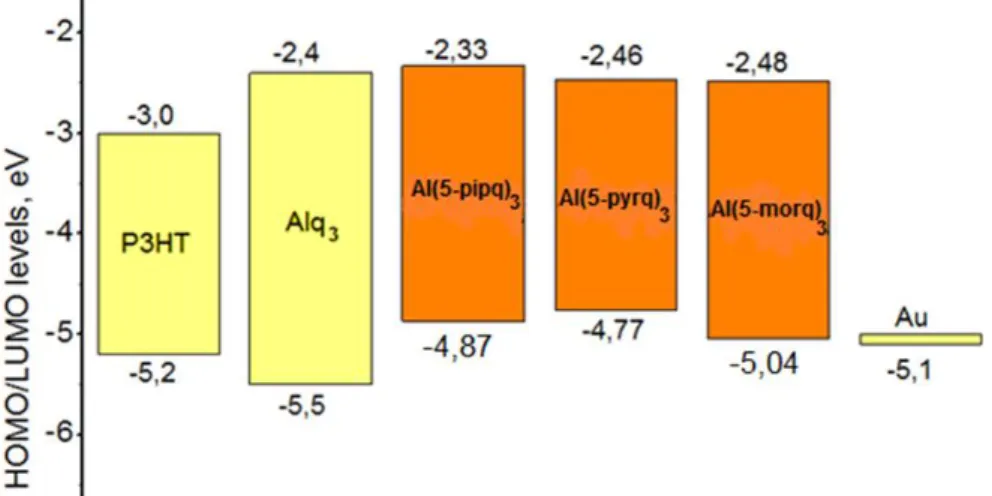
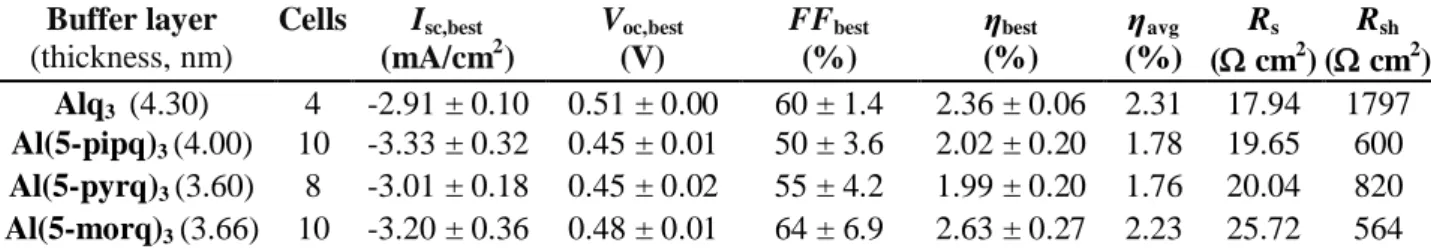
The energy levels of parent Alq3, 5-amino substituted derivatives, and adjacent P3HT and Au are shown in Figure 4.2. The difference between the HOMO of P3HT and that of the buffer layer affects the cell Voc. An extraction barrier for photogenerated holes to escape the cell is created if the HOMO of the buffer material is lower than that of P3HT.
Alq 3 and aryl end-capped oligothiophenes as buffer layers
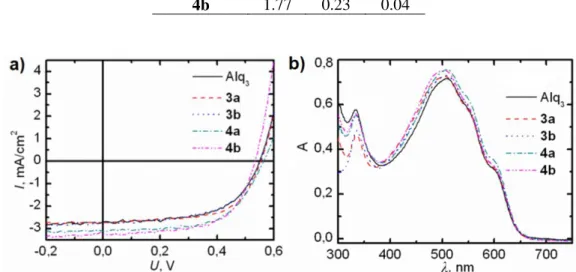
The cellular absorption spectra (Figure 4.3) show no increased cellular absorption at 430 nm, where the derivatives absorb. Thus, the effect of photoinduced reactions is considered to be smaller than the effect of energy level alignment even in the case of derivatives. As the cells were measured again 4 weeks after cell preparation, the efficiencies of the best cells with (Alq3)2-OT buffer layers were better than those of the reference cells.
The energy levels of (Alq3)2-OT are conveniently aligned with those of the cell materials (Figure 4.5). This may explain the reduced Rs values of the cells with (Alq3)2-OT compared to those with Alq3. The photovoltaic parameters for the cells using aryl-end-capped quaterthiophenes as anode buffer layers are in Table 4.5.
The photoactivity of aryl-terminated buffer layers is possible because the absorptions of cells with aryl-capped quaterthiophenes as buffer layers are increased compared to the reference cell with Alq3 as buffer layer (Figure 4.6b). In addition, the lifetimes of the excited state in the solid films of the derivatives do not differ significantly (Table 4.6). This red color shifts the absorption of end-capped p-cyanophenyl quaternarythiophenes relative to p-methoxyphenol quaternarythiophenes.
This could further explain the increased Isco of the cell with 4b buffer layer along with the optimal energy levels of the molecule.

Conjugated benzodithiophene/fluorine-benzotriazole donor-acceptor (D-A) copolymers as
- Solar cell experiments using P1-P4 as donor materials
- Modelling of the D-A copolymers
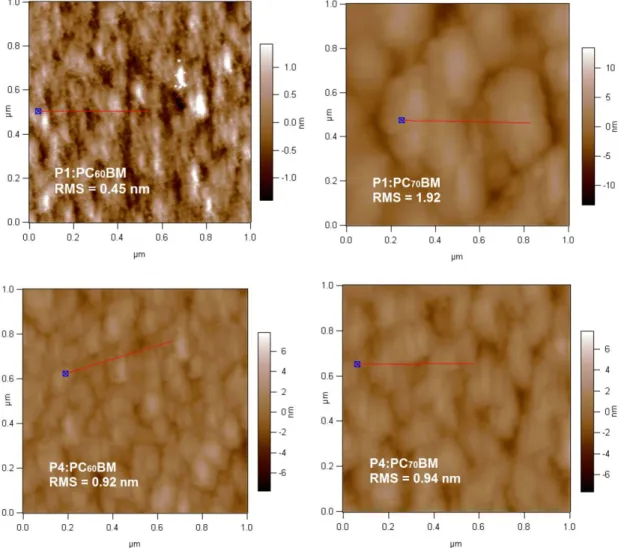
- AFM images of the P1/P4 and PC 60/70 BM photoactive layers
- Computed polymer-PC 60/70 BM interactions and their relation to the solar cell
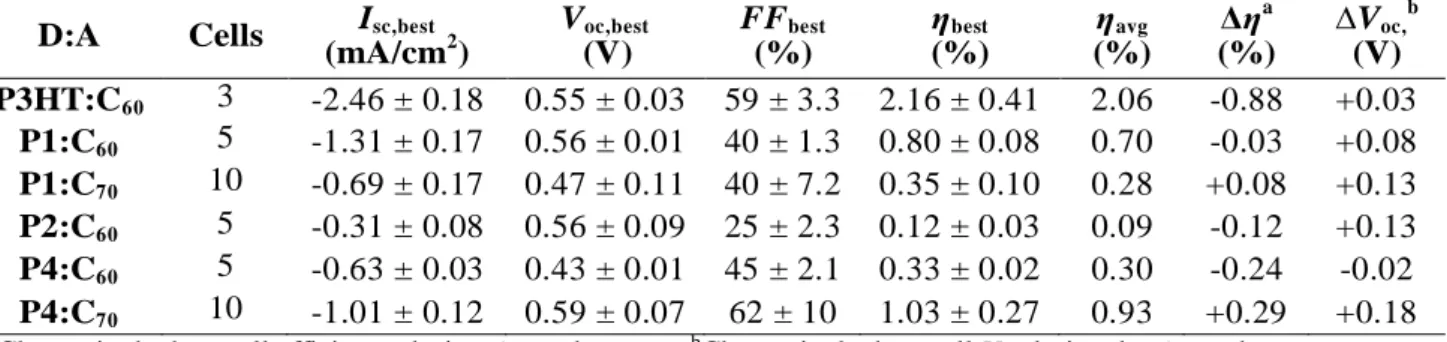
The vocal values of P1 and P4 donor cells differ with the acceptor material used, PC60BM or PC70BM. The methyl substituents of the two 3-methylthiophene rings in CRU widen the backbone dihedral angles at P2 and P3, which prohibits planarity. As a result, the -conjugation is weakened or broken at several points in the backbones of polymers P2 and P3.
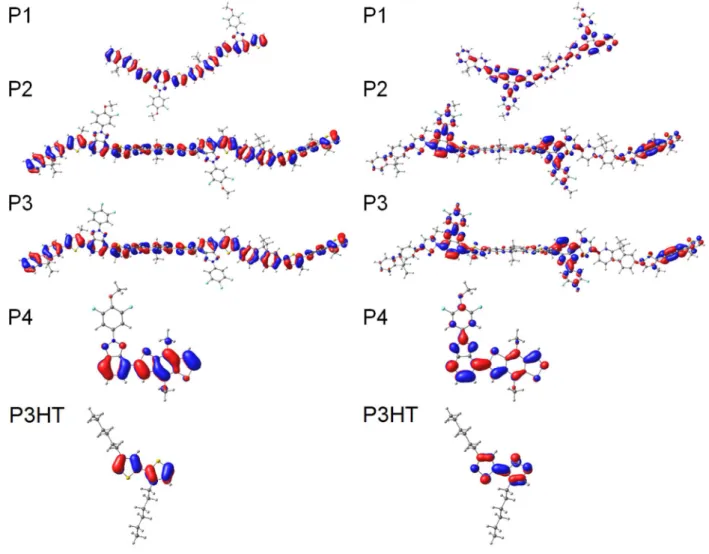
The backbones of P2 and P3 are helical due to the steric hindrance of the hexyl chains attached to the thiophene rings, which weakens the conjugation to the polymer backbone. A more planar structure of P4 compared to those of P1-P3 is due to the absence of thiophene moieties in the polymer backbone. Therefore, the exciton diffusion effectiveness in the excited state of polymers can be compared based on molecular frontier orbitals.
LUCOs of P2 and P3 are strongly located in the benzotriazole moieties of the polymer backbone and the orbitals are not contiguous. A rough insight into the active layer morphology was obtained through the AFM images of the cells (Figure 4.14). The energy levels of the combined models were compared with the energy levels of the isolated monomers and PCBMs.
The largest changes in energies were observed for the model consisting of monomer P4 and PC70BM (Figure 4.16).
Oligothiophenes as dopants in the P3HT:PC 60 BM BHJ photoactive layer
In chloroform, in the presence of the acceptor PC60BM (Figure 4.28b), there are no noticeable changes in the spectra. The absorption of the dopant molecules DPP-(2TPhCN)2 covers a wider range of wavelengths than the absorption of di-(p-CNPh)4T. Intermolecular interactions of P3HT and PC60BM molecules are likely in the ternary dopant mixture.
3 Energy level diagram of donor molecules (red), acceptor molecules (blue), buffer layer materials (green) and electrodes (green) used in the organic. The largest changes in energies are observed in the model consisting of the P4 monomer and PC70BM. The exciton diffusion efficiency, i.e. the velocity of the exciton, together with the lifetime, defines the diffusion length.
The carrier transport in ETM and HTM controls together with the morphology of the phase-separated network. The series resistances (Rs) and shunt resistances (Rsh) of the cells were calculated (see ESI, Table S2†) as explained in The changes in the morphology of the active layer also cause changes in the HOMO and LUMO levels of the donor and acceptor.
To better understand the possible charge transfer in the molecule, the energy levels of the compounds shown in the figure. The behavior of the molecules in the presence of the quenching molecule, PCBM, was investigated by additional steady-state measurements. The energy levels of (Alq3)2-OT are well matched to those of the other materials used in the cell.
7 Energy levels6,14 of the solar cell structure and the HOMO and LUMO levels of (Alq3)2-OT. 8 Absorption spectra of the reference cell without doping and cells with (Alq3)2-OT as a dopant in the BHJ layer.