In addition, the majority of postoperative ischemic events are asymptomatic, thus further emphasizing the importance of ECG monitoring. I want to thank my Engineering manager Rene Coeng for giving me this great opportunity to work on this project and to be part of the study group that conducts the clinical study.
Introduction
It is evident that new trends in long-term health care, and therefore patient monitoring, are transforming towards a more wireless environment. Advances in other areas of technology have enabled the healthcare industry to look to wireless solutions as well, but this new monitoring environment presents several challenges.
Theory and Backround
Anatomy and Physiology of the Heart
- Coronary Circulation
- Electrophysiology of Myocardial Cells
- Conduction of Action Potential
Anatomy and Physiology of the Heart 5 During ventricular diastole, blood enters the right ventricle through the tricuspid valve. The LCX continues to the left along the coronary sulcus to the posterior side of the heart.
![Figure 2.1 Cross-section of the dierent layers of the heart [9]](https://thumb-eu.123doks.com/thumbv2/9pdfco/1890014.266180/17.892.233.713.151.479/figure-cross-section-dierent-layers-heart.webp)
Electrocardiography
- Theory of ECG
- Formation of ECG
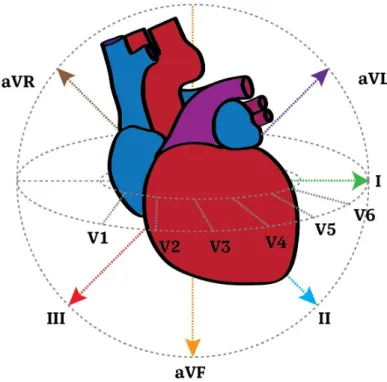
- Standard 12-lead ECG
- Holter ECG Monitoring
For depolarization, the polarity of the dipole is to the direction of the propagating depolarization wave. The mean electrical axis of the heart is the total sum of all electrical vectors generated in the heart.

Myocardial Ischemia and Infarction
Pathology and Risk Assessment on Myocardial Ischemia and Infarction 19
- Criteria for Diagnosis Myocardial Infarction
- Risk Assessment and Literature Review on Postoperative MI
Pathology and risk assessment of myocardial ischemia and infarction 20 reversible or not and what is the mechanism of the possible restoration of myocardial function. The criteria for diagnosing myocardial infarction are based on the detection of cardiac biomarkers above a significant value in the setting of myocardial ischemia. The most common symptoms of myocardial ischemia are chest pain (angina pectoris) radiating to the left arm (in men) and lower jaw, nausea, shortness of breath (dyspnea), and palpations.
Perioperative myocardial ischemia has been under surveillance for more than 30 years, and especially postoperative ischemia after major non-cardiac surgery has been strongly associated with increased 30-day mortality, mainly from myocardial infarction [11]. Pathology and risk assessment for myocardial ischemia and infarction 22 Table 3.1 Cardiac assessments for special operations [47]. The Lee index was validated with patient data from the early 1990s, which represents a weakness of the index.
There are two main mechanisms that can lead to an infarction by preceding myocardial ischemia.
Ischemia Detection: Eect on ECG Waveforms
- Serial ECG Changes of Evolving MI
- The Location of the Infarction Based on the ST-segment
- Primary and Secondary Repolarization Abnormalities
- ST-segment Criteria for MI
In the acute phase, the amplitude of the terminal portion of the T wave and the initial portion of the QRS complex begins to decrease. Identifying the location of the myocardial infarction based on the ECG helps to treat the patient at an early stage and is therefore important. The size and displacement of this vector is again related to the severity and location of the occlusion.
Ideally, the ST segment of the ECG waveform lacks significant potential differences and is thus in For example, myocarditis, toxins, pericarditis (infection of the heart muscle), and electrolyte imbalances can affect the shape and duration of repolarization. Depending on the area and location of the ischemic region, different ECG leads show ST elevation or depression.
In addition, the morphology of the QRS complex has special characteristics in the case of leg blocks.
Clinical Signicance and Adoption of Ischemia Monitoring
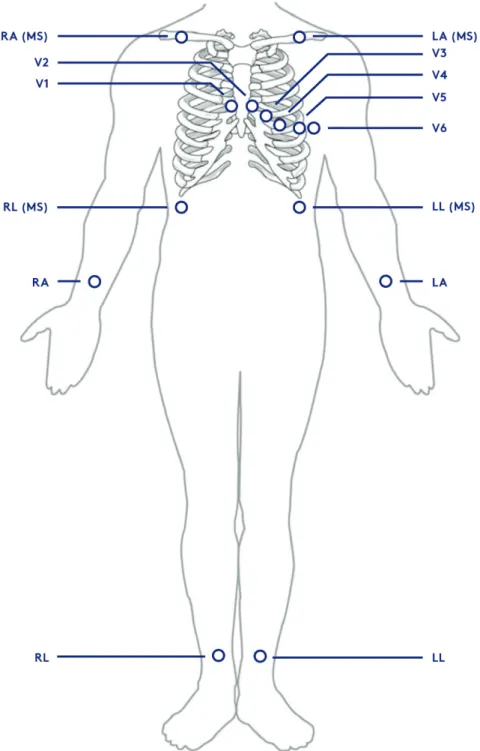
- Optimal Lead Selection of Ischemia Monitoring
- Continuous Wireless Patient Monitoring
- Secondary Repolarization Abnormalities as a Source of False Alarms 35
They recommend that a 12-lead ECG be used whenever possible, but prefer V3 and III leads first if there are fewer leads. At single-lead sensitivity, V2 detected the majority of ischemic events in the 3-lead system, whereas V2, V3, and V4 were equally sensitive in the 12-lead system. The main area of interest for the ECG waveform was the QRS complex and the ST junction.
According to the studies, an ST segment deviation of more than 1 mm can be caused by a change in posture, and these changes were only seen in the precordial leads in the studies. Position changes in the QRS complex were also studied and a significant portion of the population had some changes in their QRS complexes. Similarly, the inconsistency of electrode placement upon removal and reattachment may cause potential ST segment deviation unrelated to cardiac perfusion and in the case of ischemia monitoring, the accuracy and consistency of electrode placement is important.
Yet the prognosis of patients with RBBB has been demonstrated to be independent of onset [14].
Study Population
The data used in this thesis was collected in a hospital study conducted in collaboration with Helsinki University Central Hospital (HUCH). The aim of the study was to gather more information on the prevalence of PMI and whether the onset of ischemic episodes potentially progressing to PMIs should be continuously monitored, the susceptibility of the conventional leads to ischemia, and how well continuous ECG monitoring is performed. monitoring detects PMI events compared to snapshot EKGs taken in the morning. Besides these questions, this thesis discusses the general development of ischemia monitoring and wireless patient monitoring.
With these goals in mind, an MI data utilization tool was developed along with measures aimed at facilitating the utilization of the data and examining the detection sensitivity of real ischemic events in the context of cardiac comorbidity and wireless monitoring.
Data Collection and Processing
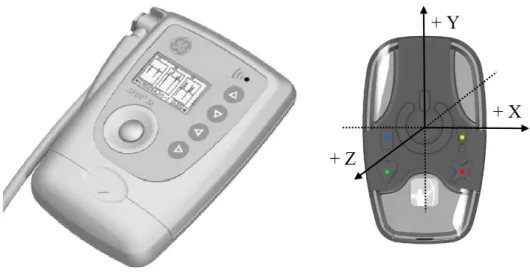
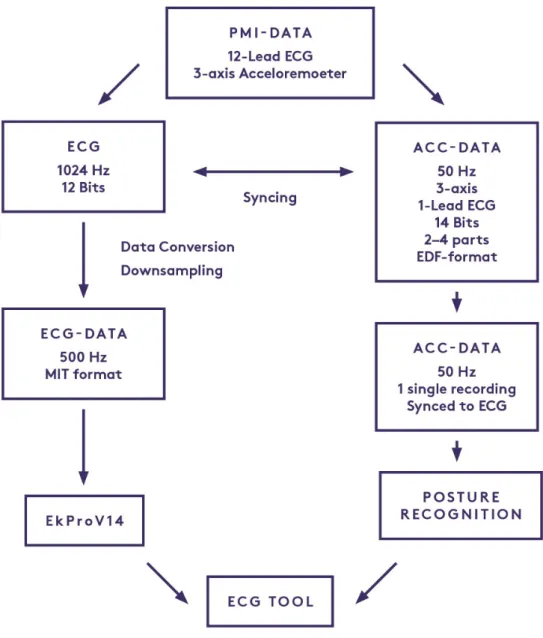
The device was set to measure acceleration with a sampling frequency of 50 Hz and 1-channel ECG with a sampling frequency of 250 Hz, although these data were not used in the scope of this thesis. Due to the insufficient battery life of the Faros device, 2-4 separate measurements were taken per patient. Due to the separate devices that record the ECG and the orientation, a manual time synchronization of the two measured signals (ECG and acceleration) was done.
The nurses performing the measurements were instructed to make a marker on both recordings simultaneously at the start of the measurement and at each reconnection of the device after a snapshot ECG. Furthermore, the orientation of the Faro on the patient's chest was illustrated on a paper form, as the optimal vertical position of the device was not always possible due to skin irritation or anatomical reasons. This was done so that the axis of measurement and the orientation of the device on the patient's chest could be corrected before postural classification.
In this thesis, the initial processing of the ECG signal was performed by GE's EK-Pro version 14 [67].
Data utilization and analysis
These different episodes have been further combined into so-called 'Combined Episodes' to give an overall view of a more realistic number of episodes regardless of benchmarks that don't fill up continuously in the meantime. The incidence of ischemic leads from each of the combined ischemic episodes was calculated if the lead was ischemic within the first 15 minutes of the episode. The incidence of ischemic leads from each patient's first ischemic episode was calculated if the lead was ischemic within the first 5 minutes of the first episode.
In how many patients was a lead ischemic seen, regardless of the time or duration of the episode. For each lead, the ischemic burden was calculated as the product of the ischemic time and the corresponding depth of the ST depression during that time. The performance of the continuous wireless monitoring was assessed based on the overall data quality of the collected data as well as how well and how quickly it detected ischemic episodes compared to the diagnostic snapshot ECGs.
The detection of the first ischemic episode is of particular interest, as it has the greatest impact on the timing of treatment.
Results
Data Utilization With Custom Tool
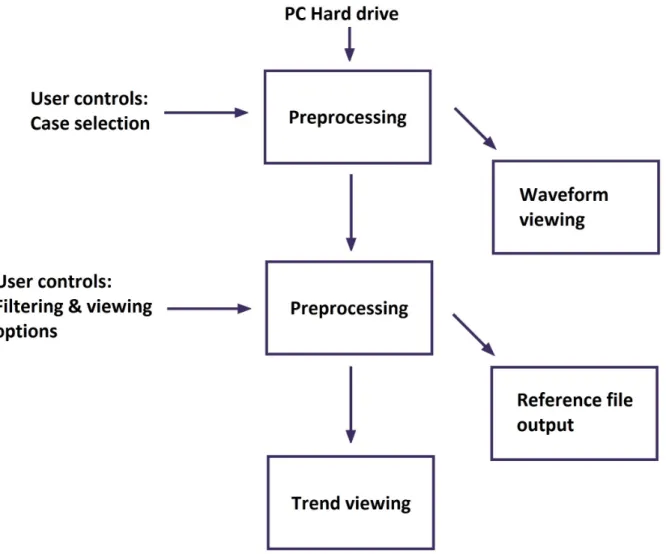
The ECG tool is operated using a graphical user interface (GUI) to enhance the usability of the tool. The user can select different instances using the list menu on the right side of the user interface window. The criteria for this can be adjusted using the checkboxes on the right side of the view.
QRS complexes: The current average of the QRS complex is shown on the right side of the corresponding heat map. HR, SQI and Acceleration: At the bottom of the basic view trends for HR, SQI and the sum of the three accelerometer axes are shown. Checkboxes: Checkboxes on the right side of the user interface are designed to control various parameters for viewing as well as parameters for making reference.
The view can also show precordial leads and a paper speed of 25 mm/s can be used by using the checkboxes on the left side of the view below the waveform.
Ischemic Episodes In Study
- Study Overview
- Diagnosed Episodes
- Performance of the Continuous Wireless Monitoring
- Individual Leads
- Reduced Lead System Sensitivity
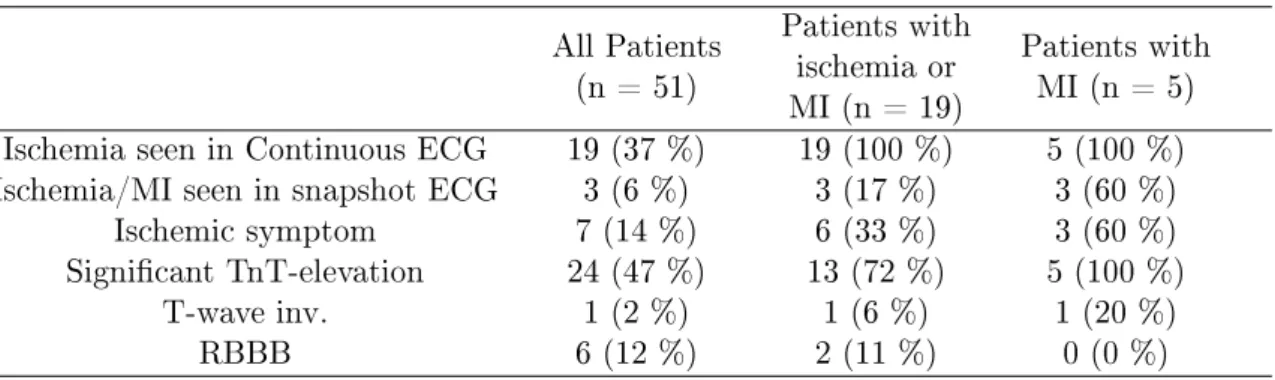
The day or days on which PMI was found to have occurred are marked as the first day as the day of surgery. ST-depression was observed from continuous ECG recordings and ischemia was diagnosed in all 19 ischemic patients, including all PMI cases. If we add the third day of PMI cases and the total ischemic time of the additional 3 ischemic cases in which ST depression was visible on the ECG, we get a total of 806 minutes (36.8%).
A total of 225 hours of data was lost due to lead detachment, which corresponds to 7% of the total recorded data and hours per recording. The sensitivity of the leads is shown in Figures 5.6 to 5.8 for the different calculated characteristics. The rest of the false alarms were due to medication (digitalis), signal noise, and other heart conditions affecting ST levels.
The sensitivity of the standard limb leads gives a sensitivity of 59.7% of the total combined episodes, mainly due to the contribution of leads II and aVF.
Discussion
MI After a Non-cardiac Surgery
ECG tool in utilizing the data
Data Issues
Conclusion
- On Optimal Continuous Monitoring of Ischemia and Infarction
- Future Deveploment Ideas and Suggestions
- Heart Layers
- Basic Heart Anatomy
- Coronary Arteries and Veins
- Action Potential Phases
- Heart Conduction System
- Dipole Resultant Vector
- ECG Waveforms and Segments
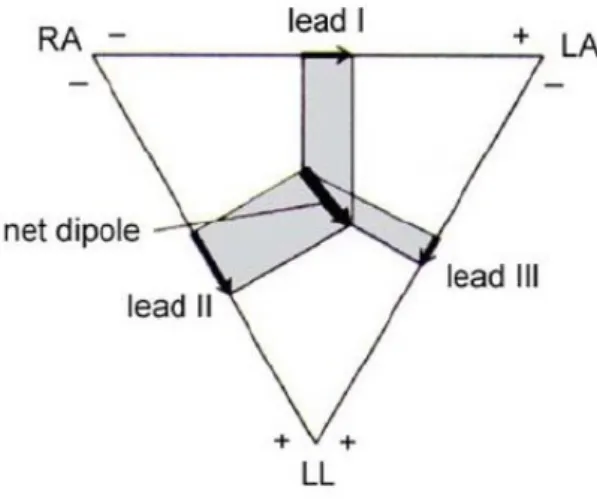
- Einthoven's Triangle
- PMI Types
- Injury Currents
- ST-deviation In Secondary Repolarization Abnormalities
- ST-measurement Points
- ST-elevation and ST-depression
- Measurement Devices
- Preprocessing Phases
- ECG Tool: Flow Principle
- ECG Tool: Basic View
- ECG Tool: ECG Waveform
- PMI Cumulative Ischemic Time
- Ischemia as a Function of Monitoring Time
- Lead Sensitivity: Combined Events and Ischemic Time, Burden and
- RBBB Sensitivity Comparison
- Incidence of Lead In Population
- Lead System Sensitivities
Zieman, 2014 AHA/ACC Guideline for the Management of Patients with Non-ST-Elevation Acute Coronary Syndrome Report of the American College of Cardiology/American Heart Association Task Force on Practice Guidelines, Journal of the American College of Cardiology, vol. Gelb, Myocardial infarction after non -cardiac surgery, The Journal of the American Society of Anesthesiologists, vol Wijeysundera, 2014 ACC/AHA guideline on perioperative cardiovascular evaluation and management of patients undergoing non-cardiac surgery: A report from the American College of Cardiology/American Heart Association task force on practice guidelines, Journal of the American College of Cardiology, vol.
Armstrong, Prognostic significance of early ST-segment elevation after resolution of ST-elevation in patients with myocardial infarction treated with thrombolytic therapy: The gusto-i ST-segment monitoring substudy 1, Journal of the American College of Cardiology, vol. Madias, Comparability of standard standing and supine electrocardiograms and standing, seated, and supine stress electrocardiograms, Journal of Electrocardiology, vol. Biccard, Evaluation of the high-risk perioperative patient, Continuing Education in Anesthesia, Critical Care and Pain, vol.
Devereaux, Postoperative B-type natriuretic peptide for predicting major cardiac events in patients undergoing noncardiac surgery a systematic review and individual patient meta-analysis, Journal of the American Society of Anesthesiologists, vol.
![Figure 2.2 Basic anatomy of the heart [43, Ch. 6]](https://thumb-eu.123doks.com/thumbv2/9pdfco/1890014.266180/17.892.252.685.636.1029/figure-basic-anatomy-heart-ch.webp)
![Figure 2.5 Parts of the heart conduction system [9]](https://thumb-eu.123doks.com/thumbv2/9pdfco/1890014.266180/22.892.194.739.115.446/figure-parts-heart-conduction.webp)
![Figure 2.7 ECG waveforms and segments [17]](https://thumb-eu.123doks.com/thumbv2/9pdfco/1890014.266180/27.892.309.628.105.430/figure-ecg-waveforms-and-segments.webp)
![Figure 3.1 Dierent modes of origin for PMI (modied from [61]).](https://thumb-eu.123doks.com/thumbv2/9pdfco/1890014.266180/36.892.156.784.114.524/figure-dierent-modes-origin-pmi-modied.webp)