The purpose of this thesis is to build a computer model of the AvanTomography demonstrator to be used to simulate the scanner's performance. This is followed by a brief theoretical consideration of Monte Carlo methods and descriptions of the used simulation tools in Chapter 3.
PET basics
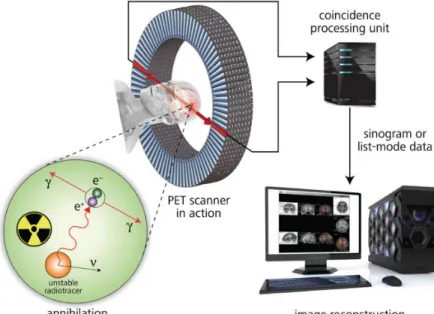
- PET physics
- PET scanners
- Image construction
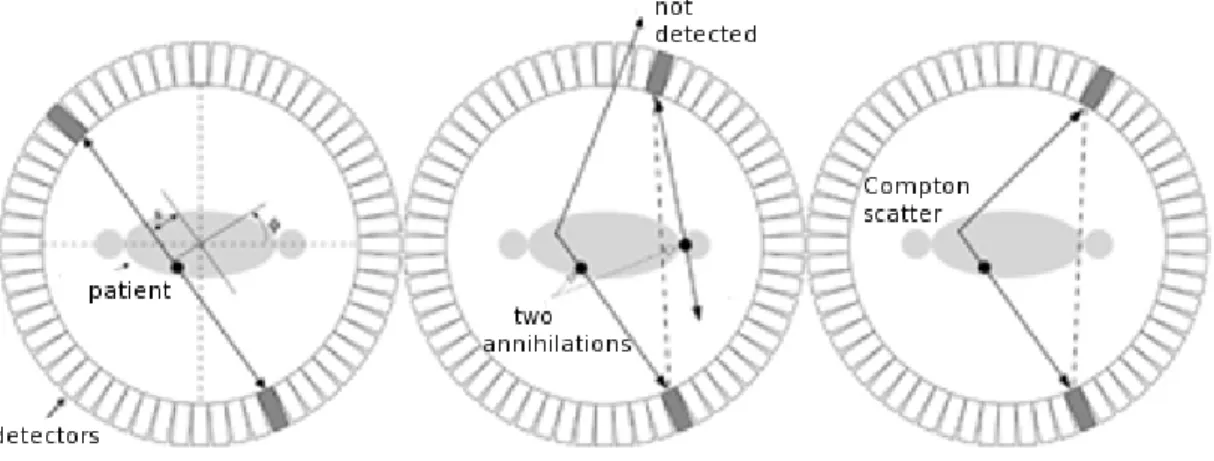
- Coincidence detection
- Performance characteristics
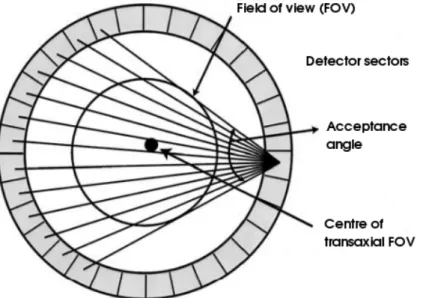
The geometric efficiency is based on the detector's coverage of the solid angle projected by the source. The energy resolution depends on the scintillation properties of the crystal and the efficiency of the photon detector.

Axial PET technology
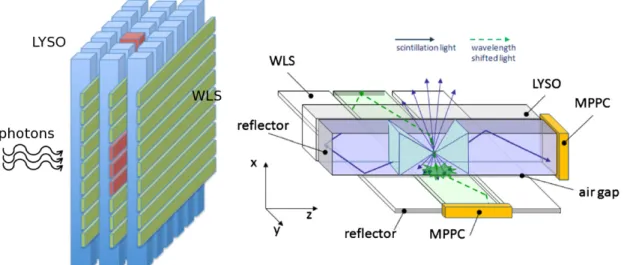
In 2007, a new system design was produced that used wavelength-shifting (WLS) strips that absorb and re-emit scintillation light placed perpendicular to the crystals to derive the axial coordinate. Crystals were now only used to provide radial and tangential coordinates and hit energy. Part of the scintillation light in the crystals is absorbed by nearby WLS bands and re-emitted at a shifted wavelength.
In the simplest method, the middle strip of the cluster of responding WLS strips is considered and the z-coordinate of the single is set as the coordinate of the strip. Thus, the spatial resolution in the z-axis is discrete and determined by the width of the WLS strips. Often times other than uniform distributions are needed, so sampling of the distribution is needed.
Simulations in medical imaging
If it is not reversible or the inversion is computationally heavy, the acceptance-rejection methods can be used. In this method, sampling from a difficult PDF is replaced by sampling from an easy PDF. 22] If using one of these two methods alone is problematic when developing an algorithm, a mixture of both can be used [24].
Geant4
GATE
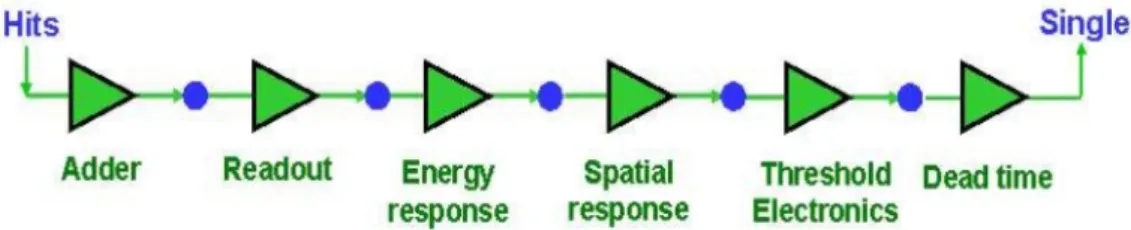
Two different packages can be used: standard energy (100 keV and above) and low energy (250 eV and above), which also includes Rayleigh scattering. To increase the simulation speed, special thresholds, cuts, can be used to produce secondary particles such as electrons, X-rays and delta rays. 12] GATE also has other digitizer modules, called user modules, that can be used to change the pulses into realistic detector output signals.
With the user modules, different characteristics of the scanner, such as readout level, energy resolution, temporal resolution, energy thresholds, dead time and finally random sorting, can be modeled. It has been shown that the electronic processing of PET can be accurately modeled using GATE. Multiple coincidences can be handled at the user's discretion with nine different multiples policies, the most common of which is ignore all multiples, the killAll policy.
Module geometry and materials
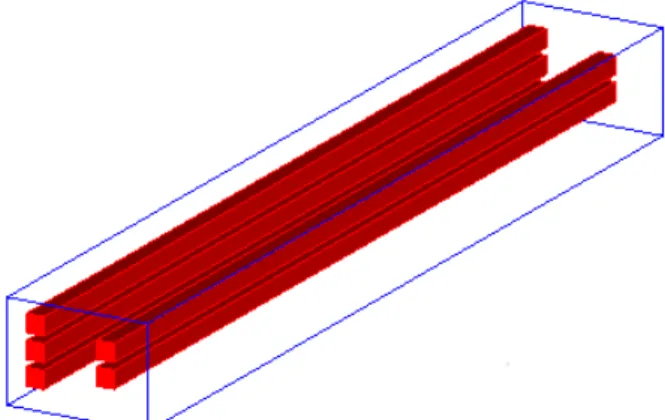
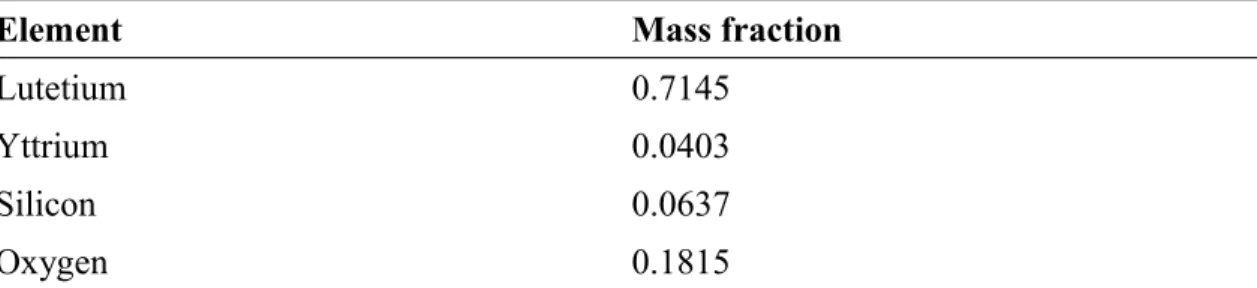
This chapter describes the construction of the model used in Monte Carlo simulations, first the geometry and material definitions and secondly the model for axial coordinate determination and its implementation. The crystals used in the project have a cross section of 3×3 mm2 and are 150 mm long. Most of the lutetium in the PreLude420 crystal is stable 175Lu, but it also contains 2.5% of the radioactive isotope 176Lu, a naturally occurring β emitter with a half-life of 3.8*1010 years.
The PreLude crystal absorbs nearly 100% of the beta particles, but some deexcitation photons escape the crystal. The wavelength shift strips used in the demonstrator are EJ-260 plastic scintillators from Eljen Technology. A row of WLS strips is placed around each layer of crystals so that most of the length of the crystals is covered, leaving only a small gap at the very ends.
![Table 4.1: Properties of PreLude420 LYSO crystal [33].](https://thumb-eu.123doks.com/thumbv2/9pdfco/1890060.266226/29.892.166.817.308.518/table-properties-of-prelude-lyso-crystal.webp)
Analytical model for axial coordinate reconstruction
The analytical photon transport model
The crystal pitch on each layer is 4.2 mm, and the spacing between the two layers is 5.6 mm. A geometric model corresponding to the physical module and the crystals and WLS strips within it was produced as part of this thesis. In the equation, the index i is the label of the WLS tape, and the sum is consequently calculated for all the tapes reading the crystal.
The index n indicates the interaction of the photon in the crystal, since it can scatter and deposit energy more than once. The amplitude of the signal A depends on the depth of interaction xn and the deposited energy En. However, since the variation of xn is small, less than 3 mm, and the signal A is linearly dependent on energy, so that A(En)=A(511keV)∙ En/511keV, the equation can be reduced to the following form: .
Parameter determination
For example, parameter σ was calculated from the length of the crystal surface from which the photons can escape the crystal. Since the width of the crystal is 3 mm and the angle θ1 is 33.5°, using trigonometry, the length lz on the crystal surface on the side of the WLS strips from which the photons can escape is 4.57 mm. The scintillation photons created by a hit scatter like a sphere with an even distribution, so the distribution of photons on a flat surface such as the crystal edge is Gaussian.
Because there is a gap between the crystal and the WLS strips over which the photons are further scattered, we can approximate that the length lz is the full width at the tenth maximum (FWTM) of the flat surface scattering. Assuming that the initial scintillation photon track is evenly distributed over the full solid angle, we get the percentage of photons exiting the crystal face toward the WLS stripes to be 20.5%, which is about 3,400 photons. The photoelectric efficiency of the WLS strip can be approximately estimated with the equation presented in the article by Braem et al., in case parameters such as the efficiency of the strips and MPPCs are known [5].
Axial coordinate determination
The new digitizer module
The pulse processor class
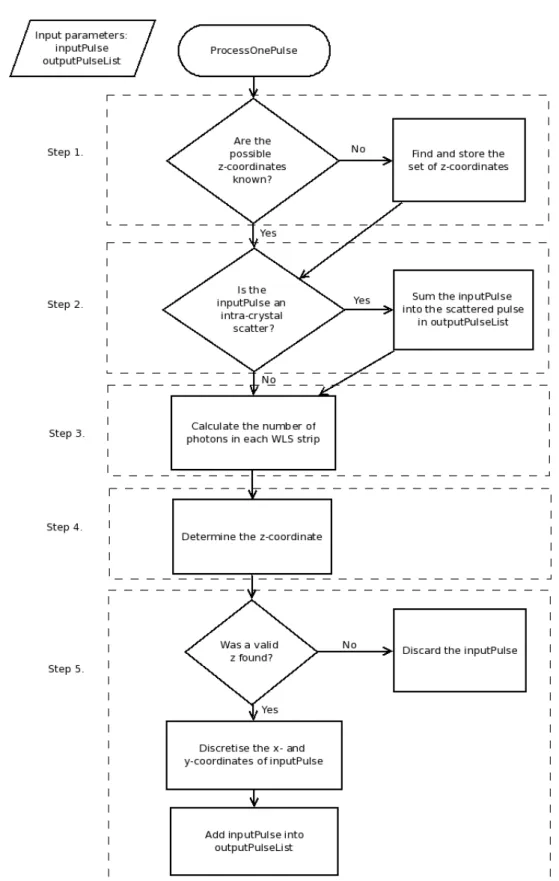
The role of the modules is to receive a list of pulses (consisting of events of one annihilation photon) from the Digitizer, process the pulses, and send back a new list of processed pulses, which is then sent to another processing module or can be fed. to randomization. The first one is ProcessPulseList which receives the list of unprocessed pulses, the other function, calls ProcessOnePulse for each pulse in the list, and finally returns the list of processed pulses. ProcessOnePulse is a function that processes one pulse (for example, adds Gaussian blur to the energy of the pulse to simulate the energy resolution of the scanner) and incorporates it into the list of processed pulses.
The existing functionality of the function ProcessPulseList was considered suitable for the new pulse processor, so the Figure 4.3: The GateDigitizer has chains of Pulse Processors that process the pulses stored in lists in the Digitizer. The helper functions defined in the GateWLSProcessor class (see Figure 4.3) are called by the function ProcessOnePulse. The current implementation requires that only one parameter, the name of the physical WLS geometry as defined in the geometry script, be given to the processor.
Processing of one pulse
From these two values, it calculates the center coordinate of the first WLS strip, firstZ. In the coupling process, the deposited energy of the pulses is summed and the coordinates of the pulse locations are combined. The z coordinate is selected from the previously constructed allZCoords vector using the size and location of the largest cluster found.
The location of the singlets is usually defined to be the center of the crystal in all axes. In this process, the x and y coordinates of the pulse are set to be at the center of the crystal, i.e. a temporal resolution of 0.25 ns was used to account for the time discrimination capability of the MPPCs.
Validation of the model
The experimental measurement of the intrinsic activity of LYSO was performed by placing 4 modules close to each other and measuring one of the total 20 crystals. Instead, the simulation setup was simplified by creating one crystal with the original dimensions (3×3×150 mm3) and around it 4 crystals with a size five times that of the center crystal. Pulse addition was performed with the original hit adder module instead of the WLS processor, as the locations of hits were not of interest, and the low energy threshold was set to 40 keV to see all gamma peaks.
In the simulation of intrinsic activity as well as in the following simulation for positron source detection, energy resolution was modeled using information about the efficiency of the LYSO crystals and the MPPCs. This simulation was run with two modules placed on opposite sides of the scanner so that the scanner diameter was 10 cm. The source was placed in the center of the transaxial plane in the FOV, parallel to the z-axis of the scanner.
Simulations of the performance characteristics
The currently constructed AvanTomography demonstrator is equivalent to the configuration presented on the right side of Figure 5.1, with the exception that it only has six modules so that there are two module layers on two opposite sectors and one layer on the other two. An 18F source was placed inside the cylinder in a 150 mm long and 3.2 mm diameter water-filled hole at 17.5 mm radial distance parallel to the central axis. 14] A series of simulations were performed so that the total activity of the phantom was reduced from 100 MBq to 1 MBq in several steps during which short scans were simulated.
The true, random, distributed coincidences needed in the calculations are obtained from the GATE output data by analyzing the annihilation event information and the coincidence distribution information. The results were analyzed and graphed using a custom code based on the ROOT data analysis framework [ 39 ]. In the first part of this chapter, the results from the model validation are shown and discussed.

Validation of the model
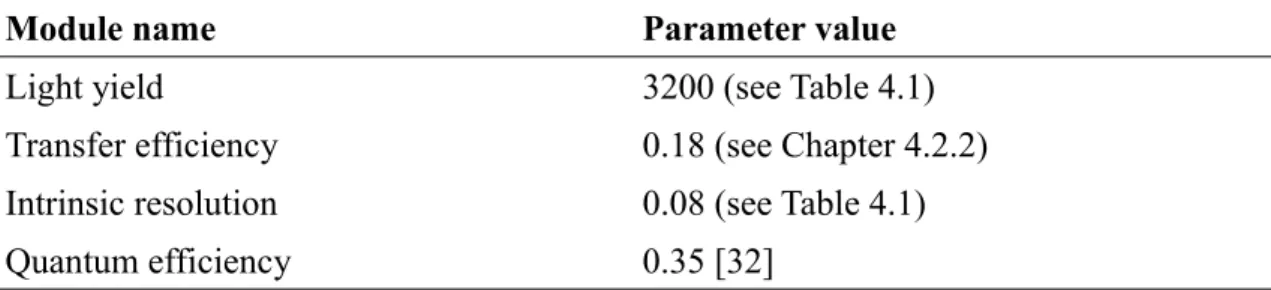
Based on these results, an energy window of 350 to 650 keV was chosen for the rest of the simulations. The energy resolution of the system is derived from the energy spectrum of the simulation with a positron source. Since the energy resolution depends on the properties of the crystals (internal RE, light yield and transfer efficiency) and photon detectors (quantum efficiency), the energy resolution varies in different scanners.
The simulated resolution value was used in the rest of the simulations as Gaussian energy blur to avoid the more detailed modeling and increase simulation speed. A closer look at the data shows that most clusters smaller than 3 strips occur near the ends of the crystals. Instead, the system only stores the index of the WLS strip from which a signal is first obtained.

Performance characteristics
The result for sensitivity is highly dependent on the solid angle coverage of the scanner, i.e. the achieved scattering fraction of the system for a rat-like phantom is 29% when the scattering in the phantom, the field of view and the module structures are taken into account. The model is built after the actual demonstrator that is being built as part of the same project.
A series of simulations were then performed to test the model and study the performance of the demonstrator. Despite these shortcomings, the results show that the model can be used in axial PET simulations to study system performance. Evaluation of Inveon PET scanner performance using GATE based on NEMA NU-4 standards.