Thesis title Process Development for the Production and Purification of Loosenin-like Proteins from Pichia pastoris, Lab-Scale Cultured Bioreactor Program Master's Program in Chemistry,. Loosenin-like proteins are a family of non-enzymatic proteins which are believed to loosen bonds between cellulose fibers and thus facilitate enzymatic access.
Lignocellulose and its Depolymerization
- The Plant Cell Wall
- Enzymes & Non-hydrolytic Proteins
- Expansins
- Loosenin-like Proteins
A key difference between them is the amino acid sequences found before the polysaccharide binding groove and in the middle of the groove, suggesting different binding selectivity. PcaLOOL2 was found to be the only protein of the four that showed binding to cellulose.
![Figure 1 | Two presently used models for primary cell wall structure [13]. A) The tethered network model; B) The biomechanical hotspot model](https://thumb-eu.123doks.com/thumbv2/9pdfco/1890250.266416/11.892.204.690.388.993/figure-presently-primary-structure-tethered-network-biomechanical-hotspot.webp)
Pichia pastoris as an Expression System
Methanol Utilizing Phenotypes
All tested PcaLOOLs also weakened cellulose nanofibrous networks, but none of them significantly increased cellulase action. PcaLOOL7 and PcaLOOL12 both bound strongly to chitin, but neither significantly increased chitinase activity.
Oxygen Consumption
The third phenotype has both genes deleted and is called the methanol using minus (Mut-) phenotype and thus is completely unable to metabolize methanol.
Commonly Used Strains
Some strains such as SMD1163 and SMD1168 are protease A deficient, meaning that protein is less likely to be degraded by enzymes, ultimately increasing protein yield. Furthermore, the only difference between SMD1168 and the SMD1168H strain used in this thesis is that SMD1168H has a functional copy of HIS4 [62], which means that selection of transformants is done with an antibiotic such as Zeocin, as opposed to histidine auxotrophy.
Bioreactor Cultivations
- Parts of a Bioreactor
- Mixing in Stirred-tank Bioreactors
- Downstream Processing
- High cell density fermentation (HCDF)
The speed of the agitator can be controlled directly from the control unit and can be automated using the cascade function. The type of propellant needed for a bioprocess depends primarily on the viscosity of the fluid. Some studies also include a cell lysis step to collect intracellular products [5], although it is not usually required for P.
Wang, Lewus and Rathore [65], outlined two main approaches for harvesting cells, which can be seen in Figure 4. After purification, the protein eluted from the Ni-NTA resin is usually concentrated using centrifugal concentration units [38]. Depending on the imidazole concentration in the elution buffer, buffer exchange is usually performed to avoid protein damage [6].
HCDF is usually the method of choice for bioreactor-scale production of recombinant proteins. Once a sufficient cell density is reached (180-220 g/L wet cells according to Invitrogen guidelines), the methanol-fed batch can be started.

Research Material and Methods
Strain and Plasmid
High Cell Density Fermentation (HCDF) Conditions
- Pre-cultures
- Medium and Cultivation Conditions
- Feeding Strategy
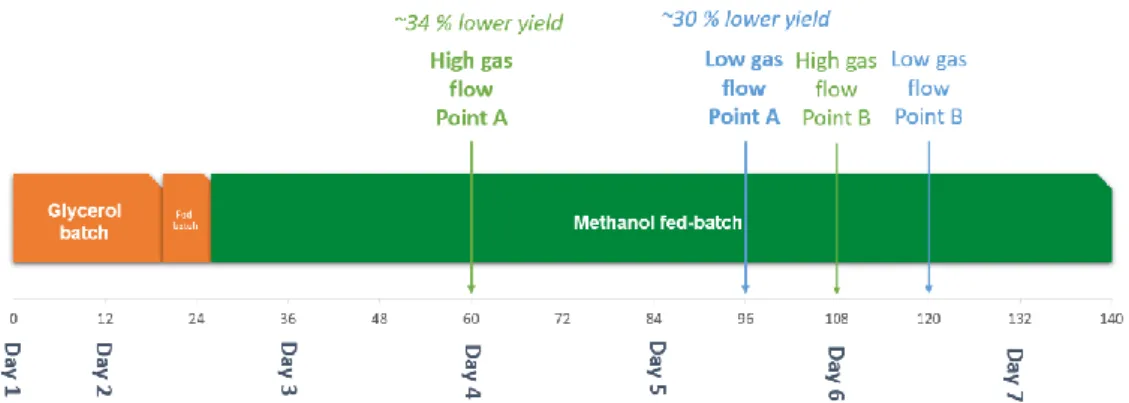
Both bioreactors used two six-blade Rushton turbines for agitation and contained three baffles at a perpendicular angle to the vessel edge and located a short distance from the tank wall. The temperature was maintained at 30°C during the glycerol stages and decreased to 25°C after the methanol was started and to 22°C the next day, which was maintained for the rest of the fermentation. The bioreactor fermentation was divided into three distinct phases, the glycerol batch, the glycerol-fed batch, and the methanol-fed batch.
Methanol was started at a low flow rate of 1-2 ml h-1 and gradually increased as the cell density increased to as high as 10 ml h-1 in some fermentations. The cultivation strategy used was MLFB, an approach in which methanol is maintained at a level that limits cell growth to maintain DO levels at a predetermined set point.
Downstream Processing
- Harvesting
- Purification Using Histidine Affinity Chromatography
- Concentration and Buffer Exchange
Here, in 2 out of 3 attempts, the media was pumped directly from the bioreactor into the MF system. In the third attempt, the cells were first pelleted by centrifugation according to the manual method. After MF, protein was concentrated to approximately 600 mL from the initial 3.5 L of cell-free media using UF.
A maximum pressure of 3.5 bar was maintained throughout the process and in case of fouling membranes were cleaned with NaOH and 0.9% NaCl solution according to the manufacturer's instructions. The 6xhistidine tag encoded in the protein has an affinity for nickel and is bound to the resin overnight. The following day, the mixture was loaded onto gravity flow columns (Bio-Rad™), unbound proteins were eluted with a phosphate buffer, and finally the proteins were eluted with an elution buffer gradient containing 100% elution buffer which itself contained 500 mM imidazole.
The imidazole-containing elution buffer was then exchanged with 20 mM sodium acetate buffer (pH 6.0) using the same concentrators. For storage, the resulting protein (10–90 mL in volume) was subaliquoted into 100 µL aliquots, flash-frozen with liquid nitrogen, and stored at −80 °C.
Sampling and Analytical Methods
- Optical Density, Cell Dry Weight and Cell Wet Weight
- SDS-PAGE for Protein Identification and Estimation of Concentration
- UV-Vis and BCA for Protein Concentration
Protein concentration was primarily determined using a UV-Vis microvolume spectrophotometer (NanoDrop™ Lite, Thermo Scientific™, Cat. # ND-LITE-PR) at 280 nm. To obtain protein concentrations in mg mL-1, the average absorbance was divided by a predetermined extinction coefficient for each protein (PcaLOOL9: 0.728, PcaLOOL12: 1.73), determined using ProtParam [68]. For one production, the Pierce™ BCA Protein Assay kit was also used as a comparison for protein concentration, using bovine serum albumin as a reference (Results not shown).
Cell Dry Weight And Cell Wet Weight Ratios
Overview of Fermentations
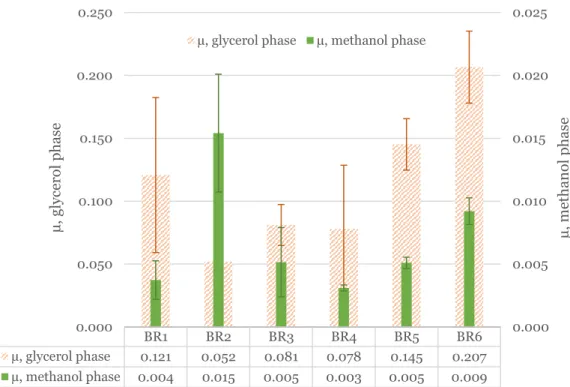
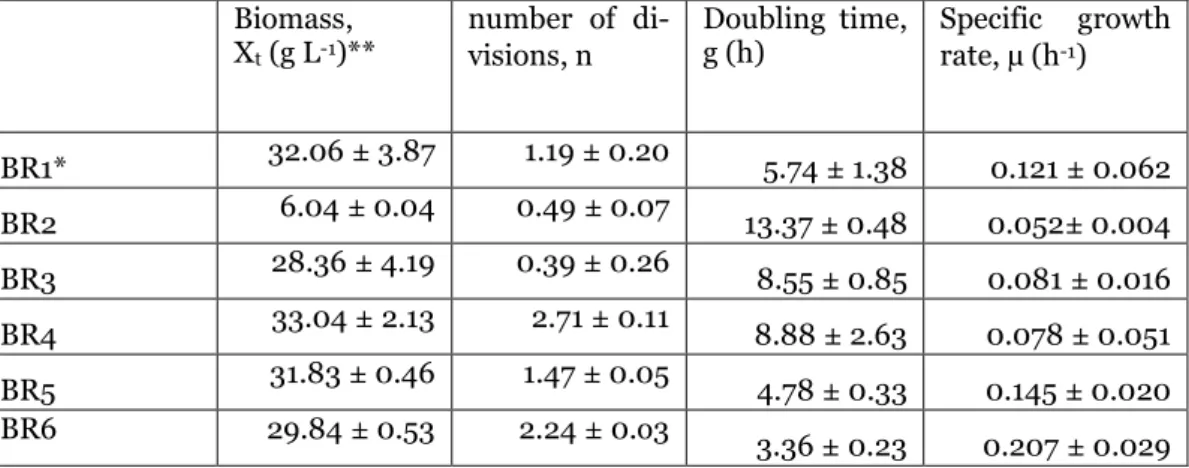
The highest final biomass concentration as well as the fastest growth rate was observed in BR6, which was performed in the high gas flow stainless steel bioreactor. The lowest biomass concentration was reached in BR2 due to a gas flow problem at the start, which led to delayed growth initiation, which is described in more detail in Section 3.3.

Growth Rates
Biomass (𝑋𝑡), number of divisions (𝑛), doubling time (𝑔) and specific growth rate (µ) values for BR1-6 for the glycerol phases are shown in Table 2 and Figure 6, and for the methanol phase in Table 3 and Figure 6. Excluding BR2, the fastest growth rate in both BR1-6 and the fastest growth rate in both BR1-6 and see the glycerol phase. aeration rate. Except for BR2, the specific growth rates in the glass bioreactor (BR1, 3,4 and 5) were all quite comparable.
Ideally, glycerol should be completely consumed before the start of the methanol phase, but in this case methanol feeding started too early, resulting in the simultaneous presence of glycerol and methanol in the media. This meant that the apparent high growth rate in the methanol phase is significantly affected by the presence of glycerol. The fastest growth rate was seen in BR2, which is misleading due to the presence of significant glycerol during the methanol phase.
The higher growth rate in the glycerol phase means that a higher CDW after the glycerol phase was achieved by Jahic et al. The growth rate in the methanol phase was similar to what was achieved in BR6, but the culture lasted more than 200 hours and the cell density continued to increase until about 140 hours.
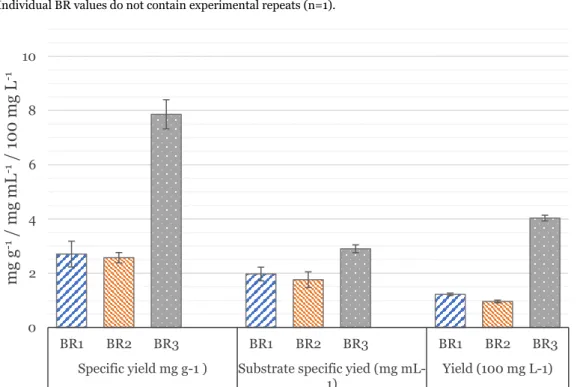
Yields from BR1-3
Specific yield: mg protein per g CDW; Specific substrate yield: mg protein per mL methanol fed; Yield: mg protein per liter (represented as 100 mg L-1).

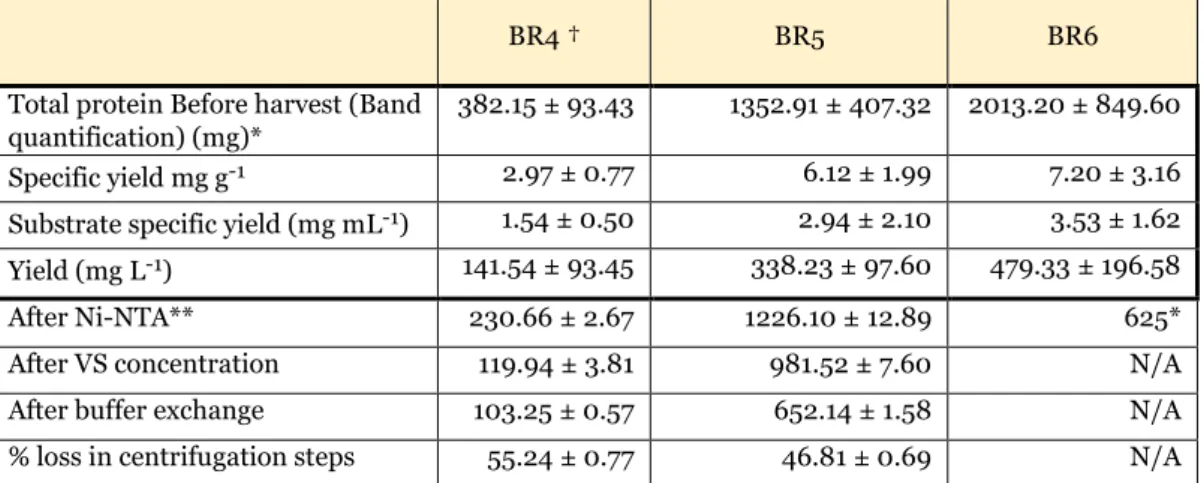
Yields from BR4-6
These values are also the most representative of the amount produced and are therefore used to determine yields per liter, specific yield and specific substrate yield, unlike BR1-3, where amounts after Ni-NTA were used. Band quantification was done by three replicate technical measurements of the same SDS-PAGE band. After Ni-NTA, after VS concentration and after buffer exchange, values were measured using UV-Vis spectrophotometry with 7-10 technical replicates, except for BR6, so error values could not be calculated.
Yield values were derived from band quantification values performed with three technical replicates of the same SDS-PAGE band. Without going into detail about the structural nature of the proteins produced, comparing productions of similar molecular weight is one way to improve comparability. Therefore, the yields achieved in this thesis fall within a typical range for recombinant protein production, although well above those achieved with proteins of similar size.
The possible reasons why some proteins may allow higher yields than others are beyond the scope of this thesis.
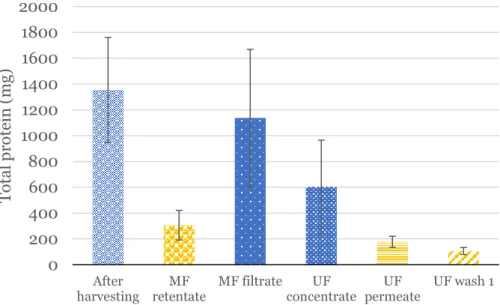
Evaluation of Crossflow Filtration System
These values were then averaged to give an approximate amount of protein lost. These values indicate that most of the protein was lost during the ultrafiltration phase. Protein abundance values were obtained from band quantification values performed with three technical replicate measurements of the same SDS-PAGE band.
Protein amount values were derived from band quantification values performed with three replicate technical measurements of the same SDS-PAGE band. A significant amount of protein was lost and both the UF storage and the purified protein were abnormally turbid (Figure 10A & 10C). Since no similar issues were found in the literature, the most likely explanation is salt precipitation of the protein due to the presence of sodium hydroxide in the solution.
It was speculated that this sodium hydroxide was released from the UF membrane during the concentration of the protein, which could explain the large protein loss during this step (Table 6). In this particular case, the age and previous uses of the UF membrane were unknown.
Comparison of High and Low Gas flow
Optimal Time for Harvesting
Cregg et al, "Functional characterization of two alcohol oxidase genes from the yeast Pichia pastoris", Mol. Macauley-Patrick et al, "Heterologous protein production using the Pichia pastoris expression system", Yeast, vol. Gao et al, “Efficient expression of endo-β-1,3-glucanase in Pichia pastoris for co-culture with Agrobacterium sp.
Jahic et al, “Analysis and control of proteolysis of a fusion protein in Pichia pastoris fed-batch processes”, J. Maity et al, “High level production of stable human serum albumin in Pichia pastoris and characterization of the recombinant product”, Bioprocess Biosyst Eng, vol. Duman et al, "High-quality heterologous expression of active Chaetomium thermophilum FDH in Pichia pastoris," Enzyme Microb.
Calderon-Salais et al, "Constitutive expression of the active fragment of human vasostatin Vs30 in Pichia pastoris SMD1168H," Protein Expr. Ahmad et al, "Protein expression in Pichia pastoris: recent achievements and perspectives for heterologous protein production", Appl.