Conversely, during the period of market decline, the value premium of value portfolios of CF/P and D/P declined. However, the research shows that the value premium is significantly lower in the second half of the period.
2 Value versus growth
Value investing
Value investing as a strategy has come a long way to date and is still one of the most widely used strategies in the investment world. Many times the investment started as a growth investor, but gradually shifted to value investing as the investment horizon shortened and the capital value and human capital of the investors developed.
Growth investing
However, growth investing is considered less risky by most researchers because growth stocks are not as sensitive to economic downturns. However, a comparison of historical prices shows that growth stock volatility has been higher.
Classification of strategies
- P/B ratio
- D/P ratio
- CF/P ratio
- EBITDA/EV ratio
In the simplest form of the ratio, cash flow is measured as income and depreciation. Value investors look for companies with a high CF/P, mainly because of their low price.
3 Market efficiency
Three degrees of market efficiency
In semi-strong form markets, all the information relevant to the pricing of the share is immediately reflected in the price of the share. The strong form of market efficiency states that all relevant information is immediately reflected in the price of the share and this information is also private information known only to insiders of the company.
Efficient market hypothesis
In his study, he states that it would be wise for the private and institutional investor to settle for the average return of the market, as it offers the highest return over the long term. Later, Fama (1998) found that various long-term anomalies between stock prices and their actual value are found in stock markets.
4 Valuation of stocks
- Gordon growth model
- The capital asset pricing model
- Fama & French factor models
- Jensen’s alpha
- Sharpe ratio
The model accurately predicts the relationship between an asset's risk and expected return. The three factors of the model are the firm size factor, the value factor and the market premium. Several studies had shown that the three-factor model lacks much of the variation in average returns on investments.
When Jensen's alpha is positive, the return on the portfolio has exceeded the return predicted by the CAPM, and the higher the ratio, the better the portfolio or stock has performed. The measurement is to compare expected return to volatility, so it is a good measure to compare whether the stock or portfolio's return is a result of high risk taking or good performance. The larger the Sharpe ratio indicates that the portfolio has performed better when risk is taken into account, so the larger the Sharpe ratio, the better the risk-adjusted performance of the stock or portfolio.
5 Value premium
The manifestation of value premium
Based on the results of the study, Fama & French (1992) show how there is a strong correlation between firm size and an even stronger correlation between book-to-market equity and average returns. The study (1992) is an indication of the existence of a value addition and it suggests that the explanation of the value addition could be compensation from the systematic or market risk of the companies and the rationality of the investors. 1994) comes to the conclusion that value premium arises due to investors' lack of rationality.
French (1992) that value strategy performance is based on higher risk of value companies. Their article suggests that behavioral factors play an important role based on research evidence to explain variations in average returns. Fama and French (2020) investigate the manifestation of the value premium and its possible reversal through 2019.
Value premium and business cycle
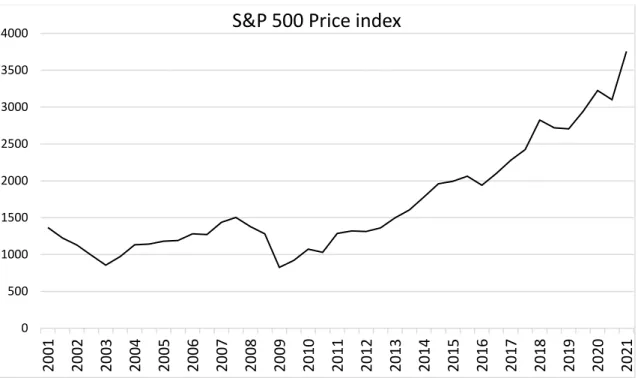
Lu Zhang (2005) studies value premium and why value stocks have higher expected returns than growth stocks. Based on the study, it offers a risk-based explanation for value premium in the downturn of economic conditions. Value premium and the performance of value stocks in the US market during the subprime credit crisis was studied by Lee, Strong & Zhu (2014).
They provide results of value stocks underperforming growth stocks during the subprime credit crisis that started in early 2007, despite a positive value premium before it. According to the study, the value premium turned negative during the crisis, so growth stocks outperformed value stocks. Results also show how value firms that are more financially constrained underperform growth stocks due to a decline in corporate returns and how the value premium declines with less constrained firms.
6 Data and methodology
Data
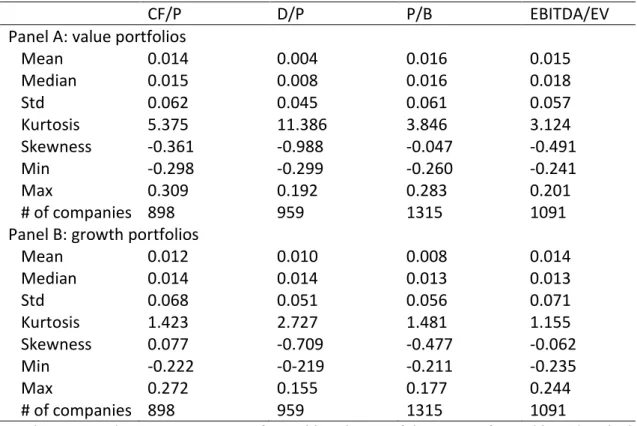
The research data contains observations from 1900 to 2700 companies depending on the year and how their financial statements and monthly prices are available. Companies whose data could not be collected were left out of the study, and results that clearly deviated from the rest of the data were removed. The value and growth portfolio observations are calculated for 30% of the observations from all stocks of the sample period.
Panel A reports descriptive statistics of monthly value portfolio returns constructed based on high CF/P, D/P, EBITDA/EV, and low P/B ratio. Panel B reports descriptive statistics of monthly portfolio returns constructed on a low CF/P, D/P, EBITDA/EV, and high P/B ratio.
Methodology
As Pättari and Leivo (2009) note in their paper, this study also defines a 25% rise or fall in the market index as periods of economic growth and decline. In order to obtain a more realistic picture of equity risks and returns, this research uses the Sharpe ratio (Sharpe, 1966) of portfolios in comparison. The statistical significance of differences in Sharpe ratios is determined in this study based on p-values given by Snedecor and Cochran (1991) using a two-sample t-test from annual Sharpe ratios.
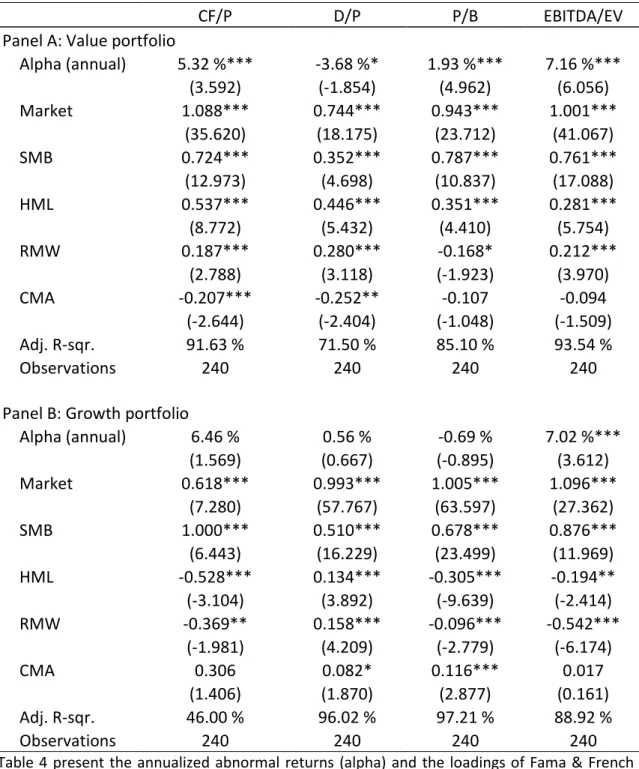
To ensure the reliability of the results and gain a better understanding of the existence of the value premium, this research uses the five-factor model of Fama and French (2015) in addition to other measures. The five-factor model is a very common method used in the financial literature and measures abnormal returns to determine whether portfolio returns can be justified by factors such as size, value, profitability or. Following Tikkanen and Äijö (2018), this research uses Newey and West's (1987) standard errors in the regression to avoid heteroscedasticity and autocorrelation.
7 Results
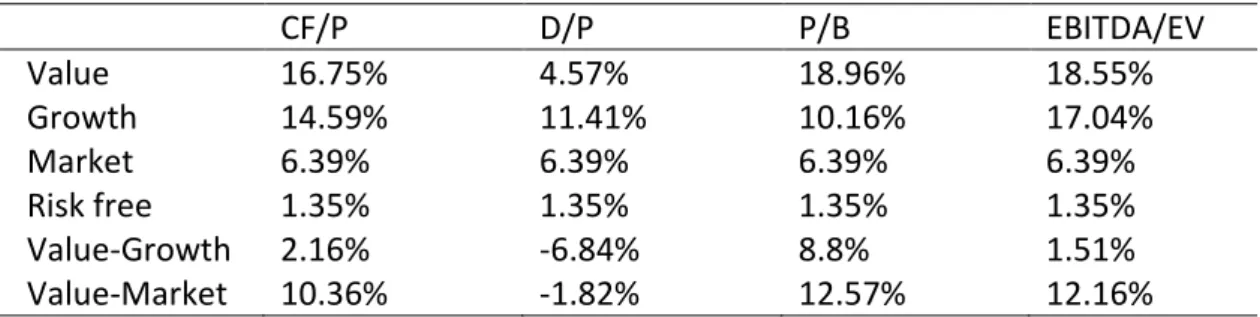
Full sample value premium
These findings of better risk-adjusted returns from the three value portfolios are consistent with the previous full-sample period studies with Fama and French (1998), Bird and Casavecchia (2007a), and Blitz and Hanauer (2021). Based on the results obtained, it can be concluded that three of the four value portfolios show superior risk-adjusted returns compared to both the market portfolio and the growth portfolio. It is important to note that the growth portfolio alpha is not statistically significant.
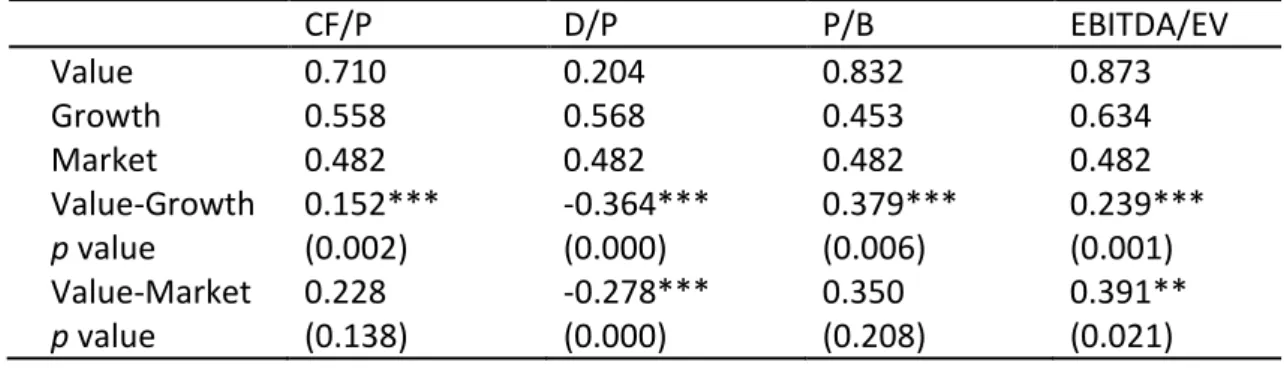
The value factor (HML) shows a statistically significant positive effect on the returns of the value portfolios. The profitability (RMW) factor has a positive impact on the returns of the value portfolios, excluding the P/B portfolio, and these findings are statistically significant. Regarding the value portfolios, the D/P portfolio exhibits the lowest R-squared measure at 71.5%, while the CF/P growth portfolio has an R-squared value of 46% among the growth portfolios.
Value premium in different market conditions
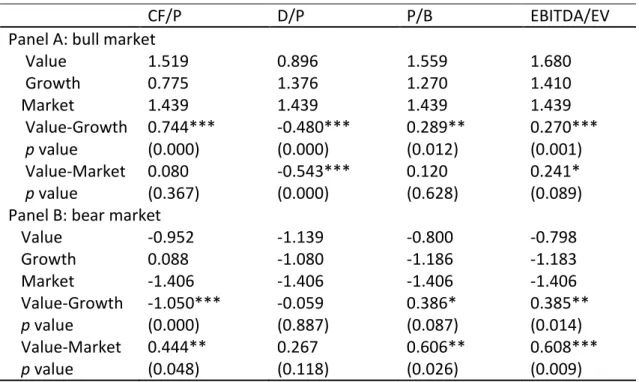
The results of the increased value premium of the CF/P and EBITDA/EV portfolios support the acceptance of hypothesis four (H4). Annual alphas of CF/P, D/P and EBITDA/EV approximate results for the entire study period. Still, in the case of the P/B value portfolio, a significantly higher alpha (6.72 percentage points) can be observed during the bull market period.
As far as the growth portfolios are concerned, it can be observed that the negative correlation of the RMW factor is even greater than in the entire studied period and it is statistically significant for all growth portfolios. Fama and French five-factor model therefore still explain a large part of the risk loadings of these portfolios. Adjusted R-squared of the model is also very high in the bear market ranging from 74%.

Summary of the results
Naturally, the value factor (HML) had a statistically significant positive effect on value portfolios and a negative correlation for growth portfolios except for the D/P growth portfolio. The results of the bull market period showed that the value versus growth Sharpe difference was 0.59 greater in the CF/P portfolio and slightly greater (0.03) in the EBITDA/EV portfolio compared to results of the entire review period. The results showing an increase in the value premium for the CF/P and EBITDA/EV portfolios provide support for the acceptance of hypothesis four (H4).
The value premium for the P/B and EBITDA/EV portfolios increased even as the market declined, resulting in mixed and inconsistent results. Despite this, the bear market caused a decline in the majority of alphas for the value portfolios. The results also showed that the market, small minus large (SMB), and high minus low (HML) factors had positive and statistically significant loadings in all value portfolios, indicating that the value premium was driven by these factors under both market conditions.
8 Conclusions
Despite the observed decline in value portfolio alphas in the bear market period, the lack of consistent findings across portfolios prevents acceptance of hypothesis three (H3). This study did not find comparable convincing statistically significant evidence of the fall in the value premium during the bear market as Gülen et al. In conclusion, the study provides evidence that the value premium is present in both bull and bear market conditions.
The research provides investors and fund managers with practical implications that over the long term value investing is still profitable and the value premium is still evident. The results also show that the value premium is mainly driven by the market, SMB, and HML factors of Fama and the French five-factor model. There are several studies on the effects of company size and profitability on the value premium, and it would be interesting to study this topic further.