is an open access repository that collects the work of Arts et Métiers Institute of Technology researchers and makes it freely available over the web where possible.
This is an author-deposited version published in: https://sam.ensam.eu Handle ID: .http://hdl.handle.net/10985/23309
To cite this version :
Alexandra BELYANOVSKAYA, Daria VOROBEVA, Natalia GUSEVA, Bertrand LARATTE - The depth of the soil's horizons profile has an effect on the human health impact score - Journal of Cleaner Production p.136134 - 2023
Any correspondence concerning this service should be sent to the repository Administrator : [email protected]
Journal Pre-proof
The depth of the soil's horizons profile has an effect on the human health impact score
Alexandra Belyanovskaya, Daria Vorobeva, Natalia Guseva, Bertrand Laratte
PII: S0959-6526(23)00292-5
DOI: https://doi.org/10.1016/j.jclepro.2023.136134 Reference: JCLP 136134
To appear in: Journal of Cleaner Production Received Date: 25 March 2021
Revised Date: 22 July 2022 Accepted Date: 18 January 2023
Please cite this article as: Belyanovskaya A, Vorobeva D, Guseva N, Laratte B, The depth of the soil's horizons profile has an effect on the human health impact score, Journal of Cleaner Production (2023), doi: https://doi.org/10.1016/j.jclepro.2023.136134.
This is a PDF file of an article that has undergone enhancements after acceptance, such as the addition of a cover page and metadata, and formatting for readability, but it is not yet the definitive version of record. This version will undergo additional copyediting, typesetting and review before it is published in its final form, but we are providing this version to give early visibility of the article. Please note that, during the production process, errors may be discovered which could affect the content, and all legal disclaimers that apply to the journal pertain.
© 2023 Published by Elsevier Ltd.
analysis.
Daria Vorobeva Writing - original draft, Formal analysis.
Bertrand Laratte: Conceptualization, Supervision, Methodology.
Natalia Guseva: Conceptualization, Supervision.
Journal Pre-proof
1 The depth of the soil’s horizons profile has an effect on the human health impact score
1 2
Authors 3
1, 2 Alexandra Belyanovskaya [email protected] 4
1 Daria Vorobeva [email protected] 5
1 Natalia Guseva [email protected] 6
3 Bertrand Laratte [email protected] 7
8
1 Division for Geology of School of Earth Sciences & Engineering, Tomsk Polytechnic University, 9
30, Lenin Avenue, Tomsk, 634050, Russia 10
2 Laboratory for Sedimentology and Paleobiosphere Evolution University of Tyumen, Russia 11
3 Arts et Métiers Institute of Technology, University of Bordeaux, CNRS, Bordeaux INP, INRAE, 12
I2M Bordeaux, F-33400 Talence, France 13
14
Journal Pre-proof
2 Abstract
15
The chemical composition of soils reflects the degree of industrial exposure. Cu and Ni concentrations 16
in soils of the «Severonickel» plant vicinity are higher than remote ones. In the impact area, the mean 17
concentration of the heavy metals in the subsoils is 55 [ppm] for Ni and 33 [ppm] for Cu. Soils’
18
chemical composition varies over different mineral horizons. The subsoil layer is the main 19
accumulator of chemical elements, including pollutants. Erosion of the surface layer and technogenic 20
disturbance of the soil profile can lead to subsoil spreading and a significant increase in the human 21
health Impact Score. At the same time, the default IS calculation is focused on the 0.1 [m] depth for 22
all zones. In the paper two factors are considered in the impact modeling modification. The human 23
health Impact Score is calculated specifically for each genetic soil layer with the respective depth of 24
the profile (from 0.05 [m] to 0.2 [m]) and for soils from background and impact areas. The 25
discrepancies between default and modified Impact Scores are observed. In the Impact area, the 26
highest IShum for Ni is 60, for Cu is 5.6 [DALY]; in the Background area, it is 11 and 3.1 [DALY]
27
respectively. The importance of using the regionally modified values in population health impact 28
monitoring is highlighted.
29 30
Keywords 31
Arctic soils, impact assessment, characteristic factors, USEtox, Kola region, copper, nickel, regional 32
LCIA 33
34 35
Journal Pre-proof
3 Introduction
36 37
The Arctic zone is characterized by extreme natural and climatic conditions, the focal nature of 38
industrial and economic exploration of the territory, low population density, and the vulnerability of 39
nature and public health from industrial activity. The Kola Peninsula is Russian Arctic territory where 40
the wealth of mineral resources has become the basis for the growth of mining and metallurgical 41
industries. At the same time, northern ecosystems are highly sensitive to the intake of technogenic 42
origin chemical elements. Many metal ions are potentially toxic, so it is important to understand their 43
transport and distribution in the environment and the routes through which they may be transferred 44
to humans (Spurgeon et al., 2011). Nickel (Ni) and copper (Cu). Ni and Cu are chosen for the research 45
because they are the main pollutants in the North-West of Russia (Barsova et al., 2019; Kyllönen et 46
al., 2020; Moiseenko et al., 2006; Sandimirov, 2020). Exposure to heavy metals can cause a lot of 47
health problems in humans. Long-term exposure is linked to several neurological disorders (Alquezar 48
et al., 2020; Chin-Chan et al., 2015). Therefore, the question of assessing the impact of pollutants on 49
individual elements of ecosystems arises, air, water, soil, including on humans and their health.
50
Current article is focused on the soil pollution. Soil is a biogeochemical barrier for chemical elements 51
input to ecosystems from the polluted atmosphere. Soil is a depositing medium that accumulates 52
chemical elements. This property becomes especially important under conditions of long-term 53
anthropogenic load (Barsova et al., 2019). Soil is a critical repository for numerous deleterious 54
pollutants, thereby serving as a good matrix for assessing the status quo of environmental pollution 55
(Doyi et al., 2018). Soils degradation leads to a decrease in their sorption capacity and, consequently, 56
to groundwater contamination with heavy metals (Shumilova and Petrov, 2016). Heavy metal 57
pollution affects the soil’s ecological function (Li et al., 2021; Yuan et al., 2021). Heavy metals 58
emanate from a myriad of sources in the environment, including industrial wastes, and particularly in 59
areas of the intersection of enterprises (Wuana and Okieimen, 2011; Zhang et al., 2020). Recently a 60
lot of research has been devoted to human health impact assessment of heavy metals in mediums such 61
Journal Pre-proof
4 as soils, sediment, or dust. Because of their persistence and non-biodegradability, heavy metals can 62
easily accumulate in the environment and could be transferred to plants, living organisms, and 63
groundwaters (Alloway, 2013).
64
When assessing the pollution of natural environments, the gross value of chemical elements in the 65
components of the natural environment is the most frequently determined indicator (F. Bratec et al., 66
2019; Perminova, 2017; Sharma et al., 2021). Nevertheless, it does not allow a comparative impact 67
assessment between different chemical elements or components of the natural environment. For this 68
reason, many authors now use modern methods and models of the impact and environment 69
geoecological state assessment based on the calculation of the various indexes (Liang et al., 2015;
70
Makarova et al., 2018; Zhang et al., 2020).
71
In this study, we consider assessing of the human toxicity with calculation of the life cycle impact 72
assessment Impact Score (IS) calculation as the approach to quantify the human health impact 73
(European Commission -- Joint Research Centre -- Institute for Environment and Sustainability, 74
2010). The Impact score is calculated using the total mass of the pollutant and the substance specific 75
characterization factor. The characterization factors calculation is taken from the USEtox model.
76
USEtox is a scientific consensus model for comparative assessment of toxics of goods and services 77
(Wu and Su, 2020). USEtox is model endorsed by UNEP's Life Cycle Initiative for characterizing 78
human and ecotoxicological impacts of chemicals (Hauschild et al., 2008; Rosenbaum et al., 2008).
79
The USEtox is specifically focused on the human health and the ecosystems impact assessment 80
(Nordborg et al., 2017).
81
However, there are a lot of uncertainties connected with the LCIA models, and the USEtox in 82
particular:
83
1. The inventory of metals in the model dataset needed to be developed. In the USEtox 84
inorganics are all specified as ‘indicative’, reflecting the relatively high uncertainty associated with 85
estimates of fate, exposure and effects for this substance group (Fantke et al., 2017). The CFs for 86
metals in the USEtox are classified as interim (Pizzol et al., 2011). Variations in transport properties 87
Journal Pre-proof
5 for inorganic substances depend in complex ways on a range of media properties. However, there are 88
not local geological information in the model. In the article we propose to reduce this limitation with 89
the analytical results of Ni and Cu concentration in soils of Kola peninsula.
90
2. In the USEtox model only the concentration of the pollutant in the surface layer is considered 91
for the Impact Score calculation (Fantke et al., 2017). However, the surface soil layer can be 92
disturbed, or the natural genetic layer can be changed (Elsukova et al., 2019; Kashulina et al., 2014, 93
2010). The default IS calculation is focused on the 0.1 [m] depth for all zones. We extend the model 94
dataset leaning on media properties as different soils profile horizons (from 0.05 [m] to 0.2 [m]).
95
Considering all limitations, we can propose following hypothesis, it is necessary to consider local 96
features of the landscape: natural differentiation and technogenic transformation of the soil profile. It 97
allows adjusting the result of the impact assessment on the living organism and adapting it for regional 98
conditions (Belyanovskaya et al., 2022, 2019, 2020).
99
To investigate this hypothesis, we compare soil layers' potential toxicity for human health by 100
calculation of the Impact score. The Impact score is calculated both in the area of influence and in 101
the background area. It emphasizes the combined influence of natural and anthropogenic factors, 102
which demonstrates how in small, contiguous territories there can be a sharp change in IS as a result 103
of the variability of lithogeochemical conditions and the presence of industrial facilities. This 104
approach allows the IS values to be taken as another factor for identifying the zone of impact of 105
industrial enterprises from the perspective of human health impact assessment. To compare the level 106
of impact the background area was chosen as well.
107
The background zone is remoted from the emission source. Studies of soil chemistry in this area 108
revealed minimal concentrations of nickel and copper (Guseva N.V. et al., 2020; Vorobeva D. and 109
Guseva N.V., 2021). It was difficult to locate the background zone farther because of the variable 110
lithogeochemical background and the presence of other large industrial facilities. This approach is in 111
accordance with studies by other authors (Opekunova et al., 2006).
112
Journal Pre-proof
6 Modification of the Impact score calculation allows us to characterize the degree of impact on human 113
health (IShum), combining different methods of assessing the ecological condition of urban areas:
114
geological approach and impact assessment, which reflect the novelty of the research. On the one 115
hand, studies of the geological characteristics of areas exposed to industrial impact reflect the changes 116
occurring in the natural environment due to technogenesis. On the other hand, the application of a 117
wealth of geological data allows for the expansion of the database of impact assessment models and 118
a more complete assessment of the quality of the natural environment. The application of an 119
interdisciplinary approach is based on the principles of ecogeochemistry, human health, and 120
ecosystem impact assessment.
121 122
1. Study area 123
124
1.1 Natural conditions 125
126
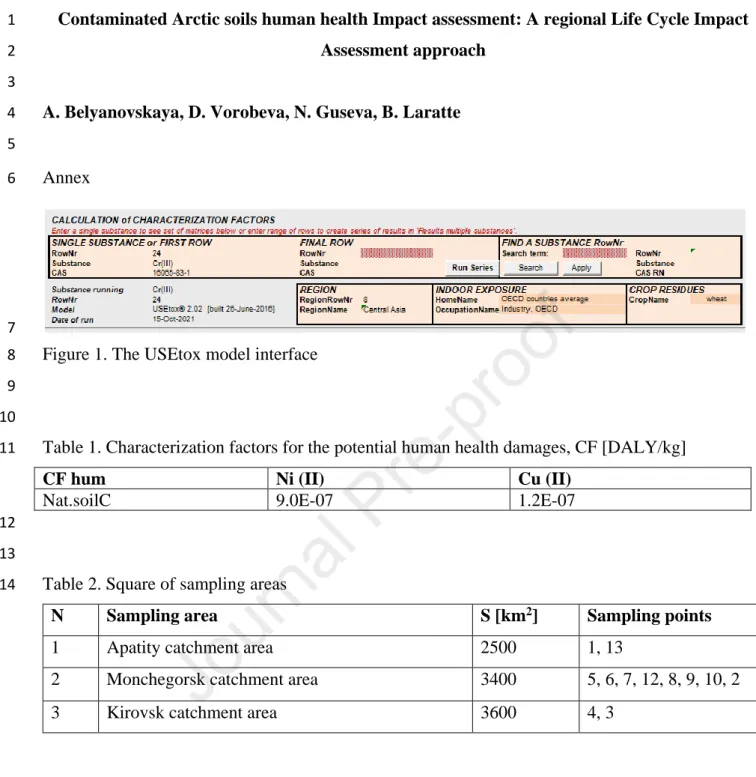
The Lake Imandra catchment is the central part of the Murmansk region (Figure 1-2). Murmansk 127
region is a constituent entity of the Russian Federation with a total area of 144.900 thousand km2, 128
located in the north-west of Russia. Sampling points refer to three administrative units of the 129
Murmansk region: the Apatity, Kirovsk, Mochegorsk catchment areas.
130
Almost the entire territory lies north of the Polar Circle and is located on the Kola Peninsula. The 131
climate is a temperate cold climate, with average annual precipitation and an annual temperature of 132
553 mm and -0.8◦C, respectively. The prevailing wind direction is from north to south in summer and 133
from south to north in winter.
134
The eastern part area is occupied by the alkaline Khibiny Massif, and the western part of the territory 135
is a hilly plain with a section of industry-disturbed landscape. The geological structure here is 136
represented by basic and ultrabasic rocks, overlapped by moraine lake-glacial and fluvioglacial 137
Journal Pre-proof
7 deposits. The study area as a zone of ores extraction is investigated; the mineralographic map is 138
following (Figure 1).
139 140 141
Figure 1. Mineralographic map of the research area, 1:200000 142
Compiled on the basis of materials from GIS-Atlas «Subsoil of Russia» as of 01.09.2019.
143 144
According to the mineralographic map of the area there are natural depositions of Ni, Cu, Cr, and Pt 145
in the area of smelter vicinity (Monchegorsk city). The impact and the background areas are placed 146
in the boundaries of the established nonferrous metals depositions. There are non-metal minerals 147
resources around Kirovsk city.
148
The geological and climatic features of the region determine the soil characteristics. Four types of 149
soils have developed on the Kola Peninsula: tundra, podzol, boggy, to a small extent soddy and 150
derived from them. Most typical of the Kola Peninsula is podzol soil type. The mechanical 151
composition is dominated by sandy and sandy loam soils, largely heaped (Elkshina and Kupriyanova, 152
1970).
153 154
1.2 Industrial influence 155
156
Landscapes of the Kola Peninsula have been already investigated due to the high level of 157
anthropogenic tension (Kashulina, 2017; Revich, 2020). This impact leads to massive air, soil, and 158
water pollution (Bazova, 2013; Dauval’ter and Kashulin, 2015).
159
The presented results allow us to evaluate the impact of the copper-nickel plant on the chemical 160
composition of the components of the natural environment through the polluted atmosphere.
161
Emissions in 2016 were Ni 245 t/yr Cu 462 t/yr (Barkan and Lyanguzova, 2018). In the zone of 162
impact of copper-nickel factory emissions, atmospheric precipitation contains significant amounts of 163
Journal Pre-proof
8 pollutants: Ni 262 µg/l, Cu 540 µg/l (Evtyugina and Asming V., 2013). In surface waters (Ni 46 µg/l, 164
Cu 17 µg/l) concentrations of these elements are significantly higher than in groundwater (Ni 4.9 165
µg/l, Cu 0.56 µg/l) (Evtyugina et al., 2016). When atmospheric precipitation infiltrates through the 166
soil, most of the heavy metals are bound in the soil horizons, where they accumulate (Ni 54.99 ppm, 167
Cu 33.26 ppm) (Table 7, Annex). The soil is thus a natural buffer that protects groundwater from 168
aerotechnogenic nickel and copper intrusion. Therefore, the stage of infiltration of atmospheric 169
precipitation through the soil plays a significant role in the chemical composition of groundwater, 170
and soils themselves.
171
There are extremely high concentrations of Ni and Cu in the organogenic soil horizons and the 172
medium peat layers (Kashulina, 2017). According to the investigation of (Koptsik et al., 2015) soils 173
of technogenic wastelands formed under the influence of long-term emissions of Severonickel 174
Combine are acidic, depleted in nutrients, polluted with heavy metals, and badly eroded Natural 175
illuvial humic podzols have lost their upper organogenic and podzolic horizons as a result of erosion 176
and removal of protective vegetation cover. Atmospheric air pollution with SO4, disruption of 177
vegetation cover and changes in the morphological composition of soils increases their ability to 178
accumulate heavy metals (Kashulina et al., 2014, 2010). Accumulation of Ni and Cu in soils correlates 179
with winter fallouts (Kashulina, 2017).
180
The concentration and the composition of the pollutants in soils correlate with the emission from local 181
industry (Barkan and Lyanguzova, 2018). Smelters are one of the largest sources of environmental 182
pollution (Opekunova, 2016, 2004; Opekunova et al., 2006). The study is restricted to one of the 183
major industrial enterprises of the Murmansk region. The copper-nickel smelting plant 184
«Severonickel» (The Kola Mining and Metallurgical Company) built in the 1930s is located in 185
Monchegorsk at an altitude of about 123 m. Currently, copper-nickel matte is processed at this site.
186
The reconstruction of the production in Monchegorsk resulted in a 56.6% reduction in nickel 187
emissions from 2013 (Revich, 2020). Emissions from The Kola Mining and Metallurgical Company 188
(«Severonickel» in Monchegorsk and «Pechenganickel» Nickel-Zapolayrniy) decreased from 1627.1 189
Journal Pre-proof
9 tons in 1998 to 348.9 in 2017 for Ni, and from 1062.2 to 486.9 tons for Cu over the same period. A 190
certain indicator of atmospheric air pollution by metals is their content in the surface soil layer (Ettler, 191
2015a; Evdokimova et al., 2011; Evseev and Krasovskaya, 2017). The content of copper and nickel 192
in Monchegorsk soil exceeds MAC up to 5 times (Opekunova et al., 2006).
193
Mixed environmental conditions (natural anomalies and anthropogenic impact) generate the need to 194
assess the impact of the environment on public health.
195 196
2. Materials and methods 197
2.1 Methods of soil sampling 198
199
This research paper is focused on Ni and Cu distribution and the impact assessment in soils of the 200
Kola Peninsula, taking into account their concentration in impact and background areas (Figure 2).
201
Impact areas are normally more polluted than remote areas (Ettler, 2015). The background zone was 202
taken 30-50 km from the emission source while observing a decrease in the concentration of the main 203
pollutants (Ni and Cu).
204
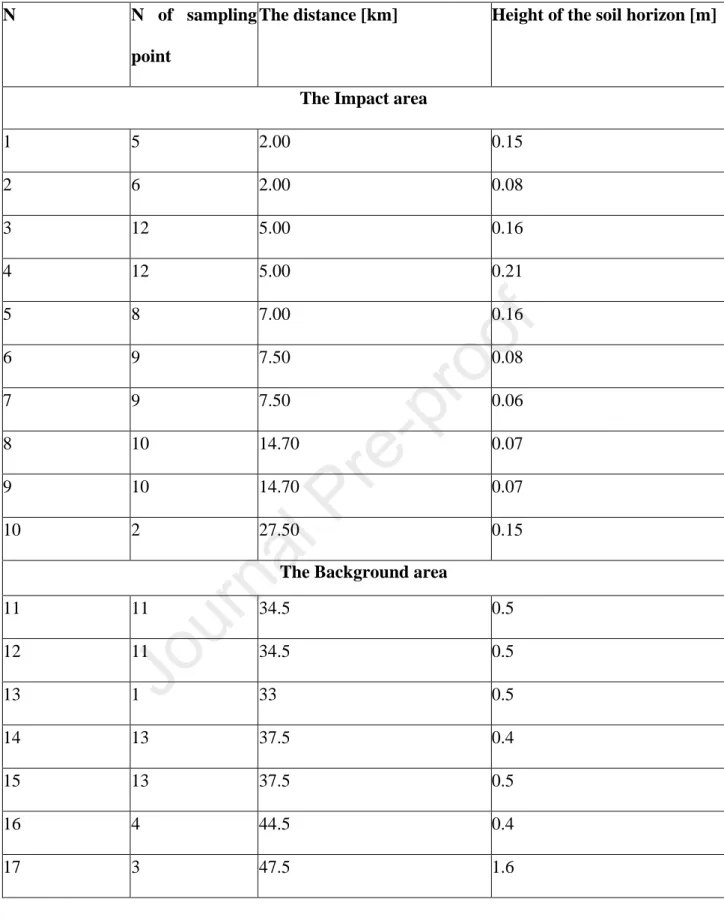
According to the prevailing wind direction, 13 soil sections (0-60 cm) were sampled by layer during 205
the expedition in July 2016 (total number of samples 28). The sampling locations are shown in Figure 206
2 and Table 2 in the Annex.
207 208 209
Figure 2. Sampling locations (А.) and study area (B.), industry-disturbed landscape (C.) and main 210
wind direction of Monchegorsk city (D.) 211
212
To assess the accumulation of heavy metals in different types of soils, the structure of their vertical 213
profile (from the surface of the soil down to the parent rock) is of particular importance. As a rule, 214
the soil profile consists of several layers, called genetic horizons, as they were formed as a result of 215
Journal Pre-proof
10 soil-forming processes caused by the genesis of the soil (National Atlas of Soils of the Russian 216
Federation [Nacional’nyj atlas pochv Rossijskoj Federacii], 2011).
217
All the samples we studied were taken at points belonging to the podzol soil type formed in cold areas 218
with a good leaching regime. On the Kola Peninsula, podzols with a low thickness of 15-50 cm are 219
typical. Podzols with higher thicknesses (layer of more than 50 cm) are not widespread (Elkshina and 220
Kupriyanova, 1970).
221
Podzols are characterized by a differentiated profile (Figure 3) consisting of litter 3–8 cm thick;
222
whitish, lightened due to the removal of coloring iron compounds, and humus of the podzolic or 223
eluvial horizon (topsoil) with a thickness of 2 to 20-30 cm; illuvial horizon (subsoil) of brown or 224
ocher tones, formed as a result of the illuvial accumulation of aluminum-ferruginous-humus complex 225
compounds, gradually turning into the parent rock (substratum) (National Atlas of Soils of the 226
Russian Federation [Nacional’nyj atlas pochv Rossijskoj Federacii], 2011).
227 228 229
Figure 3. Genetic horizon of podzol 230
231
Each soil layer plays a particular role in the accumulation processes of pollutants. In the current 232
research, we turn attention in particular to the subsoil. The smaller number of topsoil samples is due 233
to the eroded upper horizons at some sites, and the smaller number of substratum samples is due to 234
the highly cluttered area and the inability to deepen the soil section (Table 1). Thus, the majority of 235
samples are taken from the depth of 0.06-0.2 m – the subsoil. This depth corresponds to the illuvial 236
horizon according to the Russian classification of soils (National Atlas of Soils of the Russian 237
Federation [Nacional’nyj atlas pochv Rossijskoj Federacii], 2011). The subsoil is the main mineral 238
horizon that accumulates inorganic components, coming from the overlying layers (Adams and 239
Moore, 1983).
240 241
Journal Pre-proof
11 Table 1. Soil horizons collected for the investigation
242
N Soil layer Depth [m] Quantity of samples
1 Topsoil 0.06-0.08 6
2 Subsoil 0.06-0.2 16
3 Substratum 0.2-0.3 5
243
Sampling was carried out taking into account the local features of the structure of the soil profile: by 244
in accordance with the genetic horizons, but not evenly spaced in depth. Some samples taken at the 245
same depth belong to different genetic horizons (Annex, Table 3).
246
Soils intended for the determination of heavy metals are sampled with tools that do not contain metals.
247
Soil samples are packed in containers ensuring the preservation of small soil particles (bags made of 248
synthetic film, dense fabric, or water-resistant paper).
249 250
2.2. Sample preparation and analysis 251
252
Chemical analysis and sample preparation was conducted in the Research Laboratory for 253
Hydrogeochemistry (Tomsk Polytechnic University, Tomsk, Russia).
254
Sample preparation. Soil samples were naturally air-dried in the room prevented chemical pollution.
255
Debris was removed, and they were then sieved through a sieve (mesh size 1 mm) for later use.
256
To determine the total metal concentration, a soil sample of 2-3 g was weighed, placed into a PP 257
digestion vessel, and then concentrated HNO3 of high purityat a ratio of 1:10. Sample decomposition 258
is carried out in a microwave oven with a blank sample at 110-115℃ in 5-7 steps for 2 minutes. Then 259
the solution is diluted with 20% HNO3. 260
Then chemical elements were measured by an inductively coupled plasma mass spectrometer (ICP- 261
MS method) NexION 300D (PerkinElmer, USA).
262
Journal Pre-proof
12 Two heavy metals (Ni and Cu) were chosen for the research. These chemicals have similar toxic 263
properties, and they are the main pollutants of the area (Motuzova et al., 2004).
264
Nickel and its compounds s are toxic and carcinogenic (Rabinovitch and Rizhova, 2016). The most 265
common types of health impairment caused by Ni are respiratory, skin and cardiovascular diseases 266
(Chashschin et al., 1994). The increased nickel content in soils leads to endemic diseases: ugly forms 267
appear in plants and in animals; eye diseases are associated with the accumulation of nickel in the 268
cornea (McIlveen and Negusanti, 1994). The clark of nickel in World soils by Vinogradov is 40 269
mg/kg (Dobrovol’skij V.V., 2003). More recent clark estimates coincide with this value (Butovsky, 270
2005). In U.S. soils, Ni clark is much lower than world clark - 17 mg/kg (Dobrovol’skij V.V., 2003).
271
Nickel enters the soil as a result of fuel combustion and industrial emissions. In soils Ni accumulates 272
strongly in agrodern-podzolic gley soil (Vodyanitsky, 2008).
273
Copper is the third most used metal in the world (“VCI, Copper history/Future, Van Commodities 274
Inc.,” 2011). This metal has dual nature: essential at an optimum level, while toxic at high levels 275
(Ameh and Sayes, 2019). Cu expresses organophilic properties (McBride, 1989). Сu clark in U.S.
276
soils coincides with world clark and is equal to 20 mg/kg (Dobrovol’skij V.V., 2003). The main 277
source of copper in the soil is copper-nickel smelters (Ilyin, 1991).
278 279
3. Data processing technique 280
3.1. Descriptive statistics 281
282
Descriptive data analysis, including mean, standard deviation (SD), minimum and maximum 283
concentrations, variation coefficient, etc., was carried out. Together with SD, variation coefficient 284
(VC), which is SD/mean, was used to reflect the degree of discrete distribution of different metal 285
element concentrations, and to indicate indirectly the activeness of the selected element in the 286
examined environment. Histograms were also utilized to show the distributions of the metals (Annex, 287
Figure 1).
288
Journal Pre-proof
13 The accumulation of Ni and Cu has a similar nature in the research areas, thus for the rank correlation 289
analysis, the whole sampling was used. To calculate the correlation between Ni, Cu, and other heavy 290
metals, the whole sampling variety was taken.
291 292
3.2 The Impact assessment and Characteristic factors calculation with the USEtox model 293
3.2.1 General framework 294
The basics of the USEtox model developed on the Microsoft Excel platform (Figure 1, Annex).
295
According to the USEtox model, Impact score (IS, Formula 2) - the LCIA impact score for human 296
toxicity is expressed at midpoint level as cancer or non-cancer disease cases and endpoint level as 297
several of disability-adjusted life years [DALY] (Fantke et al., 2017). The LCIA impact score for 298
potential impacts of the chosen elements (Cu, Ni) is calculated using a weighted summation of the 299
released pollutants – Ni and Cu in soils (the mass – M, [kg], Formula 2) and substance specific 300
characterization factors (CF) obtained with the USEtox model (Formula 1).
301 302
IS = CF × Mx,i 303
Formula 1. The Impact Score calculation (Fantke et al., 2017) 304
Note: CF – characterization factor, M- the total mass of the element 305
306
Characterization factors for the potential human health damage [DALY/kg] of Ni (II) and Cu (II) for 307
the geo-zone «Central Asia» is taken from the USEtox model (Fantke et al., 2017) (Annex, Table 1).
308
The total mass of the element in soils (M) (Formula 2) is calculated according to the formula 309
developed by T. Bratec (F. Bratec et al., 2019; T. Bratec et al., 2019; Perminovaet al., 2017). The 310
total mass of the pollutant is derived from the concentration of the chemical element in soils (Cx,i) in 311
each studied area. This data is obtained analytically with the ICP-MS– geological data.
312 313
Journal Pre-proof
14 M = Cx,i× Vs × px
106 [kg]
314
Formula 2. M- total mass of the element calculation (F. Bratec et al., 2019; T. Bratec et al., 2019;
315
Perminova et al., 2017) 316
Note: Cx,i – metals concentration in soils; Vs - soils volume; 4) ps - bulk density of soils [kgi/mi3].
317 318
3.2.2 Impact score calculation modifications 319
In the current paper, we present the approach to modify the Impact score calculation. The 320
modification leads to reduce the lack of geological data limitation of the USEtox method. In the 321
USEtox only the topsoils (0.1 [m]) are considered in the CF calculation. In the research paper, we 322
modify the total soils volume calculation with different heights of the soil layer (Formula 3).
323 324
Vi = hi × Si 325
Formula 3. The volume of soils calculation 326
Note: hi – the height of soils, [m]; Si – the square footage of the research area, [m2] 327
328
Physical parameters of the soils are taken into account. For each studied area, the total volume of 329
soils is considered (Formula 3, Vs [m3]). The volume of soils here represents square footage (Si) of 330
the studied region and the height of the soil's horizon (hi). The bulk density of soils (pi), which is the 331
table value taken from the USEtox documentation [kgsoil/m3soil], and Vs is the volume of soils of each 332
considered region [m3].
333
The areas under research (background and impact areas) belong to 3 administrative units of the 334
Murmansk region: Kirovsk, Apatity, Monchegorsk catchment areas. Different sizes of the regions are 335
taken into account with the square footage parameter (Si) (Annex, Table 2).
336 337
Journal Pre-proof
15 4. Results and discussions
338
4.1 Statistical analysis results 339
340
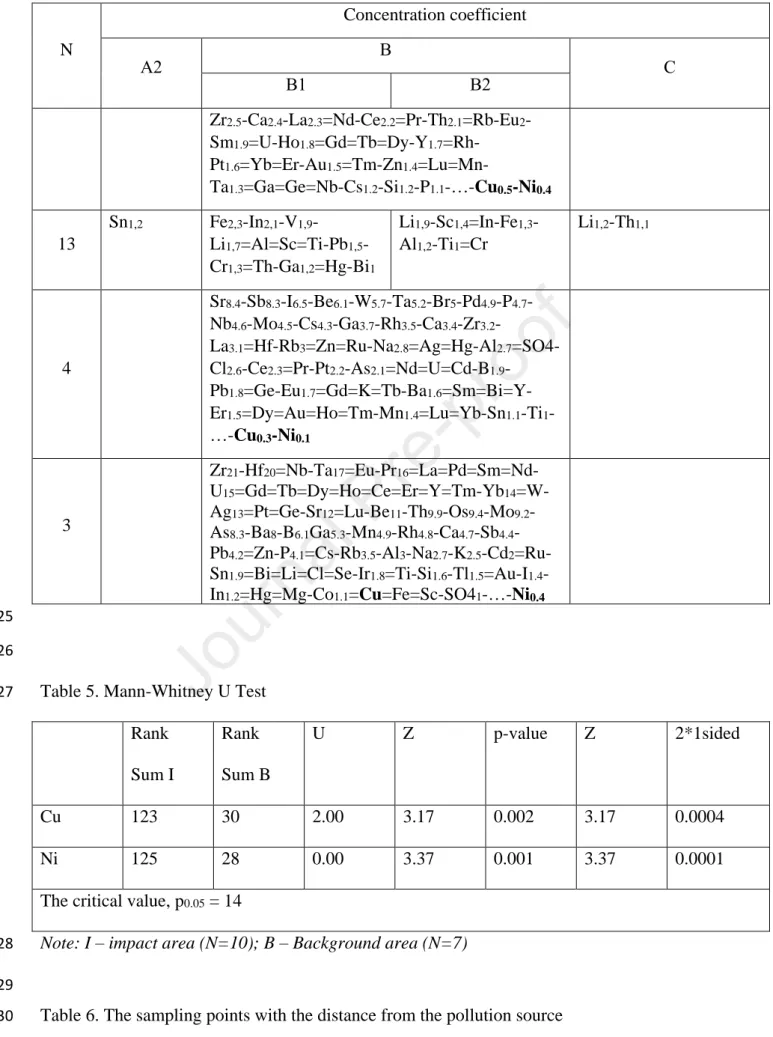
Analysis of the chemical composition of the mineral horizons of the Kola Peninsula soils shows that 341
the subsoil horizon accumulates the majority of the estimated pollutants (heavy metals, radioactive, 342
and REEs) (Annex, Table 4) in all sampling points. A large number of these pollutants have high 343
concentration coefficients (CC <2;3;5). Maximum CC is also noted in subsoils. The main components 344
of emissions to the environment (Ni, Cu) (Opekunova et al., 2006) are characterized by a high 345
concentration in all the considered mineral horizons of soils, both in the control and in the zone of 346
influence. On the leeward side 5 km from the mill, there is a decrease in Ni and Cu concentrations 347
(Figure 4-5), these elements accumulate the most.
348 349 350
Figure 4. The Ni concentrations in the Background (B) and in the Impact (I) areas, in different 351
distance from the source of the pollution 352
Note: Clark - S.R. Taylor, S.M. McLennan, 1985 – average concentration of Ni and Cu in the upper 353
continental crust (Taylor and McLennan, 1985) 354
N – number of sampling point, Distance [km] – distance from the source of pollution 355
356 357
Figure 5. The Cu concentrations in the Background (B) and in the Impact (I) areas, in different 358
distance from the source of the pollution 359
Note: Clark - S.R. Taylor, S.M. McLennan, 1985 – average concentration of Ni and Cu in the upper 360
continental crust (Taylor and McLennan, 1985) 361
N – number of sampling point, Distance [km] – distance from the source of pollution 362
363
Journal Pre-proof
16 Ni and Cu in this case or represent the most stable components of emissions or they are accumulated 364
due to natural factors.
365
Minimal concentrations of Ni and Cu (CC<1) are noted in soils of the background area, while other 366
heavy metals, radioactive and rare-earth elements in these samples have CC>1. The wide spectrum 367
of element accumulation in soils of the Kola Peninsula in points distant directly from the production 368
site is explained by its mixed geoecological situation. Data analysis demonstrates the difficult 369
ecological and geochemical situation in the study area. Opekunova et al. (Opekunova et al., 2006) 370
also revealed the content of a group of heavy metals in soils in the vicinity of Monchegorsk. Since 371
this work is devoted to the accumulation of heavy metals, further attention in the work is focused on 372
this group of chemical elements.
373
The wide range of accumulation of heavy metals in the soils of the Kola Peninsula is also 374
characterized by the presence of significant correlations between them. Heavy metals in general and 375
Ni and Cu as the main industrial pollutants of the research area have close chemical properties and 376
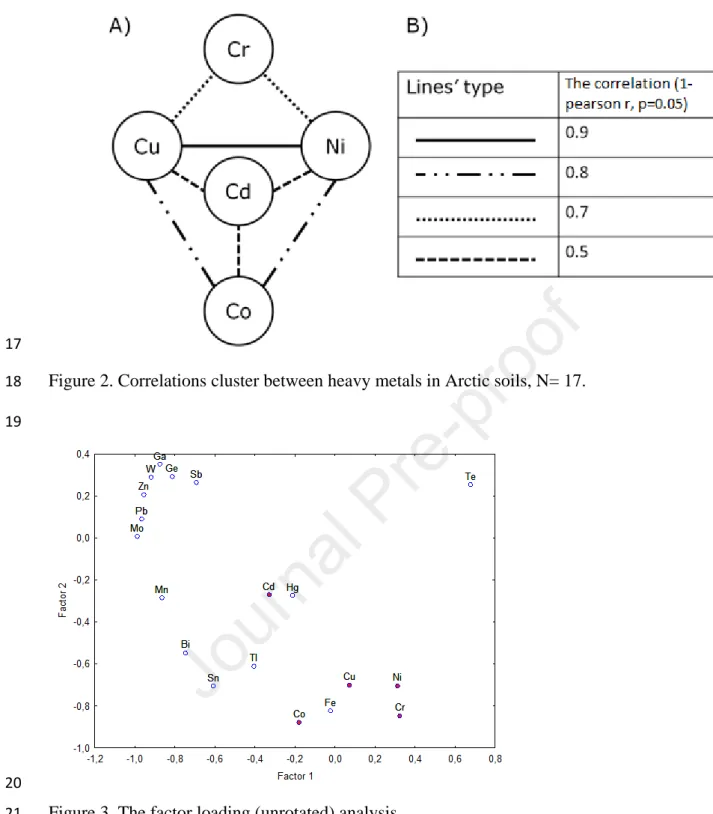
correlate in the soil (Figure 6). There is the strongest positive correlation between Cu and Ni 377
(Spearman rank correlation coefficient p0.05=0.9), (Annex, Figure 2). Heavy metals (Cr, Cd, Co) have 378
significant positive correlations with Cu and Ni. These elements according to factor loading analysis 379
are under the influence of one factor (Annex, Figure 3). Due to the absence of the other deposition, 380
but Cu and Ni in the area, the main factor affecting the whole group of the heavy metals is probably 381
industrial.
382
In the following diagram (Figure 6), we observe the graphical expression of the Ni-Cu correlation.
383
The strong positive correlation of these metals can be explained by the same source of accumulation 384
as well as their chemical mechanisms. There is probably a mix of the industrial specificities of the 385
area supports and the natural sources.
386 387 388
Journal Pre-proof
17 Figure 6. Cu - Ni correlation diagram, polynomial trend line (nsamples=17), R2 - reliability of 389
approximation 390
391
The statistical interpretation of the obtained results demonstrates the distribution of Ni and Cu in the 392
sampling variability. Ni and Cu concentrations in soils follow the lognormal distribution in the studied 393
soils (Figures 7-8). The lognormal distribution and the high variety coefficient reflect the 394
heterogeneity of the metal accumulation in soils. They are usually formed when several dependent 395
causes are present. Thus, it can be caused by the massive intake of chemicals from industrial 396
contamination and the natural deposition of the elements in the area. Due to the lognormal distribution 397
of the data the nonparametric statistics were applied to the sampling.
398 399
Figure 7. The Cu and Ni distribution in soils of the Impact zone [ppm]
Figure 8. The Cu and Ni distribution in soils of the Background zone [ppm]
400
According to the Mann-Whitney U test (Annex, Table 5); the averages of the compared sampling 401
varieties (Ni and Cu in soil background and impact zones) have a significant difference (Table 2).
402
The values of Ni and Cu in two investigated areas were compared, therefore.
403
Descriptive statistics of Ni and Cu concentrations in soils are presented for impact and background 404
areas in Table 2. The average concentration of Ni varies from 24.24 – 88.17 [ppm] in the Impact area, 405
and from 3.34 to 12.62 [ppm] in the background; Cu concentrations are in the gap from 14.17 to 60.66 406
[ppm] in the Impact and 6.76 -24.60 [ppm] in the background. For further comparison, the 407
arithmetical means were taken to avoid the underestimation of the results and to show the local 408
anomalies of the metal accumulation.
409 410
Table 2. Descriptive statistics 411
Journal Pre-proof
18
Impact area Background area
Ni Cu Ni Cu
Mean 55.0 33.3 9.3 11.4
SE 7.8 4.7 1.2 2.3
Min 24.2 14.2 3.3 6.8
Max 88.2 60.7 12.6 24.6
Median 50.4 30.1 9.7 9.7
VC 45 44 33 53
*S.R. Taylor, S.M.
McLennan, 1985
20 25 20 25
Note: mean – arithmetical mean [ppm], SE - Standard error, SD – standard deviation, CV – variation 412
coefficient [%], * S.R. Taylor, S.M. McLennan, 1985 – average concentration of Ni and Cu in the 413
upper continental crust (Taylor and McLennan, 1985) 414
415
The leading role of the anthropogenic nature of the heavy metal accumulations in the soils of the 416
impact area is supported in the Table 2. First, the mean concentrations of Ni - Cu by soil profile for 417
impact areas significantly over their concentration in soils of the background area. Ni arithmetic mean 418
concentration in soil impact areas is nearly 6 times higher than the background value. Whereas Cu is 419
approximately 3 times. The composition of the industrial pollution of the ecosystem from the 420
«Severonickel» vicinity includes Cu2S, CuFeS2, (Ni, Fe)9S8, metallic Ni, and Cu (Barkan V.Sh., 421
2008). Thus, pollutant composition is reflected in the high concentration of heavy metals in soils. The 422
mean values of Ni-Cu in the plant vicinity increase the continental crust as well (Taylor and 423
McLennan, 1985), at the same time values of the conditionally clean area is lower than literature data.
424
The anthropogenic origin of the pollution is supported by the fact that one of the largest industrial 425
enterprises in the Murmansk region is located in the study area (Sandimirov, 2020).
426
Journal Pre-proof
19 The background soils exceeding the maximum permitted concentration of the heavy metals in soils 427
are probably polluted too. Unlike the impact area, where the depositions of Ni and Cu are reported 428
(Figure 1) soils of the conditionally clean area have no natural occurrence of these metals. At the 429
same time wind destination is the main factor in the pollutants spread.
430
The intensive pollution of the area with heavy metals reported by many (Evseev and Krasovskaya, 431
2017; Kashulina, 2017; Kyllönen et al., 2020; Liisa et al., 1997) and significant level of the pollution 432
leads us to propose the anthropogenic nature of their accumulation and distribution.
433
We assume that the industrial intake of Cu and Ni corresponds to the general trend of their 434
concentration. In this case, the spatial distribution from the source of pollution should be investigated.
435
Therefore, the variation of the heavy metals accumulation in different sampling points is observed.
436
As we can see the distance from the source of pollution is a critical parameter of any environmental 437
monitoring. Data represented in the table was also compared according to the sampling point 438
(background: clean area). The graphical interpretation of the obtained results demonstrates the main 439
trends of the distribution of heavy metals in the vicinity of the industrial plants (Figure 4-5).
440
We observe that Ni and Cu follow the same distribution trend. We see that the majority of the soils 441
taken in the zones far from the source of the industrial pollution contain lower concentrations of both 442
metals.
443
As we can see from the wind direction vector, the climate of the research area determines the equal 444
influence of wind transfer. At the same time, zones of landscape degradation reflect the main wind 445
destination (Figure 2) and the pollution flow too. Thus, the sampling point 5 km (point N 12, Annex, 446
Table 3) away from the source of the contamination is placed in the Impact area but from the leeward.
447
Consequently, we observe the reduction of Ni and Cu concentrations at this point.
448
Massive intake of the pollutants is usually characterized by the heterogeneity of their accumulation, 449
with the consequent augmentation of the concentration coefficient. Here, we see that the 450
concentration of Ni and Cu calculated for soils from the background vary less than for the impact 451
Journal Pre-proof
20 area. This can be explained by the multiple inputs (pollution and natural deposition) of those 452
chemicals in the anthropogenic loaded area.
453
Accumulation of heavy metals is also changed by the genetic characteristics of the soil’s horizons.
454
Investigated in the current paper «B» horizon of soils or «subsoil» are normally covered with the litter 455
and top-soils and less contaminated (Elsukova et al., 2019). However, leaning on the obtained results 456
subsoil horizons of the Imandra lake vicinity are also polluted. Pollutants migrate from the surface 457
layer to the deeper horizons. Similar processes are noted in zones of industrial vicinity by other 458
authors (Kim et al., 2020).
459
The accumulation capability of the deeper soil layers highlights the necessity of their investigation as 460
a possible source of pollution. The results of our studies show that soils of the Kola Peninsula 461
accumulate a significant value of Cu and Ni, in the impact and background areas, which poses a 462
potential threat to human health. In this regard, it is necessary to assess the toxicity of individual 463
elements for the human body.
464 465
4.2 Human health impact assessment 466
467
Site-specific characteristics of the researched areas (as maternal rock composition) and massive 468
environmental pollution of the area with Ni and Cu determine negative conditions for the population 469
health in the area.
470
To simplify the reading of the resulting charts, we repeat the sampling map below (Figure 10).
471
We observe 2 trends in the obtained results:
472
1) The trend of Ni and Cu gross values (concentrations) distribution correlates with the IS values.
473
The first mineral horizon (topsoils) shows the lowest element’s concentrations (Annex, Table 3). It 474
is logical to assume that IS of the surface layer will be the lowest one. We conclude, that scoping the 475
“active” layer only (0.1 [m]) (de Souza et al., 2017), when heavy metals vary greatly depending on 476
the local properties of the soil considered (Hellweg et al., 2005; Stoessel et al., 2018), can lead to an 477
Journal Pre-proof
21 underestimation of the negative influence on the population health. Local data propose an approach 478
to counteract over- and underestimation of metal toxicity in the default USEtox assessment (Hedberg 479
et al., 2019). Despite the fact that USEtox model succeeds in mimicking the results of the spatially 480
differentiated model (Kounina et al., 2014), soil parameters as thickness of the topsoil layer, or linking 481
soils with subsoil (Karim et al., 2019) should be considered.
482
2) When heavy metals concentrations depend on the soil profile properties, consequent variation 483
between default and modified IS values is observed. That supports the hypothesis that consideration 484
of specific features of the soil profile-such as erosion of the upper horizons significantly changes the 485
results of the human health impact assessment. Obtained results show that the distribution of elements 486
in soil profiles is characterized by an increase in Cu, Ni content with depth. Thus, dusting of the 487
topsoil horizons can be considered as specific geographic conditions of the studied area. Models 488
should be adapted and parameterized for different local conditions (Gentil et al., 2020).
489 490
Journal Pre-proof
22 Figure 9. Ni (A.), and Cu (B.) Impact score calculation modified (m) and
default (d) calculated for different soil layers in the Background and Impact area
Note: h, [m] – height of the soil horizon, N – number of sampling point, Distance [m] – distance from the source of pollution
Figure 10. Sampling locations (А.) and study area (B.)
491
Journal Pre-proof
23 Specific geographic conditions of the studied area do not allow the calculation of the standard height 492
of the soil horizon to be done. Due to the geographical conditions in the vicinity of Lake Imandra low 493
power podzols with poorly developed humus layer and litter are formed. These soils due to their depth 494
of ~0.1 [m] may correspond to the B horizon, which accumulates the main mass of chemical elements.
495
Also, the topsoils can be disturbed by industrial activity and intensive environmental pollution, that 496
leads to subsoils scalping (Wu et al., 2020; Yu et al., 2014). Soils from the deeper horizons can be 497
spread with the wind flow and consequently affect the local population. Environmental fate of the 498
pollutants as their distribution through the soil horizon should be connected with the human toxicity 499
assessment (Núñez and Finkbeiner, 2020). It is important to admit the geological and ecological 500
characteristics of the region in the impact assessment process. For example, for further impact 501
assessment research such site-specific characterization as landscape conditions or their technogenic 502
disruption.
503 504
Journal Pre-proof
24 5. Conclusion
505 506
Studies of heavy metal pollution in the Kola Peninsula are relevant, in terms of assessing the state of 507
the environment and in terms of the impact on public health. Pollution of the surroundings of 508
Severonickel Plant by heavy metals is undeniable and is emphasized both by this work and by other 509
authors (Bazova, 2013; Evseev and Krasovskaya, 2017; Kashulina, 2018; Kyllönen et al., 2020; Liisa 510
et al., 1997).
511
The results of our work demonstrate a wide range of accumulation of chemical elements in the subsoil 512
horizon, both in the area adjacent to the plant and in the conditional background area. Factor and the 513
correlation analysis between Ni and Cu and a similar trend of their accumulation, allow us to propose 514
that they have similar source of origin. The results emphasize the role of subsoils in the accumulation 515
of the main number of pollutants in the studied soils. To ensure a more comprehensive and accurate 516
assessment of metal contamination results, two assessment methods of impact score, and 517
characteristic factors calculation with the USEtox model were applied.
518
As it was noted earlier, the research area is characterized by man-made disturbance of the soil profile 519
and erosion of the upper horizons. While the results of the work highlight the features and height of 520
soil horizons in the profile as a critical parameter to assess the impact on the environment. For such 521
areas it is necessary to make an adapted calculation of the human health Impact Score, taking into 522
account the characteristics of the local landscape.
523 524
Acknowledgments 525
526
The statistical data processing is supported by State program RF «Science», project FSWW-35 0022- 527
2020.
528 529
Journal Pre-proof
25 References
530
Adams, F., Moore, B.L., 1983. Chemical Factors Affecting Root Growth in Subsoil Horizons of 531
Coastal Plain Soils. Soil Science Society of America Journal 47, 99–102.
532
Alloway, B.J. (Ed.), 2013. Heavy Metals in Soils, Environmental Pollution. Springer Netherlands, 533
Dordrecht. https://doi.org/10.1007/978-94-007-4470-7 534
Alquezar, C., Felix, J.B., McCandlish, E., Buckley, B.T., Caparros-Lefebvre, D., Karch, C.M., Golbe, 535
L.I., Kao, A.W., 2020. Heavy metals contaminating the environment of a progressive 536
supranuclear palsy cluster induce tau accumulation and cell death in cultured neurons. Scientific 537
Reports 10, 569. https://doi.org/10.1038/s41598-019-56930-w 538
Ameh, T., Sayes, C.M., 2019. The potential exposure and hazards of copper nanoparticles: A review.
539
Environmental Toxicology and Pharmacology. https://doi.org/10.1016/j.etap.2019.103220 540
Barkan V.Sh., 2008. Soil Pollution with Nickel and Cu-prum Caused by the Industrial Source 541
(Metallurgical Dust) [Zagryaznenie pochvy nikelem i medyu ot promyshlennogo istochnika 542
metallur-gicheskikh pyley], in: Ecological Problems in the Northern Regions and the Ways to 543
Solve Them: Proceedings of Russian Research Conference with in-Ternational Participation.
544
Apatity, pp. 46–51.
545
Barkan, V.SH., Lyanguzova, I.V., 2018. Change of contamination level of organogenic horizon of 546
al-fe-humus podzols with reduction of aerotechnogenic load (Kola Peninsula) [Izmenenie 547
urovnya zagryazneniya organogennogo gorizonta al-fe-gumusovyh podzolov pri umen’shenii 548
aerotekhnogennoj nagruzki. Eurasian Soil Science [Pochvovedenie] 338–346.
549
https://doi.org/10.7868/S0032180X18030085 550
Barsova, N., Yakimenko, O., Tolpeshta, I., Motuzova, G., 2019. Current state and dynamics of heavy 551
metal soil pollution in Russian Federation—A review. Environmental Pollution 249, 200–207.
552
https://doi.org/10.1016/j.envpol.2019.03.020 553
Bazova, M.M., 2013. Metals and Metalloids in Natural Waters of the Kola North and Their 554
Environmental Hazard [Metally i metalloidy v prirodnyh vodah Kol’skogo severa i ih 555
ekologicheskaya opasnost’]. Vesntik of the Tyumen State University 12, 189–198.
556
Belyanovskaya, A., Laratte, B., Perry, N., Baranovskaya, N., 2019. A regional approach for the 557
calculation of characteristic toxicity factors using the USEtox model. Science of the Total 558
Environment 655, 676–683. https://doi.org/10.1016/j.scitotenv.2018.11.169 559
Belyanovskaya, A., Soktoev, B., Laratte, B., Ageeva, E., Baranovskaya, N., Korogod, N., 2022.
560
Influence of local geological data and geographical parameters to assess regional health impact 561
in LCA. Tomsk oblast’, Russian Federation application case. Environmental Science and 562
Pollution Research. https://doi.org/10.1007/s11356-022-21784-9 563
Belyanovskaya, A.I., Laratte, B., Rajput, V.D., Perry, N., Baranovskaya, N. v., 2020. The Innovation 564
of the characterisation factor estimation for LCA in the USETOX model. Journal of Cleaner 565
Production 122432. https://doi.org/10.1016/j.jclepro.2020.122432 566
Bratec, F., Bratec, T., Marty, P., Troussier, N., Diaz-Pichardo, R., 2019. Spatial Variability of Human 567
Health Impacts: Application to a Biorefinery Process Implementation. Proceedings of the Design 568
Society: International Conference on Engineering Design 1, 985–994.
569
https://doi.org/10.1017/dsi.2019.104 570
Journal Pre-proof
26 Bratec, T., Kirchhübel, N., Baranovskaya, N., Laratte, B., Jolliet, O., Rikhvanov, L., Fantke, P., 2019.
571
Towards integrating toxicity characterization into environmental studies: case study of bromine 572
in soils. Environmental Science and Pollution Research 26, 19814–19827.
573
https://doi.org/10.1007/s11356-019-05244-5 574
Butovsky, R.O., 2005. Heavy metals as technogenic chemical pollutants and their toxicity for soil 575
invertebrates. Agrochemistry 4, 73–91.
576
Chashschin, V.P., Artunina, G.P., Norseth, T., 1994. Congenital defects, abortion and other health 577
effects in nickel refinery workers. Science of the Total Environment, The 148, 287–291.
578
https://doi.org/10.1016/0048-9697(94)90405-7 579
Chin-Chan, M., Navarro-Yepes, J., Quintanilla-Vega, B., 2015. Environmental pollutants as risk 580
factors for neurodegenerative disorders: Alzheimer and Parkinson diseases. Front Cell Neurosci 581
9, 124. https://doi.org/10.3389/fncel.2015.00124 582
Dauval’ter, V.A., Kashulin, N.A., 2015. Influence of mining and metallurgical enterprises on 583
chemical composition of bottom sediments of Imandra Lake, Murmansk Region [Vliyanie 584
deyatel’nosti gorno-metallurgicheskih predpriyatij na himicheskij sostav donnyh otlozhenij 585
ozera Imandra, Murmanskaya . Biosfera 7, 295–313.
586
de Souza, E.S., Texeira, R.A., da Costa, H.S.C., Oliveira, F.J., Melo, L.C.A., do Carmo Freitas Faial, 587
K., Fernandes, A.R., 2017. Assessment of risk to human health from simultaneous exposure to 588
multiple contaminants in an artisanal gold mine in Serra Pelada, Pará, Brazil. Science of The 589
Total Environment 576, 683–695. https://doi.org/10.1016/j.scitotenv.2016.10.133 590
Dobrovol’skij V.V., 2003. Basics of Biogeochemistry [Osnovy biogeohimii]. ACADEMIA, 591
Moscow.
592
Doyi, I., Essumang, D., Gbeddy, G., Dampare, S., Kumassah, E., Saka, D., 2018. Spatial distribution, 593
accumulation and human health risk assessment of heavy metals in soil and groundwater of the 594
Tano Basin, Ghana. Ecotoxicology and Environmental Safety 165, 540–546.
595
https://doi.org/10.1016/j.ecoenv.2018.09.015 596
Elkshina, YU.A., Kupriyanova, V.V. (Eds.), 1970. Surface water resources of the USSR. Т. 1. Kola 597
Peninsula [Resursy poverhnostnyh vod SSSR. T. 1. Kol’skij poluostrov]. Hydrometeorological 598
publishing house, Leningrad.
599
Elsukova, E.Yu., Opekunova, M.G., Opekunov, A.Yu., 2019. Technogenic transformation of heavy 600
metal streams in soils in regions under influence of copper-nickel production. International 601
research journal 12, 118–124. https://doi.org/10.23670/IRJ.2019.90.12.024 602
Ettler, V., 2015. Soil contamination near non-ferrous metal smelters: A review. Applied 603
Geochemistry 64, 56–74. https://doi.org/10.1016/j.apgeochem.2015.09.020 604
European Commission -- Joint Research Centre -- Institute for Environment and Sustainability, 2010.
605
International Reference Life Cycle Data System (ILCD) Handbook -- General guide for Life 606
Cycle Assessment -- Detailed guidance, Constraints. https://doi.org/10.2788/38479 607
Evdokimova, G.A., Mozgova, N.P., Kalabin, G.V., 2011. Contents and toxicity of heavy metals in 608
soils of the zone affected by aerial emissions from the Severonikel enterprise. Eurasian Soil 609
Science 44, 237–244.
610
Journal Pre-proof
27 Evseev, A. V., Krasovskaya, T.M., 2017. Toxic metals in soils of the Russian North. Journal of 611
Geochemical Exploration. https://doi.org/10.1016/j.gexplo.2015.05.018 612
Evtyugina, Z., Asming V., 2013. Osobennosti formirovaniya sostava infil’tracionnyh vod v usloviyah 613
aerotekhnogennogo zagryazneniya. Vestnik of MSTU : Scientific journal of Murmans State 614
Technical University 16, 73–80.
615
Evtyugina, Z.A., Guseva, N.V., Kopylova, J.G., Vorobeva, D.A., 2016. Chemical composition of 616
natural waters of contaminated area: The case for the Imandra Lake catchment (the Kola 617
Peninsula). IOP Conference Series: Earth and Environmental Science 33.
618
Fantke, P., Bijster, M., Guignard, C., Hauschild, M., Huijbregts, M., Jolliet, O., Kounina, A., Magaud, 619
V., Margni, M., McKone, T., Posthuma, L., Rosenbaum, R.K., van de Meent, D., van Zelm, 2, 620
R., 2017. USEtox® 2.0, Documentation version 1. https://doi.org/10.11581/DTU:00000011 621
Gentil, C., Fantke, P., Mottes, C., Basset-Mens, C., 2020. Challenges and ways forward in pesticide 622
emission and toxicity characterization modeling for tropical conditions. The International 623
Journal of Life Cycle Assessment 25, 1290–1306. https://doi.org/10.1007/s11367-019-01685-9 624
Guseva N.V., Vorobeva D.A., Evtyugina Z.A., 2020. Features of interaction in the water–rock 625
system: a case study of the Imandra lake catchment (the Kola peninsula). Bulletin of the Tomsk 626
Polytechnic University. Geo Аssets Engineering 331, 177–188.
627
https://doi.org/10.18799/24131830/2020/8/2779 628
Hauschild, M.Z., Huijbregts, M., Jolliet, O., Macleod, M., Margni, M., van de Meent, D., Rosenbaum, 629
R.K., McKone, T.E., 2008. Building a Model Based on Scientific Consensus for Life Cycle 630
Impact Assessment of Chemicals: The Search for Harmony and Parsimony. Environmental 631
Science & Technology 42, 7032–7037. https://doi.org/10.1021/es703145t 632
Hedberg, J., Fransson, K., Prideaux, S., Roos, S., Jönsson, C., Odnevall Wallinder, I., 2019.
633
Improving the Life Cycle Impact Assessment of Metal Ecotoxicity: Importance of Chromium 634
Speciation, Water Chemistry, and Metal Release. Sustainability 11, 1655.
635
https://doi.org/10.3390/su11061655 636
Hellweg, S., Fischer, U., Hofstetter, T.B., Hungerbühler, K., 2005. Site-dependent fate assessment in 637
LCA: transport of heavy metals in soil. Journal of Cleaner Production 13, 341–361.
638
https://doi.org/10.1016/j.jclepro.2003.10.003 639
Ilyin, V.B., 1991. Heavy metals in the soil - plant system [Tyazhelye metally v sisteme pochva - 640
rastenie]. Nauka, Siberian Branch, Novosibirsk.
641
Karim, R.-A., Deschênes, L., Bulle, C., 2019. Regionalized aquatic ecotoxicity characterization factor 64