Dans le premier chapitre, section I.1, nous présentons les mécanismes moléculaires méiotiques qui sous-tendent la recombinaison. Dans la section II.2, nous décrivons certains des principaux modèles d’étude de la distribution des CO.
Meiosis
- The phases of meiosis
- Pairing of homologs during prophase I
- Double strand break (DSB) dependent pairing and the Synaptonemal
- Molecular mechanisms of recombination
- Postsynaptic phase
The bits will then fuse and form full-length LE as part of the SC (Schalk et al., 1998). The proteins responsible for CE nucleation (SCP1 protein, in mammals and ZMM proteins, in yeast) polymerize along homologs leading to the full assembly of the SC at mid-pachytene (Meuwissen et al., 1997; Zickler , 2006).

Recombination
- Distribution of recombination events
- DSB distribution
- CO and NCO distribution
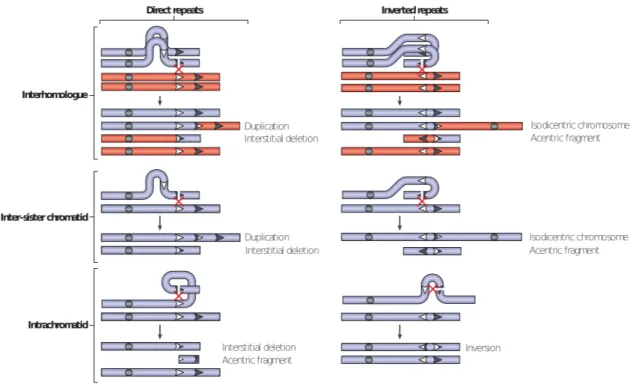
- Non-allelic homologous recombination (NAHR)
- Interference between recombination products
- Differences in recombination
- Differences among species
- Differences among sexes and age classes
- Differences among individuals of the same species
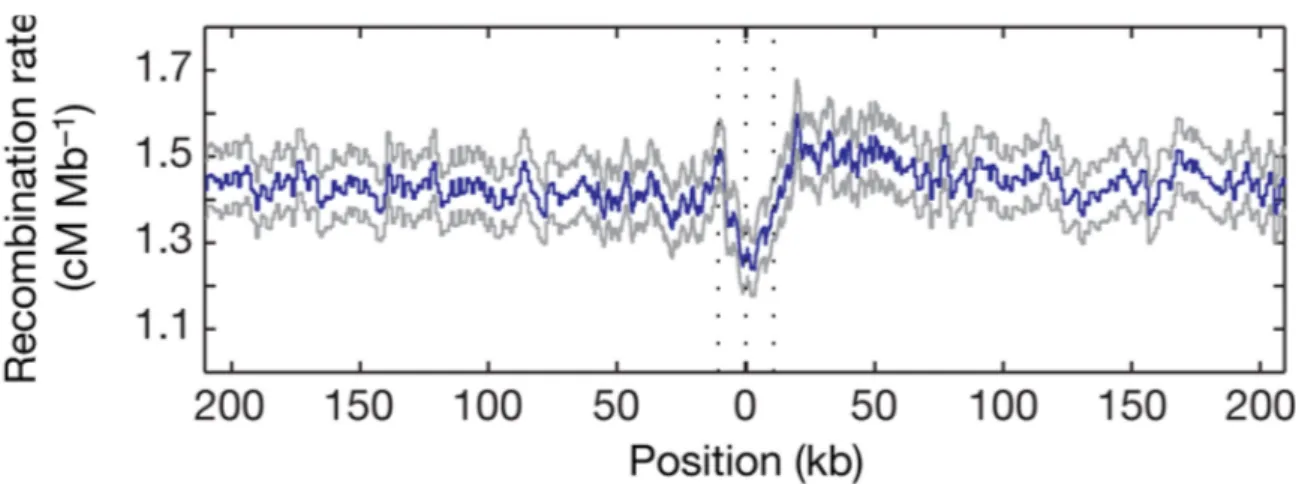
A degenerate 13-mer sequence motif (CCNCCNTNNCCNC) has been identified in association with human CO hotspots (Myers et al., 2008) (figure I.10). The function of this motif in humans has been associated with the binding of the zinc finger protein PRDM9 (Myers et al., 2009).

Biased gene conversion (BGC)
- Meiotic drive
- The molecular mechanism of GC biased gene conversion
- Genomic evidence for gBGC
- Impact of gBGC on the genomic landscape: isochores
PAR is characterized by a high rate of recombination (Soriano et al., 1987), which led to a rapid increase in GC content in the portion of Fxy that overlaps it. Another possible explanation was a differential bias in the pattern of mutation along the genome (Wolfe et al., 1989).

Conclusion
- Genetic markers
- Genetic maps
- Ordering markers
- Calculating genetic distances
- Sex-averaged and sex-specific genetic maps
- Linkage Disequilibrium
- Quantifying LD and recombination
- HapMap Project
- Potential biases in estimating recombination with LD
- Sperm-typing
- Gene conversion rates
Individuals in the first generation (F1) can then be crossed with their parents to produce the F2 generation (backcross). As in Figure II.2 I., the alleles of the two markers (A/a and B/b) are always transmitted according to their parental association (AB and ab). In the case of small intervals (less than 10 cM), the recombination frequency and the genetic distance are equivalent (Kosambi, 1944).
In Figure II.8.b, the LD pattern in a region of the human MHC allows the identification of two potential CO hotspots (vertical arrows) between two LD blocks.

Modeling the distribution of recombination events
- Counting model
- Mechanical Stress Model
- Polymerization model
- Recombination and karyotype
The left panel depicts the ray-film demonstration of the mechanical stress model proposed by Kleckner et al. In the case of the counting model, the shape parameter is the number of Poisson events (DSB) required to provide a CO, m+ 1. Additional COs are generated towards each end of the chromosome according to the counting model.
For a film of length G, one parameter of the model is N, the number of DSBs (also called "defects" in the model).

The impact of biased gene conversion on the nucleotide composition
Equilibrium GC-content
- Estimating parameters
Nevertheless, a trade-off must be found between the number of parameters to be estimated and the biological reality of the model. Under the assumption of independence between locations in a sequence, the probability of the alignment is the product of the probabilities at each individual location. Maximizing the likelihood functions for each parameter yields estimates of the substitution frequencies.
In the case of neighbor-dependent substitutions, the probability of a tree is no longer a product of the probabilities at all sites.

Theoretical gBGC model
Effect of biased gene conversion on nucleotide composition 75 when consensus cannot be reached. For each branch, substitution frequencies between ancestral and present-day sequences are then estimated using a maximum likelihood approach (Arndt et al., 2003). A nucleotide in a triplet of sites is replaced with the one with the highest probability given the substitution matrix and the neighboring nucleotides.
These estimates were also performed along a three-species tree, human, chimpanzee, macaque, or from alignments between ancestral (consensus) sequences and present-day sequences of transposable elements (Arndt et al., 2003; Webster et al.
Our model on the effect of gBGC on the frequency of deleterious
In collaboration with Laurent Duret, Anamaria Necsulea, David Cooper and Peter Stenson, we began work on quantifying the role gBGC plays in the maintenance of deleterious alleles in the human population (Nec¸sulea et al., 2011). . Our approach was based on simulations of the effect of gBGC on allele frequencies in a population of finite size. From Nec¸sule et al. the main difference is that recessive alleles are eliminated from the population very quickly and only a few can reach non-zero frequencies.
These results were recently confirmed by a theoretical study of the effect of mutation, selection, drift and gBGC on the fate of deleterious mutations (Gl´emin, 2010).

Conclusion
We also present here our simulations of the impact of gBGC on the maintenance of deleterious mutations in the human population. Our current understanding of the molecular mechanisms of recombination is the result of experiments with a few model organisms. In chapter II.2 we provide an overview of the different models of the impact of interference-related mechanisms on the distribution of COs along the length of chromosomes.
The physical length, expressed in Mb, is a measure of the number of nucleotides that make up the chromosome.

Methods and data
Modeling the influence of karyotype on the recombination pattern . 87
- Linear and non-linear least squares
- Confidence interval
- Comparing and grouping species
To avoid convergence towards local minima, for each of the two parameters we tested initial values ranging from 0.5 to 200. For simplicity and time considerations, we decided to use the following initial values for each species in our data set: for r slope the linear model of Li and Freudenberg (2009), which we previously fitted to the data; and for PI the minimum value of the physical length of the chromosome. All τ(θi) are then interpolated and the CI endpoints are found by comparing the τ and t distributions.
Given that for most species, chromosomes lie mostly in the linear part of the model, the absence of data points in the 50 cm plateau results in large CIs for the PI parameter.

Data
- Sex-averaged maps
- Sex-specific vertebrate genetic maps
The purpose of estimating the parameters r and PI is to compare them between species to find similarities, but also to better understand the differences in the recombination mechanism. The group Primata has a maximum divergence time of about 25 million years (Myr) (Rhesus Macaque Genome Sequencing and Analysis Consortium, 2007), while that of Teleostei contains species that diverged ∼323 Myr ago (Kasahara et al., 2007). Laurasiatheria Equus caballus Horse (Swinburne et al., 2006) Laurasiatheria Canis familis Dog (Wong et al., 2010; . DB-DogMap) Laurasiatheria Bos taurus Cow (Arias et al., 2009) Laurasiatheria Ovis aries Sheep (Poissant et al. 2010) Laurasiatheria Sus scrofa Pig (Vingborg et al., 2009) Metatheria Monodelphis domestica Opossum (Samollow et al., 2007).
Teleostei Danio rerio Zebrafish MGH zemljevid (DB-ZFIN) Teleostei Oryzias latipes Medaka (Ahsan et al., 2008; . DB-MedakaMap).
Inter-species differences in CO number and distribution
Estimates of the sex-averaged CO interference length and rate of COs 91
- Invertebrate parameter values
- Examining the interference parameter
- Resemblance among species
Eliminating chromosomes 1 and 14, which show the highest dispersion (figure III.4), both estimates become equal. Similar to vertebrates (figure III.4), the nonlinear model fits the data very well. The failure of the nonlinear model to correctly estimate the inter-CO distance is.
Estimates of the PI interference parameter for vertebrates and invertebrates are directly proportional to the physical length of the chromosomes (tables III.2, III.3 and I.2).

Heterochiasmy in vertebrates
- Parameter values
- Comparing male and female
The predicted values of the corresponding parameters along with their precision are reported in Table III.5. There is good agreement between predicted values of PI (Table III.5) and experimentally derived values of the interference strength (Table III.4). The values in Table III.4 are expressed either in number of NCOs (H. sapiens), Mb (M. musculus) or % of SC (C. familiaris male).
The prediction of the interference parameter PI is highly variable, leading to large CIs (Table III.6).

Conclusion
The parameter is similar to the slope of the linear model for most species. However, analysis of substitution patterns in Alu elements along all autosomes showed that the GC* content of the region is more strongly associated with the rate of local recombination in males than in females (Webster et al., 2005). The only vertebrate for which the effect of heterochiasmy on the GC-content of sequences was previously analyzed was the human (Webster et al., 2005; Duret and Arndt, 2008).
This difficulty has been overcome by inferring the substitution pattern in transposable elements (TE) (Arndt et al., 2003; Webster et al., 2005).

Materials and Methods
- Sex-specific impact in vertebrates
- Chromosome localization
- Quantifying the impact on GC*
- The particular case of the dog
- Cause-effect implications
- Reviewing the hypothesis of sex-specific impact
This result implies that the gender average KOR is an equally good predictor of the nucleotide composition (explaining between 14 and 38% of the variability) (table IV.5). We conclude that the sex mean COR and LDT are good predictors of the GC*, in all species. Together with the weak correlation between sex-specific KORs (table IV.6), these results suggest that the relationship between genomic features and local KORs is mediated differently in the two sexes (Wong et al., 2010).
Moreover, in man, we find that the COR/GC* correlation in interstitial regions of chromosomes is stronger in females than in males (table IV.3.

Discussing the methodology
Using TEs
However, the conclusions we draw in the human genome, using TEs, hold true for the human-chimpanzee-macaque non-coding triplicate sequences from Duret and Arndt (2008) (table IV.7). It follows that reducing this limitation, the number of data points is similar between this analysis (table IV.8) and the previous unfiltered data (table IV.6). Conclusions on the difference between sex-specific influence and chromosome localization remain unchanged after applying this divergence filter (table IV.8).
Duret and Arndt (2008) our estimates of GC*/current GC correlation coefficients are much higher than previously reported (Table IV.6).

Window length
When a hotspot covers a neutrally evolving region, it can cause biases in the substitution pattern, such as the GC bias induced by gBGC. However, once the recombination hotspot has died away, the recombination-induced bias will also disappear and the local GC content is expected to decrease below an AT-biased mutation rate (Sueoka, 1988; Hershberg and Petrov, 2010). The mean substitution rates inferred on long time scales, in 1 Mb windows, generate a GC* that will fluctuate around the local genomic GC content, explaining the increase in GC*/current GC correlation with the increase in divergence.
While recombination hotspots are short-lived, chromosomal regions, such as telomeres, consistently experience recombination events and are thus informative of the time-averaged recombination rate.
Conclusion
The analysis of base composition characteristics based on TEs has proven to be a valuable tool in the study of patterns of genome evolution. Furthermore, we investigated the effect of substitution patterns on the evolution of the GC content. Statistical properties of the number of recombination events in the history of a sample of DNA sequences.
A first genetic linkage map of the rhesus macaque (macaca mulatta) genome using human microsatellite loci. Molecular genetic variation in the centromeric region of the x chromosome in three Drosophila ananassae populations.


