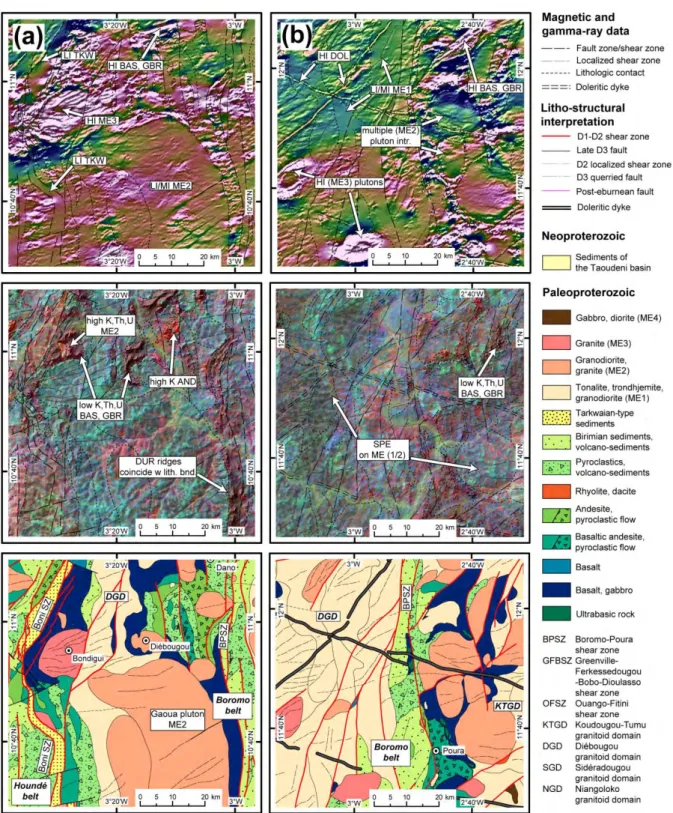
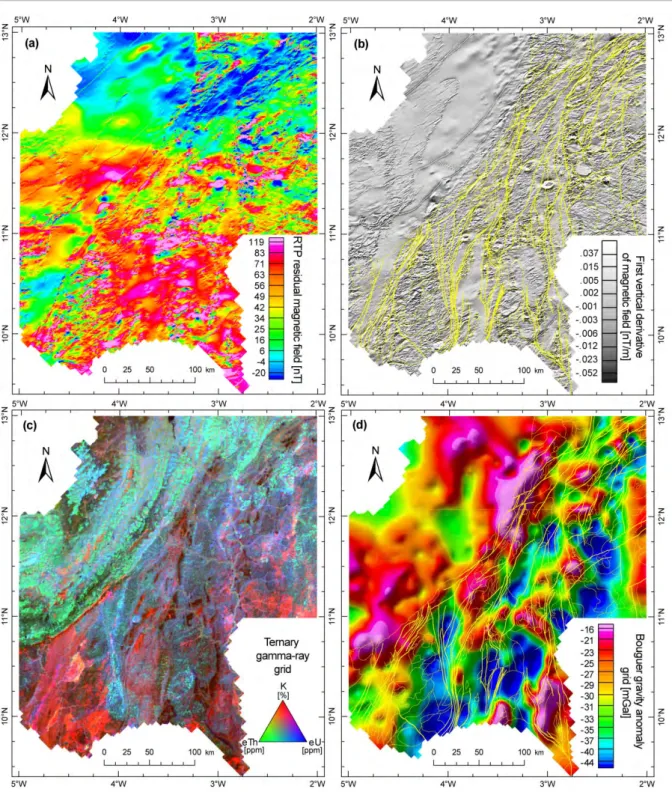
(c) – The Banfora Belt; (d) – The contact zone between the western edge of the Houndé belt and the Sidéradougou GD. The names of the greenstone belts, granitoid domains (GD) and large Birimian (volcanic) sedimentary units referred to in the text are indicated. Greenstone belts and associated granitoid domains form the Paleoproterozoic domain of the West African craton.
Introduction
De plus, les données satellitaires et radiométriques sont utilisées pour une cartographie précise du régolithe (Craig, 2001 ; Wilford, 2002). Les données Landsat et ASTER ont été utilisées conjointement avec le modèle numérique de terrain de la Shuttle Radar Topography Mission (SRTM). Les données gravimétriques proviennent d'une campagne ORSTOM en Afrique de l'Ouest (Albouy et al., 1992).
Regional geological setting
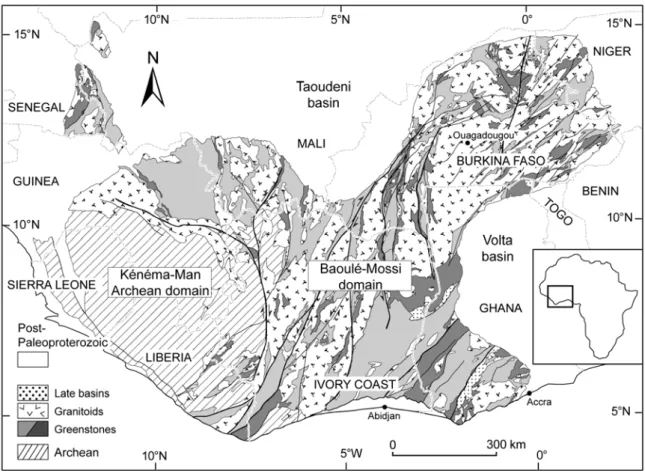
- The Baoulé-Mossi Paleoproterozoic domain
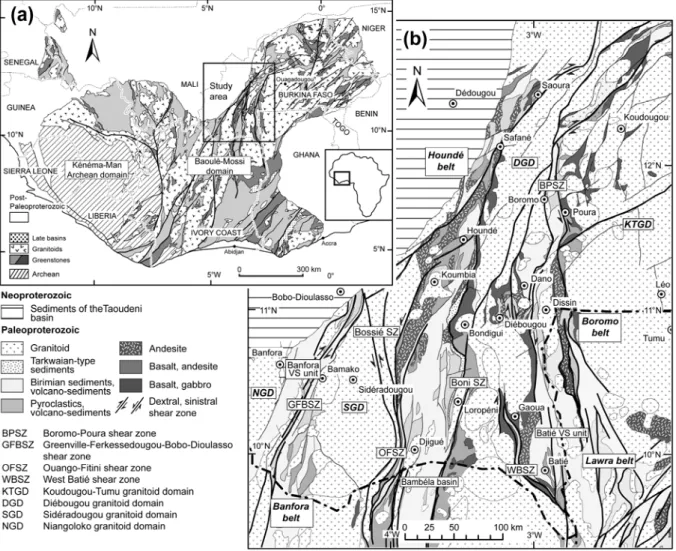
- Western Burkina Faso
Daataan ji’oofiziksii qilleensarra jiru qulqullina olaanaa qabu kaartaa ji’ooloojii Afrikaa Dhihaa keessatti meeshaa hin hafne ta’eera. Bakki jalaa Paleoproterozoic kan dhiha Burkina Faaso N-S trending greenstone belts sadii kan of keessaa qabu yoo ta’u, bahaa hanga dhihaatti Boromo, Houndé fi Banfora jedhamuun beekama (Castaing et al., 2003). Gara dhihaatti, yuunitiiwwan sub-horizontal kan Neoproterozoic Taouden Basin kan Paleoproterozoic basement irra jiru (Bronner et al., 1980).
Methodology and data use
- Airborne magnetometry
- Airborne gamma ray spectrometry
- Gravimetric data
- Remote sensing data
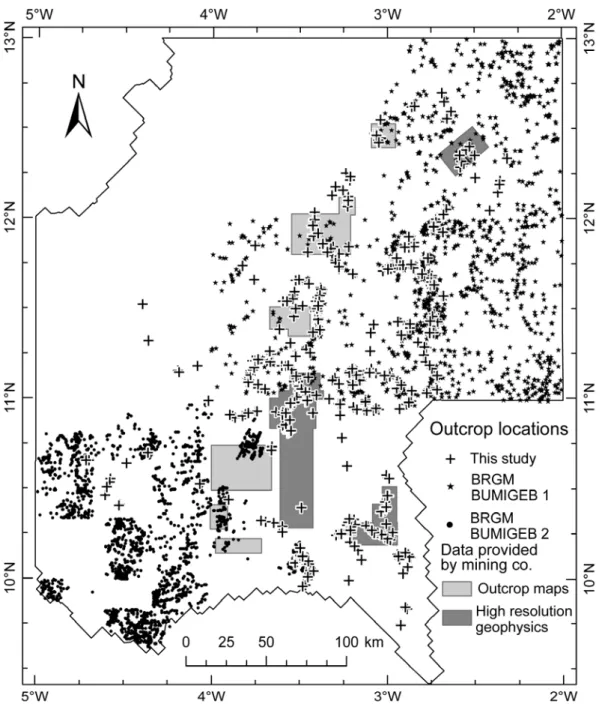
- Geological outcrop data
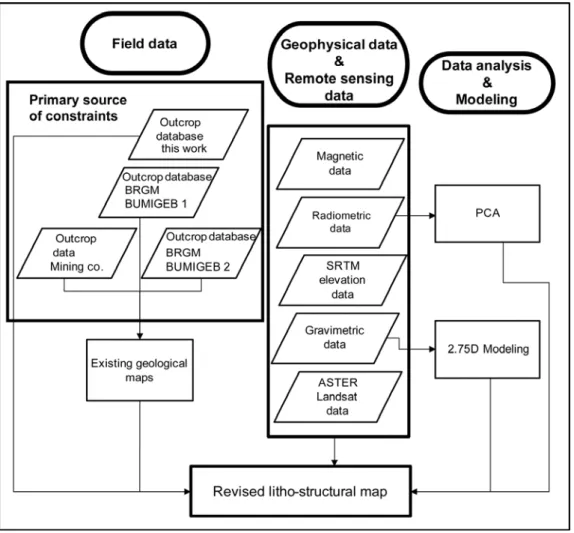
- Digital data integration
Hatched relief images and derivatives of the elevation data were integrated with gamma-ray spectrometry data (Wilford et al., 1997) to help characterize surface lithologies and regolith units and help differentiate regolith patterns from lithologic signatures. Steep gradients in the magnetic field were obtained from the analysis of the vertical and horizontal derivatives, the slope derivative and the analytical signal. We took advantage of the additional information obtained from the shaded relief and slope of the elevation data to evaluate the relationship between gamma-ray spectrometry data and regolith.
Structural framework
Lithological associations and structures: their petrophysics and expression in geophysical data . 52
- Lithologies and structures
- Strengths and weaknesses of the different datasets
- Implications for geological evolution of the West African Craton
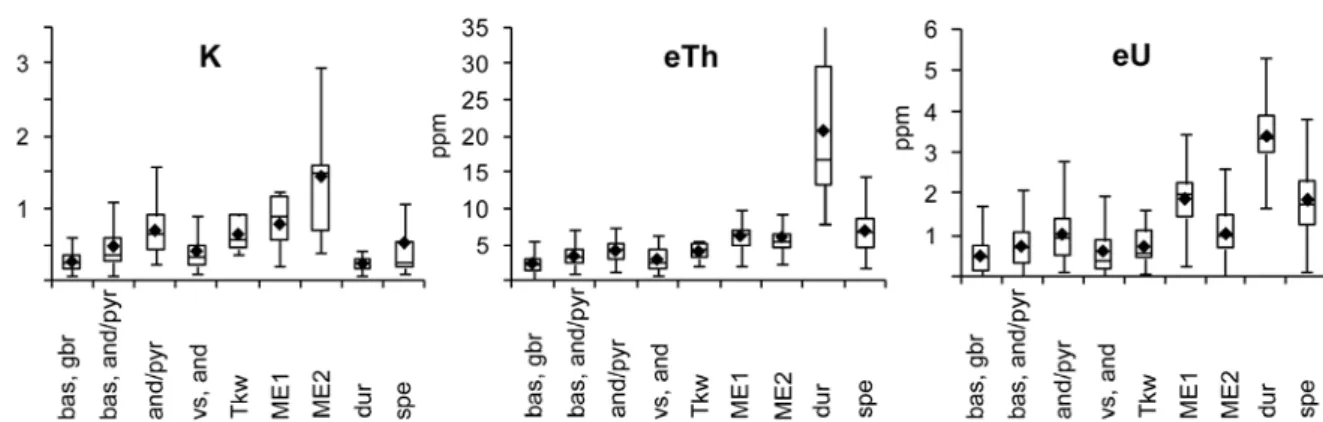
In the analyzed grids, the magnetic response of andesite lithologies ranges from medium to low. The density of volcanic-sedimentary communities ranges from 2.6 to 2.9 g/cm3. Volcanic-sedimentary rocks are associated with areas of low magnetic intensity with poorly defined magnetic textures. The magnetic susceptibility of sediments of this type is similar to volcanic-sedimentary rocks reaching SI values.
The gamma-ray spectrometry data depict most of the granitoids similarly due to regolith cover. The erosional escarpments of the iron-rich duricorst plateaus may correspond to the actual lithological contacts, especially where the duricorst is preserved on top of granitic plutons; however, it is eroded above the adjacent greenstones (eg the Gaoua batholith or the Bondigui pluton). We suggest the presence of a large-scale D1 antiform in the central part of the Houndé greenstone belt.
Some of the E-W oriented small-scale structures observable in the magnetic data may correspond to the D3 thrust faults. Two of the three generations of doleritic dikes (N40° and N100°) are well visible in magnetic data. Some granites (e.g. the Bamako pluton) can be delineated in gamma-ray spectrometry data, including concentric compositional patterns; on the other hand, most intruders can only be outlined using the magnetic grids.
Top map: RTPRMI (reduced to the residual magnetic intensity of the pole) color overlay over the first vertical derivative (grayscale); Intermediate: ternary grid of airborne gamma-ray data or PCA grid; Bottom card:. a) – The western edge of the Boromo belt and the eastern edge of the Houndé belt; (b) – The eastern edge of the Boromo belt and the Koudougou-Tumu granite domain; (c) – The Banfora belt; (d) – The contact zone between the western edge of the Houndé belt and the Sidéradougou GD.
Conclusions
This study suggests that an integrated approach is needed to achieve a more complete vision of the litho-structural framework. The revised map contributed significantly to the conception of the geodynamic scenario in Chapter II. Our experience from this study suggests that an improved understanding of the geological evolution of the West African craton at the local but also regional scale depends on an integrated evaluation of all the available datasets, as each provided distinct constraints on the overall interpretation.
The project was funded by the French Government PhD grant to V.M., IRD (Institute de recherche pour le développement) post-doctoral research grant to L.B. David at various stages of the project contributed significantly to our understanding of West African geology. We are indebted to mining companies SEMAFO, Volta Resources, Wega Mining, Sanu Resources and Orezone for providing us with high resolution geophysical data, borehole cores and outcrop maps.
75
Geological Setting
- Regional geological framework
- Distribution of the greenstone belts and granitoid domains
Main lithologies and stratigraphy
- The Boromo belt
- The Houndé belt
- The Banfora belt
- Tarkwaian-type metasediments
- Granitoids
Geochemistry of volcanic belts
Structural Evolution
- Deformation phase D1
- Deposition of Tarkwaian-type sediments – Late D1
- Deformation phase D2
- Deformation phase D3 and post-Eburnean doleritic dykes
Deep Structure
- Construction of the models from gravity data
- Results
Discussion
- Origin of the greenstone belts
- Origin of the sedimentary and volcano-sedimentary units
- Tectonic scenario and mineralization events
- Geodynamic implications
Conclusions
- Description of sampling area and sampled materials
- Observed lithological and soil units
- Sample measurements and sample preparation
- Library description
- Spectra description
- Mafic and intermediate rocks
- Granitoids
- Volcano-sediments
- Tarkwaian-type sediments
- Taoudeni basin sediments
- Soils and regolith
The manuscript begins with an overview of the geological evolution of the Paleoproterozoic domain of the West African Craton and the laterite weathering of the region. It also presents an overview of approaches used for geological mapping in deeply weathered terrains and techniques used for regolith analyses.
Study area description
- Data preprocessing
- Training-testing data selection
- Variable definition
- Classification
- Accuracy assessment
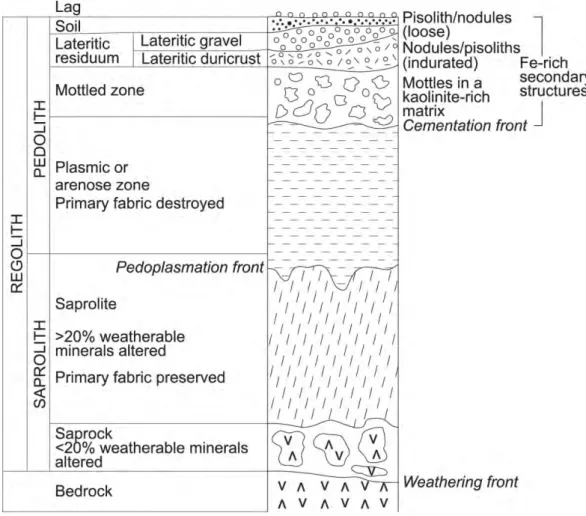
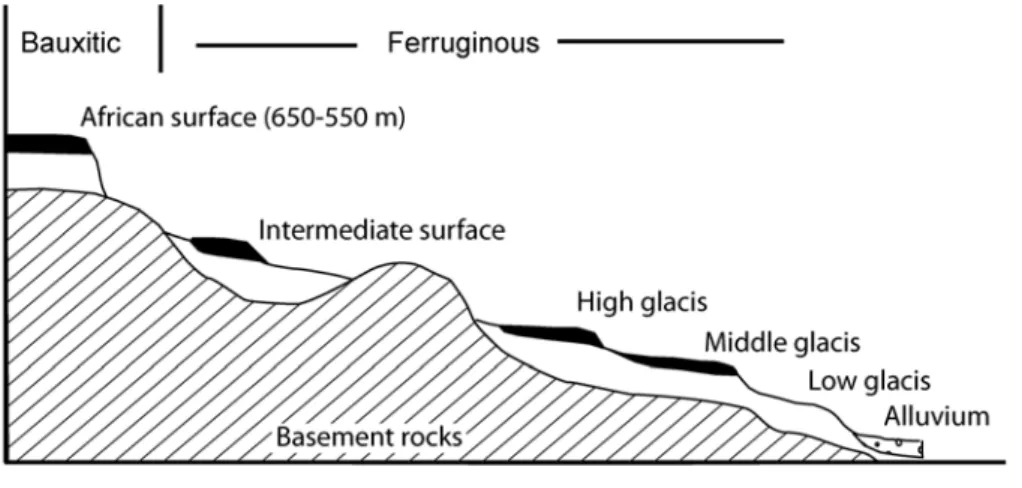
According to Boeglin (1990) and our field observations, only three of the planar surfaces are present. Estimates of the formation age of the different grain levels are derived from Beauvais et al. 2008), who dated the corresponding surfaces in the area of Tambao (Northern Burkina Faso). There appears to be a relationship between the chemical composition of the iron-rich duricres and the basement rocks (Boeglin, 1990).
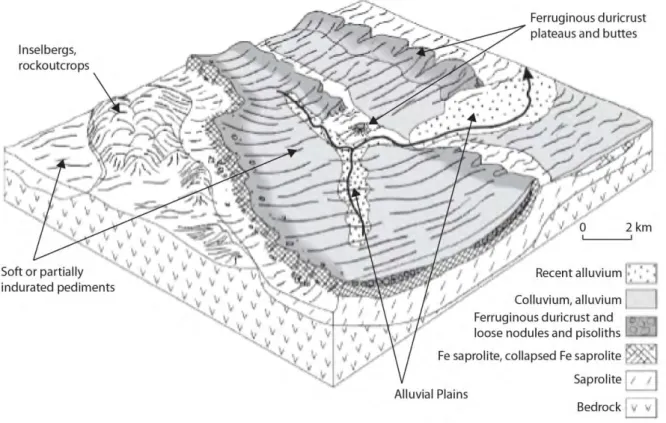
It reveals the chemical properties of approximately the first 30 cm layer of the earth's crust (Minty, 1997). Random sampling was used to select half of the data applied to training and half for accuracy assessment. All the insular mountains in the Gaoua area belong to the greenstone belt lithologies, including volcanic sedimentary and volcanic rocks.
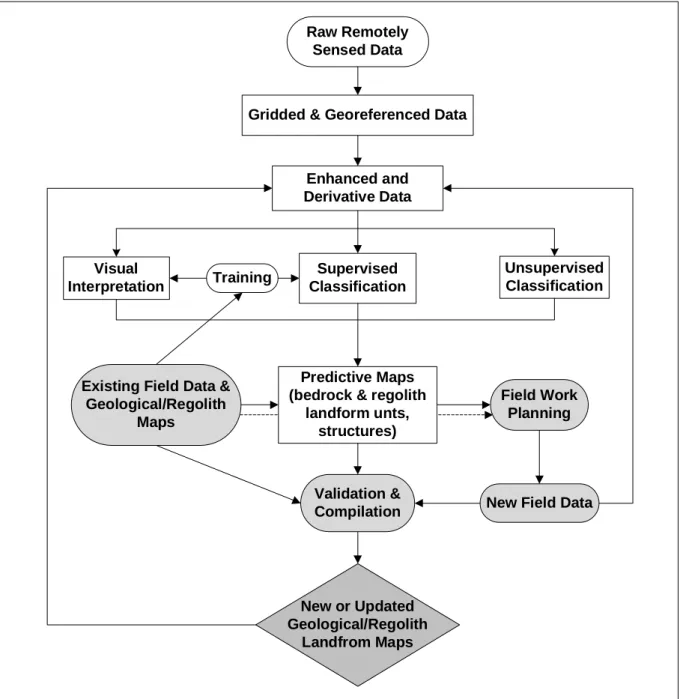
The radiometric data show relatively lower values for most of the radio elements over the basic rocks. The alluvial sediments that fill the bottom of the valleys form flat surfaces with distinct parameters in the SRTM elevation data and the derived datasets. The majority of regolith landform maps are still a product of visual analysis of the digitally enhanced data.
A threshold of 1000 epochs or 0.001 MSE was chosen for the completion of the training set.
Results
- Neural network classification
- Comparison between all classification scenarios
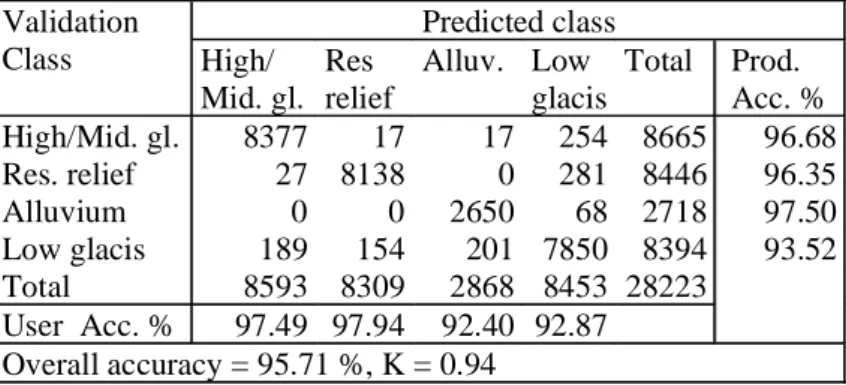
Most of the misclassified pixels belong to the Low glacis, which is the most common neighboring class. The Residual relief was correctly mapped and all the insel mountains and most of the smaller erosive ridges were recognised. The complete confusion matrix with the number of pixels belonging to each class, the overall, users and manufacturers accuracy along with the kappa coefficient is presented for the best classification in table.
An abbreviated result indicating the overall accuracy and kappa coefficient for all the classification trials is then presented in Table IV-6. The neural network classifier consistently outperformed the maximum likelihood classifier in all four scenarios. The highest overall accuracy and kappa coefficient were obtained for the combination of gamma-ray spectrometry images and derivatives of the SRTM elevation data.
Nevertheless, the differences between the classifications are small (within 5 percent), with the exception of the maximum likelihood classifier applied to the combination of gamma-ray spectrometry data, SRTM data and polarimetric radar data. When we further compare the results of the 11-layer neural network classification and the 20 or 24-layer (Figure IV-10) classification, which includes all available data, we must conclude that the latter produces apparently noisier data. An increase in the class of the Alluvium at the expense of the reduction of the Lower Glacis is also evident.
A distinct feature that can be observed is the replacement of the lower slopes of the remnant relief class by the high/middle glacis and the reverse mapping of some glacis slopes in the remnant relief class.
Discussion
- Comparison with the existing maps
- Perspectives for automated regolith landform mapping
It may be concluded that this class may perhaps be divided into two classes in the low glaciers which develop on the granitic rocks and the rocks of the greenstone belts; however, the differences are subtle and confusion between such two classes would probably be high. The stream network is interrupted in most of the study area while the channels are quite narrow. The fact that eleven source bands perform better than more input bands can be partially explained by the influence of vegetation cover on the spectral characteristics of regolith or rock surfaces (Siegal and Goetz, 1977; Murphy and Wedge, 1994; Serbin et al. , 2009).
In spectral data, these regions stand out as anomalous spots where one cannot easily determine the nature of the underlying material. The prediction of class probability outside the selected training/testing regions seems to be better for the neural network classifier. Also important is the ability of the network to act as a robust classifier capable of generalization and the ability to suppress layers that do not add information to the classification process.
The neural network classification of gamma-ray spectrometry and digital elevation data yields fairly uniform units, which are well suited for further post-processing and conversion into polygon layers commonly used in regolith landform mapping (Pain et al., 2007). The importance of the information from elevation models emphasizes the requirements for the accuracy of these models and the level of detail that can be obtained. The application of finer resolution DEMs would likely further improve classification accuracy.
Automated approaches can provide a more objective interpretation of the spatial distribution of regolith landform units.
Conclusions
Two of the events play a key role in crustal accretion during the Eburnean orogeny. Cover sequences of the West African craton, in: Dallmeyer, R.D., Lecorche, J.P. Eds.), The West African Orogens and Circum-Atlantic Correlates. Origin and age of Paleoprotozoic conglomerates and sandstones of the Tarkwaian Group in Burkina Faso, West Africa.
Genesis and geodynamic evolution of the Taoudeni Craton Basin (Upper Precambrian and Paleozoic), West Africa. Archean crust growth and tectonic processes; a comparison of Superior Province, Canada and Dharwar. A new metamorphic constraint on the Eburnean Orogeny from the Paleoproterozoic Formations of the Human Shield (Aribinda and Tampelga States, Burkina Faso).
Birimian lithological succession and structural evolution in the Goren segment of the Boromo-Goren Greenstone Belt, Burkina Faso. -Pb geochronology of Paleoproterozoic rocks in the southern part of. Kedougou-Kenieba inlier, Senegal, West Africa: evidence for diachronous accretionary development of the Eburnean province. Metamorphism of the country rocks hosting gold sulphide-bearing quartz veins in the Paleoproterozoic southern Kibi-Winneba belt (SE Ghana) .
Subsidence model of oceanic plateau igneous rocks in the Man-Leo Shield of the West African Craton.