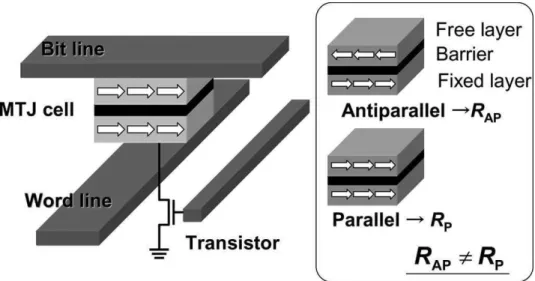
Its resistance depends on the relative orientation of the two magnetization directions of the two magnets due to the spin-dependent tunneling involved in the transport between the majority and minority spin states. Which upper or lower layer is fixed depends on the specific design of the MTJ.
0 D835425FBF4BC5718392A75FF7D5A2B5FD1D7 0 3429E4B237
Turning off the heating pulse leads to the cooling of the storage layer and the pinning of its magnetization in the new direction. The conversion is caused by the torque exerted by the spin-polarized current on the magnetization of the storage layer.

6 %$5FBF7,754BC5F7
Direct tunneling depends on the thickness of the gate area; it increases exponentially as the thickness of the oxide decreases. The shape of the density function of the Weibull distribution changes dramatically with the value of β.
484BF4BF783975$ FBF727"58#9237
The dielectric strength is defined as the breakdown voltage per thickness unit of the material. This corresponds to Fowler Nordheim tunneling by injecting electrons into the conduction band of the oxide. The second is an extrinsic breakdown (gradual breakdown and then breakdown) related to defects in the barrier rather than failure of the oxide integrity.
In this section, we will present the evolution of the Weibull parameters with applied stress. This is experimentally confirmed by HRTEM images (see Figure III-31), which show the presence of defect regions roughly distributed in the center of the MgO barrier. The endurance of the barrier is therefore strongly reduced when the density of trapped electrons in the barrier is high or when the time modulation of this density is large.
At each pulse, some of the tunneling electrons are trapped in the barrier at trapping sites. A simple calculation then yields the average density of trapped charges in the barrier Qav as well as the amplitude of the time modulation of this density ∆Q.
![Figure II-7: Graph showing oxide breakdown data that includes both intrinsic and extrinsic failures [II.3]](https://thumb-eu.123doks.com/thumbv2/1bibliocom/463387.69161/38.892.134.759.458.869/figure-graph-showing-breakdown-includes-intrinsic-extrinsic-failures.webp)
Q max Q min
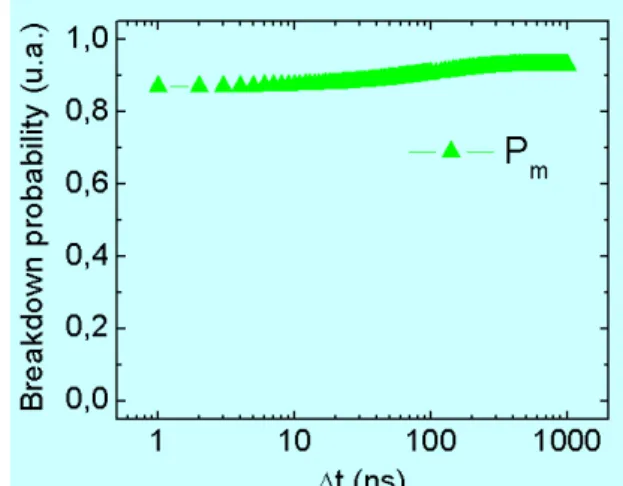
Next, to relate the temporal evolution of the load inside MTJs to its stability, we have calculated the MTJ failure probability from Q(t) using three failure mechanisms. First, as previously discussed, we have observed that for short delays, the load within the MTJ is large, thus leading to poor stability, i.e. we can thus determine two probabilities of first failures: failure due to the average load inside the device, called Pc. (section III-5-3-b-i) and decay due to modulation of trapped charges named Pm (section III-5-3-b-ii).
Furthermore, when an electric field is applied to the oxide barrier, we will consider the direct dielectric breakdown probability called Pd. To calculate the first two probabilities, which are directly related to the charges present in the barrier, assume that in the steady state the density of trapped charges remaining at the end of the discharge after a given voltage pulse corresponds to the initial density of trapped charges at the beginning of the voltage pulse. The breakdown due to the average trapped charge inside the barrier is given as follows:
A AAA
1exp
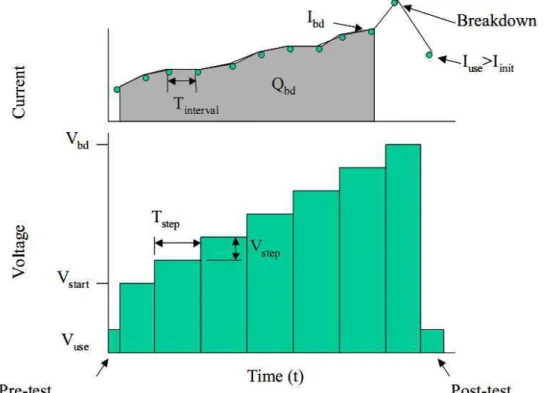
For pulses of duration δ=30ns, we calculated all these breakdown probabilities as a function of ∆t and plotted them in Figure III-42 for unipolar pulses and Figure III-45 for alternating pulses for V=1.5V. We calculate the three breakdown probabilities and the total breakdown probabilities P and we present them in Figure III-45. The variation of different breakdown probabilities versus delay between pulses for different applied pulse amplitudes is shown in Figure III-48.
Stability plateaus at long ∆t also increase quite significantly (6 orders of magnitude from 2 to 1.5 V for the sample shown in Figure III-49). Calculated breakdown of breakdown probabilities due to load Pc (a), due to load modulation Pm (b) and due to direct breakdown Pd (d) for unipolar pulses. The corresponding simulations are shown in Figure III-49 (b) for unipolar pulses and Figure III-50 (b) for alternating pulses.
F9351# F5F69357$F9781 13D369576FD1%& 1 87A31F816553DF9781'791'5793138C5F8631
Johnson noise is due to thermal fluctuations of the electrons and is related to the resistance R of the system according to the Nyquist formula. Its first characterization goes back to Johnson's experiments on electron emission current fluctuations in the thermionic tube (1925) [IV.9]. The striking aspect of 1/f noise that motivates a great deal of research activity is its universal character.
In the case of our MTJ, the fluctuators at the origin of the 1/f electrical noise may mainly be the trapping locations in the barrier that can be charged or discharged. Moreover, Kwang-Seok Kim et al [IV.22] had measured junction voltage fluctuations at constant voltage voltage. The bias noise is related to the noise of the network analyzer and the preamplifier.
![Figure IV-2 - [IV.21] Voltage noise power spectral density times area measured on the junctions with undoped, bottom doped or top doped elec-trodes with bias of 200 mV in the P state](https://thumb-eu.123doks.com/thumbv2/1bibliocom/463387.69161/118.892.209.680.161.560/figure-voltage-spectral-density-measured-junctions-undoped-trodes.webp)
Frequency(Hz) Measured Noise (Amplified)
If we calculate the difference between the MTJ noise (measured at antiparallel condition and 15 µA bias current) and the background distribution, we get the corrected noise value. We performed these various measurements to estimate the background distribution and subtracted this value to obtain the net MTJ low-frequency noise spectrum. We noted that the background distribution represents a negligible value compared to the MTJ noise, so we conclude that it is not necessary to subtract this correction every time.
The crossover noise shown in Figure IV-7 was corrected from the background distribution measured with zero bias current containing Johnson sample noise and setup noise. The measured noise spectrum is then divided by the gain of the amplifier (104) to obtain the appropriate noise value (see Figure IV-8).
Frequency(Hz)
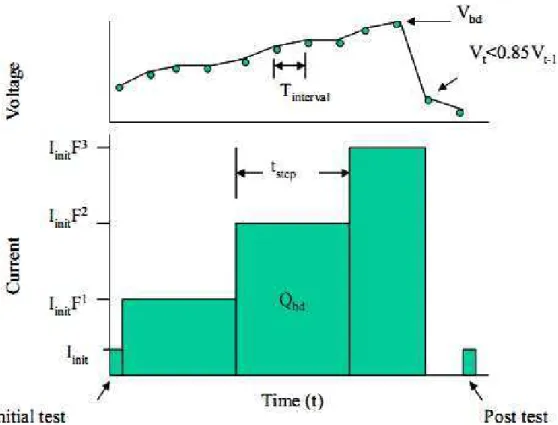
The noise level is linked to the endurance (η) of the MTJ, shown in the graph. The breakdown occurs abruptly, as shown in Figure IV-14, and corresponds to a sharp drop in junction resistance accompanied by a deterioration of the TMR response. After a disturbance, an abrupt change in the noise spectrum is observed, as shown in Figure IV-15.
The noise level versus the number of applied pulses is best shown in Figure IV-16. In Figure IV-18, the stability of junctions is plotted as a function of the corresponding Hooge parameter α. This difference may explain why the correlation shown in Figure IV-18 is only approximate.

86DCA78A1F8135A36973A1
This observation was explained by the fact that both phenomena are related to the presence of blocking sites in the barrier. Finally, this observation suggests that 1/f noise characterization can be used as a predictive tool for determining the electrical barrier reliability and therefore the write stability of STT-RAM or TA-MRAM cells. Finally, the main perspectives of this thesis work are related to the improvement of the MTJ structure in an effort to reduce the amount of blocking sites in the barrier.
This implies reducing the mismatch between electrodes and barrier (for example by V addition [IV.21]), optimizing the oxidation conditions during the barrier formation to avoid the formation of voids, controlling the B diffusion away from the barrier to formation of a BO/MgO interface. Results can be interpreted as the inserted layer may limit the B diffusion away from the barrier to avoid the formation of a BO/MgO interface. The quantitative charge trapping/receiving model adopted in chapter 3 can be extended by taking into account the self-heating effect within the barrier for the shortest delays between pulses, ie by adding the breakdown probability PT due to intrinsic thermal effect.
APPENDIX1
SCIENTIFIC COMMUNICATIONS
Duty Cycle Effect on Barrier Breakdown in MgO Magnetic Tunnel Junctions, ImagineNano Conference, Bilbao (Spain), April. Effect of duty cycle on barrier breakdown in MgO magnetic tunnel junctions, Intermag Conference, Taipei (Taiwan), Apr. Mechanism of blocking-detra barrier breakdown in MgO magnetic tunnel junctions. 17th Conference on Insulating Films on Semiconductors, Grenoble (France), Jun.
Mechanism of barrier breakdown in MgO-based magnetic tunnel junctions and correlation with low-frequency Mechanism in MgO-based magnetic tunnel junctions and correlation with low-frequency noise, Intermag Conference, Vancouver (Canada), May. Mackay, B.Dieny, Mechanisms of barrier breakdown in MgO-based magnetic tunnel junctions under pulsed conditions and Degradation mechanisms in MgO-based magnetic tunnel junctions under pulsed conditions and correlation with low-frequency noise. Giant thermoelectric effect in MgO magnetic tunnel junctions heated asymmetrically by hot electron tunneling flow.
French Introduction
Pour bien comprendre le résultat et son explication, nous avons développé un modèle qui modélise l'effet des délais entre les impulsions sur la durée de vie des jonctions tunnel magnétiques. A cette époque nous avons eu l'idée de mesurer le bruit télégraphique à basse fréquence et de voir s'il pouvait être lié à la durée de vie des jonctions tunnel magnétiques et si par cette méthode on pouvait prédire si une telle jonction est "bonne ou mauvaise" sans subir le test de dégradation. Enfin, après l'étude de tout ce phénomène de claquage des jonctions tunnel magnétiques, nous proposons dans les perspectives de la thèse d'optimiser la barrière en ajoutant du vanadium à sa composition afin de réduire le désappariement et éliminer partiellement les défauts de la barrière. et en ayant par la suite une durée de vie plus longue.
French Summary
A chaque impulsion, une partie des électrons tunnel est piégée dans la barrière au niveau des sites de piégeage. De ce fait, la quantité de charges piégées dans la barrière reste en moyenne faible, mais présente une forte modulation en fonction du temps. Cela génère une contrainte alternée sur la barrière d'oxyde, ce qui conduit également à une durée de vie courte.
La montée moyenne des électrons piégés dans la barrière est modérée, ainsi que la modulation temporelle de cette montée, ce qui se traduit par une durée de vie importante. Si les pièges à barrière sont uniformément répartis symétriquement ou sur toute l'épaisseur de la barrière, le changement de stabilité en fonction des délais inter-impulsions doit rester le même pour les deux polarités. Dans notre cas, la symétrie entre les impulsions positives et négatives indique soit une uniformité de la répartition des pièges au sein de la barrière, soit les pièges sont répartis symétriquement au sein de la barrière.
French Conclusion
La moyenne sur un grand nombre d'oscillateurs télégraphiques avec une distribution aléatoire des cycles de service produit un bruit électrique 1/f. Pour réaliser un test de bruit plus sensible, il serait utile de mesurer le bruit en 1/f proche de la tension de fonctionnement de la jonction tunnel. Enfin, cette observation suggère que la caractérisation du bruit 1/f peut être utilisée comme outil prédictif pour déterminer la fiabilité de la barrière et donc l'endurance en écriture des cellules STT-RAM ou TA-MRAM.
Ces pièges peuvent être des dislocations, des lacunes (O ou Mg) ou une variation locale de polarisabilité, par exemple si du BO se forme ainsi à proximité de la barrière de MgO. Enfin, les principales perspectives de cette thèse portent sur l'amélioration de la structure des JTM : tenter de réduire le nombre d'emplacements de capture dans la barrière. Cela inclut la réduction de l'espace atomique entre les électrodes et la barrière (par exemple en ajoutant du vanadium), l'optimisation des conditions d'oxydation lors de la formation de la barrière pour éviter la formation de lacunes, le contrôle de la diffusion du bore de la barrière jusqu'à la formation d'oxyde de bore au niveau de la barrière. interface avec MgO.
![Figure I-4. [I.14] (a) Estimation of spin polarization (P) from the observed MR ratio by using Julliere’s model](https://thumb-eu.123doks.com/thumbv2/1bibliocom/463387.69161/17.892.228.670.475.897/figure-estimation-polarization-observed-ratio-using-julliere-model.webp)
![Figure I-8. [I.46] The writing procedure in a conventional MRAM architecture (a) and in the TA-MRAM architecture (b)](https://thumb-eu.123doks.com/thumbv2/1bibliocom/463387.69161/23.892.198.735.476.721/figure-writing-procedure-conventional-mram-architecture-mram-architecture.webp)

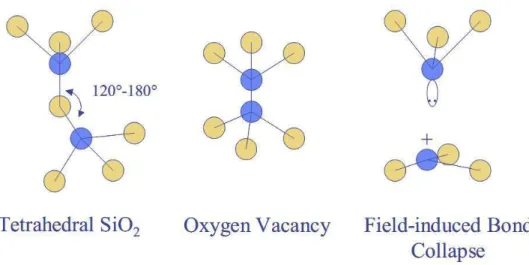
![Figure II-11 . SiO 2 Bond Breakage due to Hole Current [II.9].](https://thumb-eu.123doks.com/thumbv2/1bibliocom/463387.69161/42.892.206.697.112.347/figure-ii-sio-bond-breakage-due-hole-current.webp)