HAL Id: halshs-00203145
https://halshs.archives-ouvertes.fr/halshs-00203145
Submitted on 9 Jan 2008
HAL is a multi-disciplinary open access archive for the deposit and dissemination of sci- entific research documents, whether they are pub- lished or not. The documents may come from teaching and research institutions in France or abroad, or from public or private research centers.
L’archive ouverte pluridisciplinaire HAL, est destinée au dépôt et à la diffusion de documents scientifiques de niveau recherche, publiés ou non, émanant des établissements d’enseignement et de recherche français ou étrangers, des laboratoires publics ou privés.
Aspiration Levels and Educational Choices : An experimental study
Lionel Page, Louis Lévy-Garboua, Claude Montmarquette
To cite this version:
Lionel Page, Louis Lévy-Garboua, Claude Montmarquette. Aspiration Levels and Educational Choices : An experimental study. Economics of Education Review, Elsevier, 2007, 26 (6), pp.747- 757. �10.1016/j.econedurev.2007.06.001�. �halshs-00203145�
Aspiration Levels and Educational Choices An experimental study
Lionel Page
∗Louis Levy Garboua
†Claude Montmarquette
‡October 2006
∗Westminster Business School, University of Westminster, 35 Marylebone Road, NW1 5LS, London, l.page@wmin.ac.uk
†Center of Economics Sorbonne, 106-112 Bd de l’Hˆopital, 75647 Paris C´edex 13 and CIRANO, Mon- treal, Canada. louis.levy-garboua@univ-paris1.fr
‡CIRANO and Universit´e de Montr´eal, 2020 rue University, Montreal, (Quebec), Canada, H3A 2A5.
halshs-00203145, version 1 - 9 Jan 2008
Author manuscript, published in "Economics of Education Review 26, 6 (2007) 747-757"
DOI : 10.1016/j.econedurev.2007.06.001
Abstract
The explanation of social inequalities in education is still a debated issue in economics. Recent empirical studies tend to downplay the potential role of credit constraint. This article tests a different potential explanation of social inequalities in education, specifically that social differences in aspiration level result in different educational choices. Having existed for a long time in the sociology of education, this explanation can be justified if aspiration levels are seen as reference points in a Prospect Theory framework. In order to test this explanation, this article applies the method of experimental economics to the issue of education choice and behaviour.
One hundred twenty-nine individuals participated in an experiment in which they had to perform a task over fifteen stages grouped in three blocks or levels. In order to continue through the experiment, a minimum level of success was required at the end of each level. Rewards were dependent on the final level successfully reached. At the end of each level, participants could either choose to stop and take their reward or to pay a cost to continue further in order to possibly receive higher rewards.
To test the impact of aspiration levels, outcomes were either presented as gains or losses relative to an initial sum. In accordance with the theoretical predictions, participants in the loss framing group choose to go further in the experiment. There was also a significant and interesting gender effect in the loss framing treatment, such that males performed better and reached higher levels.
Keywords : Education inequality, Prospect Theory, Experimental Economics
JEL Classification : I21, D80, J24, C91
halshs-00203145, version 1 - 9 Jan 2008
The effects of social background on educational achievement are well documented. Em- pirical data show that children from higher socio-economic backgrounds perform better at school and choose longer courses of study than their counterparts from lower backgrounds (Duru-Bellat 2002). Numerous studies have increased our understanding of these phenom- ena. The precise mechanisms underlying these differences are, however, still a research issue. In economics, the possible causes of those facts are considered to be respectively the transmission of human capital and the existence of credit market imperfection. However, how much these factors explain social inequalities in education is still an issue. Recent studies by Carneiro and Heckman (2002) and Cameron and Taber (2004), for example, tend to downplay the role of credit constraints in educational choice. Another kind of explanation has been proposed in sociology of education. Since Boudon (1973), sociolo- gists have tried to explain social inequalities in education as a result of initial differences in aspiration levels. This explanation has not appeared in the economic literature, the notion of aspiration being, a priori, somewhat alien to the notion of preference.
Page (2005a, 2005b) has, however, shown that the impact of aspiration levels on edu- cational outcomes can be modeled with the notion of reference point from prospect theory.
In his theoretical framework, the preferences of the participant are characterised by a ref- erence point, which divides the space of outcomes between outcomes perceived as losses, and outcomes perceived as gains. This reference point affects the behaviour of partici- pants. Individuals will have a tendency to be risk seeking when presented with lotteries with outcomes defined as losses. Participants will also tend to subjectively overweight losses as compared to gains (loss aversion). Given these effects of the reference point on participant utility, it is possible to show that participants with a higher reference point will have a tendency to choose longer studies given a more risk seeking behaviour. Fur- thermore, they will expend more effort in order to increase their probability of success in education due to a higher marginal utility resulting from loss aversion.
It is difficult to separate empirically the predictions of prospect theory from other explanations because reference points or aspiration levels are mainly unobservable. More- over, when they can be approximated, the reference points are likely to be endogenous
halshs-00203145, version 1 - 9 Jan 2008
since they may depend on all the unobserved variables that affect educational success. The usual problem of non experimental data - the multiplicity and intricacy of causal variables and the persistent doubt of endogenous bias - makes decisive conclusions difficult in this context. Thus, the experimental methodology may be a worthwhile complement to the usual field studies. The simplified framework of an economic model may be reproduced within an experimental design. It is then possible to control each variable and to exoge- nously modify the variables of interest. In particular, the literature on prospect theory has shown that it is possible to manipulate the reference point of participants by framing the outcomes of the experimental study differently.
In our experiment, we replicate the relevant features of educational choices found in human capital investment models. Feature of these models include investing both time and money to perform laborious training tasks in order to get monetary rewards. Tasks in this experiment are grouped in stages, which require some minimal levels of success to proceed to the next stage. Moreover twice during the experiment (at stage 9 and 12), participants can chose to stop and have their current gains or continue and have a chance to win more. The choice to continue is however costly and the result of this investment is uncertain. It depends of the success of the individual in the later stages of the experiment.
It is obviously impossible in an experimental setting to reproduce all the character- istics of an educational choice that imply high stakes and long term consequences. The explanation of social inequalities using differences in aspiration levels does not however rely on the size of the stakes or on the time dimension of the choice. Our experiment aims therefore at reproducing the kind of simple modeled situations where aspiration levels have been proposed to have an effect in order to assess the predicted impact of differences in aspiration levels.
The experiment is made of two treatments. In one treatment, the outcomes are dis- played as gains, framing a low reference point. In the other treatment,the outcomes are presented as losses, framing a high reference point. According to prospect theory, the framing of the monetary outcomes as losses should have two effects:
(i) The participants should be more likely to choose to continue at stages 9 and 12.
halshs-00203145, version 1 - 9 Jan 2008
(ii) The participants should exert more effort to perform the task.
In accordance with the predictions of prospect theory, we find in our experiment that participants with a high reference point choose more often to continue longer in the education game than those with a low reference point. The high reference point framing also seems to have an effect on the level of effort. However, surprisingly this effect seems to appear only for males who improve their performance in the face of losses. In contrast, the performance of females does not differ between the two treatment conditions or even gets lower in the loss framing treatment.
1 Experimental Design
Experiment structure
The experiment consists of 15 stages grouped in 3 levels. Each stage involves solving a given number of anagrams. The first level contains the stages 1 to 9, the second level the stages 10 to 12 and the third level the stages 13 to 15. At the end of each level, a participant must have solved two thirds of the anagrams to be allowed to pass to the next level. The difficulty of the level increases according to the following criteria:
• The number of anagrams per stage increases with the level with a constant time limit of 8 minutes per stage. Specifically: .
– 6 anagrams per stage for level 1, – 9 anagrams per stage for level 2 and – 12 anagrams per stage for level 3
• The length of anagrams increases on average.
The structure of the experiment is represented in Figure 1. At the end of each level, the participant fails or passes, and correspondingly there are two possible outcomes in terms of monetary payments.
halshs-00203145, version 1 - 9 Jan 2008
First Level Second Level Third Level
1 2 8 9 10 11 12 13 14 15
Figure 1: Structure of the experiment
Framing of the monetary payments
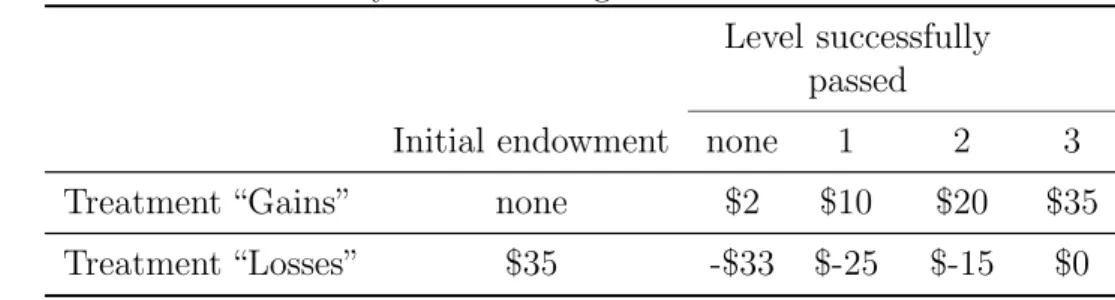
The monetary payments of this experiment depend on the highest level successfully reached. The experiment is composed of two treatments corresponding to two distinct levels of aspiration. The aspiration level is affected by the framing of the payments. In the first treatment, the payments are presented as gains. In the second treatment, the participant is told that he or she receives an initial sum. Stopping at early stages implies losing part of this sum. Framing the payment outcomes as gains gives implicitly to the subjects a natural reference point equal to zero. Each increase in the monetary outcome is then perceived as an increase in gains. On the contrary, framing the payment outcomes as losses relative to an initial sum gives a reference point at the level of this sum. Each increase in the monetary outcome is perceived as a decrease in losses. The structure of payments is actually the same, but the presentation differs (see Table 1)1.
Table 1: Payments framing for the two treatments Level successfully
passed
Initial endowment none 1 2 3
Treatment “Gains” none $2 $10 $20 $35
Treatment “Losses” $35 -$33 $-25 $-15 $0
1The outcomes in this paper are in Canadian dollars and correspond to the first sessions of the experiment conducted in Montreal.
halshs-00203145, version 1 - 9 Jan 2008
Participant choices
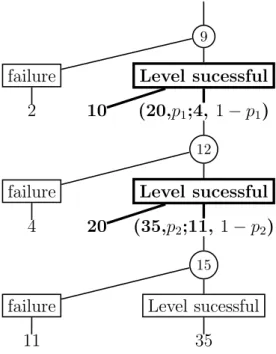
At the end of levels 1 and 2, the participants who solved at least two thirds of the anagrams can choose to continue or to stop. To continue has a cost, which represents the opportunity and the education costs of studies. With successful completion of the level, the participant gets a higher reward, but with failure she will receive a lower monetary outcome than if she had chosen to stop. After stage 9, to continue to level 2 costs $6 and after stage 12, to continue to level 3 costs $9. It is possible to represent the decision tree of the participant to show the risky choices. Figure 2 shows the two risky decisions facing the participant during the experiment. At stage 9 and 12, the participant has to chose between a risky lottery linked to the choice of continuing (Success, p; Failure,1−p) and a sure outcome linked to the choice to stop. For each of these choices, we suppose that the participant estimates a subjective probability of success respectively p1 and p2
before to continue or to stop. For example, at the end of the stage 9, if the participant solved less than two thirds of the anagrams of stages 1-9, he or she is eliminated and get 2$. Otherwise, the participant can choose to stop and get the sure amount of 10$, or try to continue for the cost of 6$. In case of success, with probability p1 he or she would get 20$, but in case of failure, with probability 1−p1, the final gain would only be 4$.
The participants are thus faced with choices between a sure amount and a risky lottery at stages 9 and 12.
1.1 Experimental sessions
There were a total of eight sessions (four per treatment) with 129 participants. Four sessions were conducted in the Bell laboratory in Montr´eal in February 2006, and four sessions were conducted in the University of Paris 1 laboratory of experimental economics in April 2006. The participants were contacted either by email2 or by advertising on the research center websites. Participants did not know a priori the topic of the experiment but were informed of the expected duration and the existence of a reward. The two
2Emails were sent to a database of individuals having previously registered their interest into partici- pating to an experiment.
halshs-00203145, version 1 - 9 Jan 2008
9
failure Level sucessful 2 10 (20,p1;4, 1−p1)
12
failure Level sucessful 4 20 (35,p2;11, 1−p2)
15
failure Level sucessful
11 35
Figure 2: Decision tree
treatments (Gain Framing and Loss Framing) were performed in Paris and Montreal (with a roughly equal number of participants for each treatment in each laboratory).
During the experiment, each participant was given a participation fee of $10 ore8 and randomly assigned to a computer. They all received standard instructions on the nature of the experiment and the task required. Before the experiment, the participants were asked about their age, gender, native language3, education level, job status, the frequency they played Scrabble or did crosswords. They were tested regarding their comprehension of the instructions. At the end of the experiment, the participants were asked about their level of stress, motivation to solve anagrams, and level of satisfaction with their results.
2 Experimental Results
2.1 Descriptive Statistics
Comparing the initial characteristics of participants between treatments (Table 2) no significant differences can be noted. The random selection of participants seems to have
3All the anagrams and more generally the experiment were in French.
halshs-00203145, version 1 - 9 Jan 2008
provided two samples fairly similar relative to characteristics which could play a role in the ability to succeed in the experiment. In order to measure potential difference in individual risk aversion, participants were asked if they would prefer to choose between a sure amount of 5$ or to pick a ball in box with white and black balls whose respective proportions are unknown and get 10$ if the ball picked is black. The binary answer to this question is used here as a rough index of individuals’ risk aversion. No significant difference in the answer to this question was noticed.
GFa LFb Diff
Male 57% 53% ns
Age 25.3 25.5 ns
Previously participated to an experiment 67% 64% ns
Not a native French speaker 26% 32% ns
Frequency of practice of crosswords 2 2.5 ns
Frequency of practice of scrabble 2 2.2 ns
Risk averse answer to hypothetical lottery question 46% 42% ns
N 63 66
a Gain Framing b Loss Framing
Table 2: Sample characteristics
Figure 3 illustrates the “surviving” profile of our experiment. One major goal of the design was to have a progressive selection of participants. Due to failure and self-selection, the number of participants is bound to decrease at each level. The “surviving” profile of the experiment is satisfactory. The difficulty of the task ensure that a real selection takes place along the experiment. However, the task is not too hard, and a reasonable number of participants manage to finish it successfully.
halshs-00203145, version 1 - 9 Jan 2008
85.71 83.33
30.15
37.88
9.52
18.19
020406080100Percents
Level 1 Level 2 Level 3
Percentage of successful individuals for each level
GF LF
Figure 3: Survival rates at each level
2.2 Differences in choices
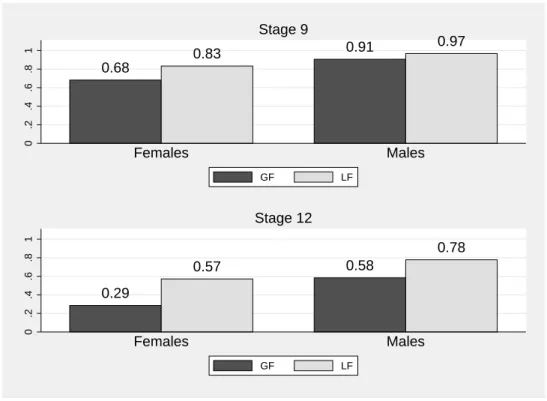
The main goal of our experiment was to study how the framing of a high reference point affects choices to continue from one level to another. Figure 4 shows the differences in choices made by participants in both treatments. The participants from the LF group tend to choose to continue more often than the participants from the GF group. These differences are significant at the 10% level for a one tail test at stage 9 (level 1) and at 5% at stage 12 (level 2). This result fully supports the theoretical assumption that participants with higher reference points will be more risk seeking. A joint non parametrical test (Kruskal Wallis rank test) on both levels indicates that when the results of those two levels are taken jointly, the level of statistical significance of the difference in choice reaches 5%
for a two tail test.
Of particular interest, males tend to choose to continue more often than females. Both males and females in the LF treatment tend to continue more than in the GF treatment.
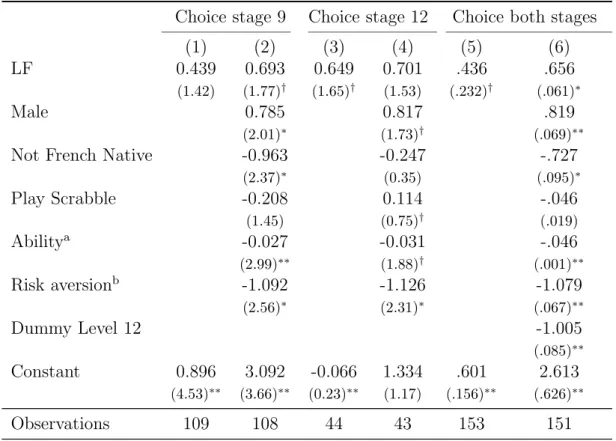
The econometric analysis of the factors determining the choice to continue or not at stages 9 and 12 confirmed the results of the descriptive statistics. In Table 3, a probit model (with 1 for those continuing in later stages and 0 otherwise for the observed variable)
halshs-00203145, version 1 - 9 Jan 2008
0.68
0.83 0.91 0.97
0.2.4.6.81
Females Males
Stage 9
GF LF
0.29
0.57 0.58
0.78
0.2.4.6.81
Females Males
Stage 12
GF LF
Figure 4: Individual choices to continue after stage 9 and 12
indicates that participants in the LF group show a higher probability to continue further at stage 9. A one tail test on the coefficient of the LF dummy indicates that, in accordance with the prediction, it is positive at 5% level in the regressions (2) and (3). The non significance of the result in regression (1) may be due to the necessity to control for other variables. The fact of introducing relevant variables in the regression increases the coefficient and its significance. The introduction of additional explanatory variables for the choice at stage 12 also increases the coefficient, but the latter is no longer significant at 5%. In regressions (5) and (6) the observations of choices are pooled on both stage 9 and 12 and a dummy controlling for the given level is introduced. The coefficient of the LF dummy is significant at 5% for a one tail test in regression (5) and for a two tail test for the regression (6). In regressions (2), (4) and (6) of Table 3, we control for participants’ characteristics such as gender, native language, and the previous practice of scrabble. We also controlled for the ability of the participant at the task using the mean time per anagram solved during the stages 1 to 9 for the choice at level 1 and the mean time per anagram solved during the stages 10 to 12 for the choice at level 2. The binary variable giving an indication about the risk aversion of the individuals is introduced in
halshs-00203145, version 1 - 9 Jan 2008
Table 3: Choices : probit regressions
Choice stage 9 Choice stage 12 Choice both stages
(1) (2) (3) (4) (5) (6)
LF 0.439 0.693 0.649 0.701 .436 .656
(1.42) (1.77)† (1.65)† (1.53) (.232)† (.061)∗
Male 0.785 0.817 .819
(2.01)∗ (1.73)† (.069)∗∗
Not French Native -0.963 -0.247 -.727
(2.37)∗ (0.35) (.095)∗
Play Scrabble -0.208 0.114 -.046
(1.45) (0.75)† (.019)
Abilitya -0.027 -0.031 -.046
(2.99)∗∗ (1.88)† (.001)∗∗
Risk aversionb -1.092 -1.126 -1.079
(2.56)∗ (2.31)∗ (.067)∗∗
Dummy Level 12 -1.005
(.085)∗∗
Constant 0.896 3.092 -0.066 1.334 .601 2.613
(4.53)∗∗ (3.66)∗∗ (0.23)∗∗ (1.17) (.156)∗∗ (.626)∗∗
Observations 109 108 44 43 153 151
Absolute value of z statistics in parentheses Significant : † 10% ;∗5%;∗∗ 1%
aAbility is measured with the mean time individual required to solve one anagram at the previous level.
bDummy equal to 1 if the participant choose an uncertain lottery in a hypothetical choice
regressions (2), (4) and (6). The coefficients of this variable in these probit regressions indicate that the participants who made a risk averse choice tend also to be more risk averse during the experiment. Importantly, these individual differences in risk aversion do not account for the differences in choices between treatments.
The coefficient of the LF treatment dummy variable is important. The corresponding marginal effect is around 9 percentage points at level 1, 25 at level 2 and 13 for both levels taken together. Thus, the participants in the LF treatment group tend to take greater risks by continuing more often when they are faced with the choice to leave or to continue.
Therefore, the framing does matter.
halshs-00203145, version 1 - 9 Jan 2008
2.3 Gender differences in performances
Our second proposition is that participants in the LF treatment should perform better at the task than the participants of the GF treatment due to a higher motivation to expand effort. At first sight, no sign of such difference can be found. Figure 5 shows that the participants from both treatments can’t be distinguished relative to their performance on average.
246810
1 2 3 4 5 6 7 8 9 10 11 12 13 14 15 Stages
GF LF
Number of anagrams solved
020406080100
1 2 3 4 5 6 7 8 9 10 11 12 13 14 15 Stages
GF LF
Cumulated number of anagrams
100200300400
1 2 3 4 5 6 7 8 9 10 11 12 13 14 15 Stages
GF LF
Time spent per stage
20406080100
1 2 3 4 5 6 7 8 9 10 11 12 13 14 15 Stages
GF LF
Mean time per anagram
Figure 5: Average performance at each stage for both treatments
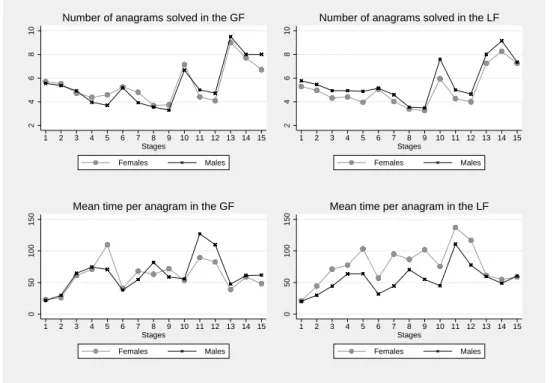
This general picture masks very important gender differences within groups. The main result of our experiment regarding gender is that the LF framing has a clear positive effect on performance, but only for males. Figure 6 shows the results by gender for two of the main indicators of performance of the experiment, Number of anagrams solved, and mean time to solve an anagram, which were represented in Figure 5. While no gender differences are noticeable in the GF treatment, males systematically outperform females in the LF treatment. On average males solve more anagrams than females at each stage in the LF treatment, and they take less time per anagram in 14 of the 15 stages. A Wilcoxon signed rank test shows that these differences are significant at 1% for both indicators.
halshs-00203145, version 1 - 9 Jan 2008
in both treatment as no significant difference were found between the characteristics of males in both treatments and between the characteristics of females in both treatments.
246810
1 2 3 4 5 6 7 8 9 10 11 12 13 14 15 Stages
Females Males
Number of anagrams solved in the GF
246810
1 2 3 4 5 6 7 8 9 10 11 12 13 14 15 Stages
Females Males
Number of anagrams solved in the LF
050100150
1 2 3 4 5 6 7 8 9 10 11 12 13 14 15 Stages
Females Males
Mean time per anagram in the GF
050100150
1 2 3 4 5 6 7 8 9 10 11 12 13 14 15 Stages
Females Males
Mean time per anagram in the LF
Figure 6: Gender differences in the GF and LF treatments
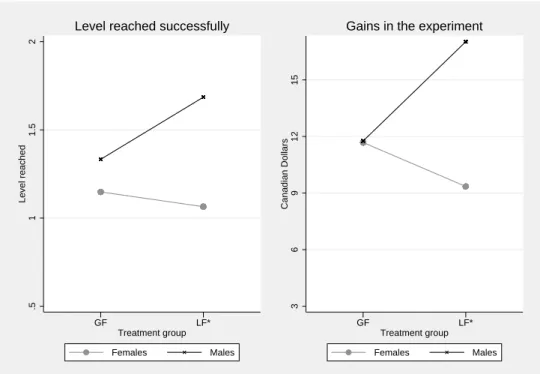
This gender difference in performance has consequences relative to the final outcome of participants. Figure 7 shows how differently males and females perform when in the LF treatment. While no difference is noticeable in the GF treatment, males reach on average a higher level in the experiment and earn an additional 7$ relative to females (both results are significant at 10%).
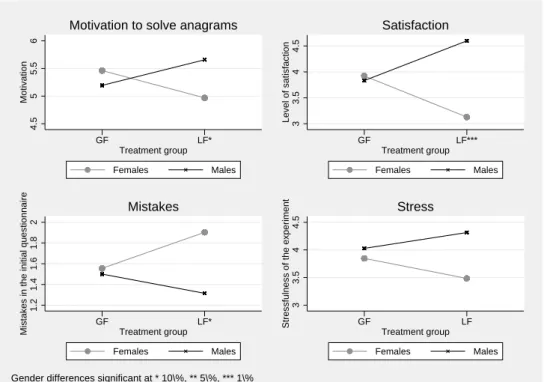
Our data allows to study a bit further the psychological states of males and females in both treatments. In particular, an explicit question at the end of the experiment aimed at eliciting the level of motivation of the participant. The question was “How would you describe your motivation to solve the anagrams?”. The participants were invited to answer on a Likert scale fron 1 (very low) to 7 (very high). Figure 8 shows that while no gender difference is noticeable in motivation in the GF treatment, males in the LF treatment report being more motivated than females to solve the anagrams at a 10% significance level.
Solving anagrams requires sustained concentration, and this is where an effort must be
halshs-00203145, version 1 - 9 Jan 2008
.511.52Level reached
GF LF*
Treatment group
Females Males
Level reached successfully
3691215Canadian Dollars
GF LF*
Treatment group
Females Males
Gains in the experiment
Gender differences significant at ** 5\%, *** 1\%
Figure 7: Individuals final outcome
made. Two indirect indicators of concentration were also assessed. First, at the beginning of the experiment, after the reading of the experiment rules to participants, an initial questionnaire was given to test the understanding of the experiment by every participant.
In case of a wrong answer, an explanation was given to ensure full understanding, and the participant could change his or her answer. Each participant had to answer all questions correctly to be allowed to proceed further in the experiment. Several factors can play on the probability to make a mistake, including the concentration of the participant during the preliminary phase of explanation. An interesting result is that while no difference is noticeable in the GF treatment, females make more mistakes in this initial questionnaire than males at a 10% level of significance4. A second indirect indicator of the level of concentration during the experiment is the level of stress of the participant during the task. A question was asked about their level of stress during the experiment (between 1 to 7). While no gender differences appear in the GF treatment, males seem to have a higher
4Differences in understanding between males in females in the LF treatment could then be thought as a reason for differences in performance. This does not seem however to be a likely explanation.
Participants making mistakes had the good answer reexplained to them, reducing then the understanding differences. Moreover differences in the understanding of the instructions can hardly explain differences in performances to solve anagrams.
halshs-00203145, version 1 - 9 Jan 2008
level of stress in the LF treatment (this difference is however not statistically significant).
4.555.56Motivation
GF LF*
Treatment group
Females Males
Motivation to solve anagrams
33.544.5Level of satisfaction
GF LF***
Treatment group
Females Males
Satisfaction
1.21.41.61.82Mistakes in the initial questionnaire
GF LF*
Treatment group
Females Males
Mistakes
33.544.5Stressfulness of the experiment GF LF
Treatment group
Females Males
Stress
Gender differences significant at * 10\%, ** 5\%, *** 1\%
Figure 8: Gender differences in the two treatments
The answers to the final questions seem then to indicate that males where more mo- tivated during the experiment and expended a higher level of effort in order to solve the anagrams. An important feature is that the gender differences seem to be not only due to an improvement of the males’ performance, but also, as shown on figures 7 and 8, to a decrease in the performance of females in the LF treatment5.
Eventually, when asked about their satisfaction about their performance in the exper- iment, a very significant gender difference appear in the LF treatment (1% level), males declaring to be more satisfied than females, while no difference was noticeable in the GF treatment (Figure 8). Importantly this difference in satisfaction is not due to differences in gains. When controlling by regression for the fact that males in the LF treatment earn more at the end of the experiment the difference in satisfaction between males and females in the LF treatment group is still significant at 5%.
5This phenomenon is however too slight to be statistically significant with our number of observations.
The repetition of this pattern for the different variables is however striking
halshs-00203145, version 1 - 9 Jan 2008
3 Discussion
According to numerous sociologists of education, aspiration levels matter and are a ma- jor explanation of social inequalities in education. Our experiment aimed to study how aspiration levels, defined as reference points, influence individual choices in a situation designed to replicate educational choices. A very important result of this experiment is that framing outcomes as losses relative to a high initial amount induces participants to chose to continue further and to take more risks.
This situation may be easily understood in terms of real educational choices. For example, imagine two individuals with different social backgrounds. Emma is from a poor social background whose parents have a low level of education, while Ben is from a high social background whose parents have a very high level of education. If social background and the education level of parents act as a reference point, then Emma and Ben will have different educational aspirations. For Emma, any additional level of education beyond that of her parents will be perceived as a positive achievement. In contrast, for Ben, the same level of education would be perceived as a failure if it is lower than his parents’ level of education. While Emma would consider her outcome as positive if stopping at any intermediate level of education, Ben would consider the same outcome as negative.
Our experiment aimed to reproduce the situations of Emma and Ben, respectively in our GF and LF treatments. In accordance with the theoretical predictions, the individuals from the LF treatments, with a high reference point, choose more often to continue in the experiment. Therefore, this supports the idea that aspiration levels may play a major role in educational choices, and that social differences in aspiration levels may be a major cause of the social inequalities in educational outcomes.
The differential effect of the LF treatment for males and females was not initially expected from our experimental design. It is, however, not fully surprising relative to previous studies. A very relevant finding which can help explain this result is from Rizzo and Zeckhauser (2003) who found that males and females with high reference points do not react in the same way, with males being more likely to change their behaviour in order to reach a higher goal than females. Studying the behaviour of male and female doctors,
halshs-00203145, version 1 - 9 Jan 2008
they found that 1) generally males have higher reference points that females, and 2) given males and females with the same high reference point, males will be more likely to modify their behaviour to reach their goal. In this study the authors found that male doctors with high reference points are more likely to take a higher work load in order to reach their high income reference point.
In comparison to this study, we found first that males are more likely to choose to continue in the experiment in both treatments. This could be explained by a tendency to adopt a higher reference point than females in each treatment6. It must be stressed that no significant gender difference was recorded for the question on risk aversion, therefore gender difference in choices do not seem to stem from gender differences in risk aversion per se. Second, while males and females have similar performances in the GF treatment, males outperform females in the LF treatment. This is consistent with the second result of Rizzo and Zeckhauser (2003) where the framing effect primarily affects males’ behaviour.
Whilst the effect of the framing on performances of males and females seems relatively minor on Figure 6, the higher performance of males in the LF condition leads to very noticeable over representation of males at the highest level of success in the experiment.
As shown in Table 4, males from the LF treatment represent 55% of the participants reaching the highest level successfully compared to 25% which would be expected from chance alone.
Table 4: Distribution of participants successfully completing the experiment Females Males
GF 2 4
LF 2 10
On the whole, males represent 78% of the highest achievers while they represent only 55% of the participants. This phenomenon led us to wonder about the possible comparison with gender differences in reality. A well established phenomenon is the concentration of males in high levels of education while females are actually performing on average better in
6Our design aims at framing a reference point of 0 in the GF treatment, and of 35$ in the LF treatment.
However, it is more than likely that the framing effect does not fully determine the aspiration level of the participants.
halshs-00203145, version 1 - 9 Jan 2008
previous stages (Davies and Guppy 1997). Our results raise an interesting yet unanswered question : “could the concentration of males in higher levels of education be due to the higher rate of success of males with high aspiration levels ?”
4 Conclusion
This paper presents an experiment reproducing the main features of educational choices.
By framing the outcomes either as gains or as losses relative to the highest possible outcome, it aims to study how aspiration levels conceived as reference points in a prospect theory framework may influence educational choice. Sociologists have first proposed that a major part of social inequalities in education be due to social differences in aspiration level.
The results of the experiment are in accordance with the prospect theory predictions concerning the effect of aspiration levels on choices. We find that to frame outcomes as gains or losses in our experiment significantly changes the choices of the participants.
Participants in the loss framing treatment chose more often to continue further in the stages of the experiment than participants in the gain framing treatment. Concerning the effect of aspiration levels, the prediction stemming from prospect theory are only validated for males. The framing of outcomes as losses, which was expected to increase the motivation of the participants, does so, but only for males.
Two comments about these results. First, that a simple framing of the outcomes may reproduce inequalities in choices and to some extent in motivation is of clear interest for the explanation of social inequalities in education. This result supports the idea that differences in aspiration levels play a role in social inequalities in education.
Second, the outcome difference in gender behaviour in the loss framing treatment de- serves further work given that gender inequality in education outcomes is still an empirical issue. In our experiment, not only do the males in the LF treatment report a higher level of motivation, but they are also more likely to reach a higher level. It seems that gender inequality in education could at least partly stem from the effect of aspiration levels as
halshs-00203145, version 1 - 9 Jan 2008
References
Boudon, R. (1973): L’in´egalit´e des chances. Armand Colin, Paris.
Cameron, S.,and C. Taber(2004): “Estimation of Educational Borrowing Constraints Using Returns to Schooling,”Journal of Political Economy, 112(1), 132–182.
Carneiro, P., and J. Heckman (2002): “The evidence on credit constraints in post- secondary schooling,”Economic Journal, 112(482), 705–734.
Davies, S., and N. Guppy (1997): “Fields of Study, College Selectivity, and Student Inequalities in Higher Education,”Social Forces, 75(4), 1417–1438.
Duru-Bellat, M. (2002): Les in´egalit´es sociales `a l’´ecole. Puf, Paris.
Page, L. (2005a): “Motivation and Goal Setting, a Prospect Theory Model for Risky Situations,” Mimeo.
(2005b): “Social inequalities in educational choices and Prospect Theory,”
Mimeo.
Rizzo, J., and R. Zeckhauser (2003): “Pushing Incomes to Reference Points – Why male doctors earn more,”Operation Research, 30.
halshs-00203145, version 1 - 9 Jan 2008