Before showing this, we have extended the range of parameters for observing the transition. We imagined that the transition is due to the state of cross-linking of the chains before the interaction with proteins: if the chains interpenetrate (semi-dilute regime), This was consistent with the fact that PSS chains were shrunk in the presence of protein.
In this case, c* of the chains must correspond to one of the pure polyelectrolyte solutions. Hydrogenated protein and a mixture of hydrogenated and deuterated PSS have been used for the measurements of the conformation of the PSS chains. The threshold between these two regimes would then be set by the overlapping critical concentration of the chains c*.
As noted in [4], the arrangement of the PSS chains in the gel structure is very close to the one of a pure solution of PSS chains in semi-dilute region. But changing the dilution will affect the conformation of the chains and the measurement will be meaningless. The total volume fraction of chains in the solution is the sum of the volume fractions of the two types of chains, ΦT = ΦH.
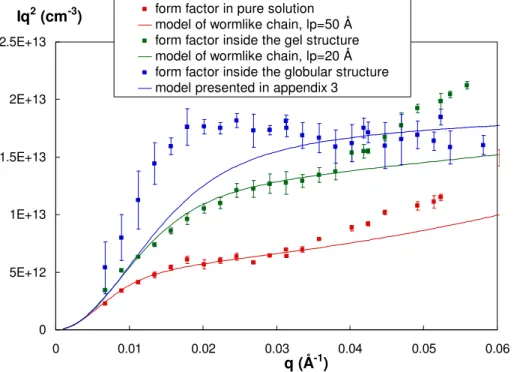
We have first determined the conformation of PSS chains only in solution to check if we find with this measurement method the value of the stability length given in the literature (which was actually obtained for the first time with the same method [24]). The low value of q allows one to check if one recovers the molecular weight Nw of the PSS chains [35]. It is the sum of the intrinsic stability length which is due to chemically rigid chains (~ 10 Å) and the electrostatic stability length due to repulsion between charged monomers [36].
The shift of the peak was previously observed [4] and attributed to a shrinkage of the mesh of the PSS network. At smaller q the scattering such as q-4 disappears; this is the surface scattering of the large dense spheres (radius greater than 300 Å). 20 This intrachain scattering factor is compared in Figure 4 with the shape factor of the pure PSS previously determined in a Kratky plot.
This is consistent with the fact that the inner volume of the beads is not fully accessible to the chains due to the presence of proteins. A closer look at the conformation of the PSS chains allows us to understand how both structures are formed. This suggests that some parts of the chains are not complexed with lysozyme and remain free in solution.
This conclusion is made possible by measuring the form factor of chains in the complexes.
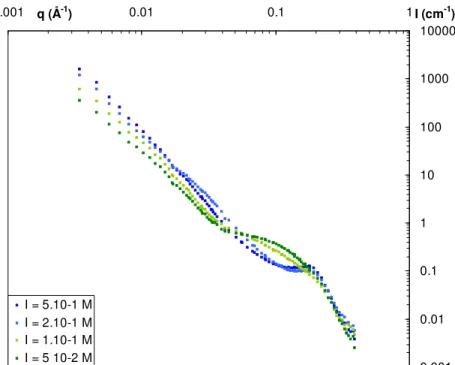
SANS determination of the gel/globule threshold when ionic strength is varied In this series of experiment, 4 samples have been prepared with the same amount of protein (40 g/L)
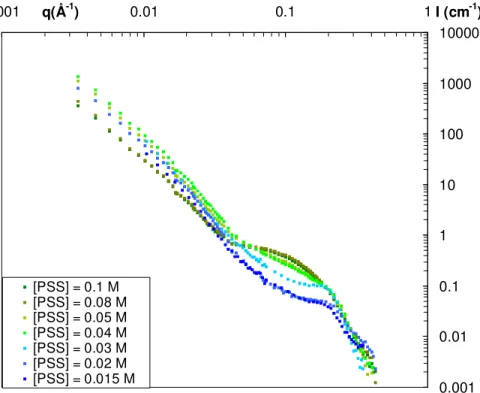
In this series of experiments, 6 samples were prepared with the same amount of protein (40 g/L) at a fixed ionic strength of I = 5.10-2 M in a 100% D2O solvent (matching the PSS scattering). The concentration of deuterated PSS chains was varied from 0.015 M to 0.08 M to determine the threshold between the gel regime and the globular regime as a function of the concentration of PSS chains. For the highest concentrations of PSS chains (0.08 M and 0.1M), the structure formed is the gel (the scattering spectra show the typical q-2.5 decay behavior at low q and the absence of correlation peak at high q).
Then for lower concentrations, the scattering decay at low q shifts progressively from a q-2.5 behavior to a q-4 behavior for lower concentrations in PSS chains while the characteristic peak of the correlation at q = 0.2 Å-1 of the globular regime begins to appear. The threshold between gel and globular structure can be determined to be at a concentration of PSS chains of 0.08 M. 25 typical features of globules (correlation peak at 0.2 Å-1 and decay of the q-4 distribution at intermediate q) and typical gel features for the two lowest ionic strength (q-2.5 breakdown of the distribution at low q) The threshold between gel and globular structure can be defined in the following ionic strength range: 1.10-1 < I < 2 ,10-1 M.
Attempt of adjustment of the PSS form factor signal in the globular structure In order to adjust the signal of the PSS chains inside the dense globules we have assumed that the
25 typical features of the spheres (the correlation peak at 0.2 Å-1 and the q-4 scattering decay at intermediate q) and the typical features of the gel for the two lowest ionic strengths (the q-2.5 scattering decay at low q) . The threshold between the gel and the globular structure can therefore be defined in the following range of ionic strength: 1.10-1 < I < 2.10-1 M. To adjust the signal from the PSS chains inside the dense globules, we have assumed that the .
In the globular regime, we showed in [5] that the globules are surrounded by a shell layer coexisting with free chains when [-]/[+]intro = 3.33. To account for the signal of these free chains, we have considered them to be a standard wormlike chain behavior with the persistence length of pure solutions of PSS chains. The final result of the form factor is a linear combination of the signals of Gaussian chains and worm-like chains taking into account the amount of free chains.
We chose to determine the error bar of each experimental value by evaluating the null extrapolation corresponding to the highest slope and the lowest slope provided by the data, respectively. Since a small error in the preparation of the samples can have a dramatic effect on the curve for the sample with the lowest ΦD (0.25), we therefore sometimes rejected an experimental value corresponding to this volume fraction when we calculated the make null extrapolation (eg the sample corresponding to the pure chains of PSS, see Figure 3). Please note that the error bars are larger when the structure factor affects the total scatter more.
This is the value we have taken to fit the data in absolute scale. protein dispersion, all the curves are shifted from one to the other by a decade for clarity. 32 Figure 2: Principle for measuring the form factor of a PSS chain by contrast matching in a SANS experiment. a) Measurement in pure solutions of PSS chains. For each drawing, lysozyme and PSSh chains are both in black and PSSd chains in white, either in 100% H2O solvent (gray, top sketch) or in a 57% H2O/43% D2O solvent (black, bottom sketch).
SANS spectra for the four ratios of deuterated chains in a 57%/43% H2O/D2O solvent (open symbols) and extrapolation of the PSS form factor (red filled squares). Blue line : model of a linear combination of a factor of Gaussian chains with an effective radius of gyration of 85 Å and of a worm-like chain (lp = 30 Å. SANS spectra for the four ratios of deuterated chains in a 57 %/43% H2O /D2O solvent (open symbols) and extrapolation of the PSS form factor for the PSS within the complexes (green filled squares).
SANS spectra for four ratios of deuterated chains in a 57%/43% H2O/D2O solvent (open symbols) and PSS form factor extrapolation for PSS within complexes (blue filled squares). At the two lowest concentrations of PSS, the signal coming from free protein was subtracted (see [5] for full details).
![Figure 3. Conformation of a PSS chain in pure solutions of PSS chains ([PSS] = 0.1M, I = 5 10 -2 M)](https://thumb-eu.123doks.com/thumbv2/1bibliocom/464559.70043/34.918.106.624.74.537/figure-conformation-pss-chain-pure-solutions-pss-chains.webp)
![Figure 5 : Conformation of a PSS chain in complexes with a gel-like structure. ([Lyso] = 40g/L, [PSS] = 0.1 M, I = 5 10 -2 M)](https://thumb-eu.123doks.com/thumbv2/1bibliocom/464559.70043/36.918.107.619.77.532/figure-conformation-pss-chain-complexes-like-structure-lyso.webp)
![Figure 6 : Conformation of a PSS chain in complexes with a globular structure. ([Lyso] = 40g/L, [PSS]](https://thumb-eu.123doks.com/thumbv2/1bibliocom/464559.70043/37.918.107.624.104.576/figure-conformation-pss-chain-complexes-globular-structure-lyso.webp)