HAL Id: hal-00641604
https://hal.archives-ouvertes.fr/hal-00641604
Submitted on 16 Nov 2011
HAL
is a multi-disciplinary open access archive for the deposit and dissemination of sci-
L’archive ouverte pluridisciplinaire
HAL, estdestinée au dépôt et à la diffusion de documents
Chemical composition and mass flow measurements in a supercritical reactive flow for hypersonic real-time
application
Nicolas Gascoin, Philippe Gillard, Marc Bouchez
To cite this version:
Nicolas Gascoin, Philippe Gillard, Marc Bouchez. Chemical composition and mass flow measurements
in a supercritical reactive flow for hypersonic real-time application. Aerospace Science and Technology,
Elsevier, 2010, 14, pp.266-275. �10.1016/j.ast.2010.01.007�. �hal-00641604�
Chemical composition and mass flow measurements in a supercritical reactive flow for hypersonic real-time application
Mesures de composition chimique et de débit dans un écoulement réactif supercritique pour une application hypersonique en temps réel
N Gascoin1*, P Gillard1 and M Bouchez2
1PRISME/LEES, 63, avenue de Lattre de Tassigny – 18020 Bourges Cedex
2MBDA France, 8 rue Le Brix – 18000 Bourges
Abstract. In the framework of the hypersonic propulsion, ensured with fuel cooled Supersonic Combustion Ramjet, it is necessary to provide adapted measurement methods for the cooling regulation as for the control of the engine thrust. The sensors should be robust because of the extreme in-flight conditions, of vehicle acceleration and vibration, of the fluid temperature (1500 K) and pressure (3.5 MPa) and of the multi-component supercritical mixture. Their response time should be lower than one second. Therefore, a large range of real time and on line measurement methods has been tested and some of these methods among the most promising are presented in this paper. The aim is not to necessarily develop a new technology but to evaluate the feasibility and the adaptability of existing ones for our purpose, even if those are not especially dedicated for such extreme conditions. First, a numerical analysis is conducted and second, some of the techniques are experimentally tested. Two of them, the sonic throat and the Fourier Transform Infra Red spectroscopy (FTIR), appear to be particularly promising and allow only few percents of uncertainty. The first one gives information on the mass flow rate of a supercritical reactive mixture. The second one characterizes the chemical composition before injection in the combustion chamber, for mole fraction greater than 5-10 %.
Résumé. Dans le cadre de la propulsion hypersonique, assuré par super-statoréacteur refroidi par le carburant, il est nécessaire d'apporter des méthodes de mesure adaptées pour la régulation du refroidissement et le contrôle de la poussée du moteur. Les capteurs doivent être robustes en raison des conditions de vols extrêmes, des accélérations et vibrations du véhicule, des températures (1500 K) et pressions (3.5 MPa), du mélange supercritique multi-espèces. Leur temps de réponse doit être inférieur à la seconde. Ainsi, une gamme étendue de méthodes de mesure temps réel et en ligne a été testée et certaines de ces méthodes, parmi les plus prometteuses, sont présentées dans ce papier. Le but n'est pas nécessairement de développer une nouvelle technique mais d'évaluer la faisabilité et l'adaptation de certaines existantes pour notre propos, même si celles-ci ne sont pas spécialement conçues pour cela. Une évaluation numérique est d'abord conduite puis certaines techniques sont testées expérimentalement. Deux d'entre elles, le col sonique et la spectroscopie infra-rouge à transformée de Fourier (IRTF) apparaissent comme particulièrement intéressantes et devraient conduire à des incertitudes de quelques pourcents. La première permet d'évaluer le débit massique du fluide supercritique multi-espèces. La seconde caractérise la composition chimique avant injection dans la chambre de combustion, pour des fractions molaires supérieures à 5-10 %.
Keywords : endothermic fuel pyrolysis, supercritical state, mass flow meter, chemical characterization, SCRAMJET.
Mots Clés : pyrolyse endothermique de carburant, état supercritique, débitmétrie massique, caractérisation chimique, Super-statoréacteur.
1. Introduction
Hypersonic flight (over Mach 6) is expected to be achieved in the coming years by means of supersonic combustion ramjet (SCRamjet) [1]. For such high velocity, the total temperature of
* Corresponding author: E-mail adress: Nicolas.Gascoin@bourges.univ-orleans.fr (N. Gascoin)
external air, considering the flow velocity, can reach 1650 K at Mach 6 and 4950 K at Mach 12.
This produces a dramatic heating, which is added to the heat flux coming from the combustion heat release. Even composite materials could not withstand such a large heat load. Furthermore, the time allocated for the combustion in SCRamjet mode is about 1 ms. The thermal management of the overall vehicle and more specifically of the combustion chamber is thus an important focus for the aerospace research [2]. In this framework, the COMPARER program (COntrol and Measure of PArameters in a REacting stReam) has been proposed by the company MBDA-France and by the University of Orléans. It consists in studying the following cooling strategy and in testing suitable measurement methods for the regulation. Indeed, an integrated solution using the fuel is considered. The hydrocarbon fuel is injected in a channel, which surrounds the engine. A pin fin configuration is used in the cooling channel to enhance the heat transfers. The structure is mainly composed of the ceramic matrices composite [3]. A counter-flow heat exchanger is thus available towards the burned gases. When heated above 800 K, the fuel is pyrolysed and thanks to its endothermic behaviour, it increases the active cooling of the hot walls. This pyrolysis produces lighter hydrocarbon species with shorter ignition delays than the initial fuel. This is particularly interesting for the combustion because of short residence time in the combustion chamber. It is important to note that the expected high pressure in the cooling loop (>3 MPa) causes the fluid to become supercritical in the channel. The internal wall of the cooling channel can be porous;
creating a thin film cooling that contributes to protect it from the hot gases. Hydrogen could be used as cooling fluid but due to safety and ease of storage reason, hydrocarbons are often preferred for flight Mach number under 8.
The complete system is a coupled process. The engine thrust depends on the chemical fuel composition injected in the combustion chamber but this composition is linked to thermal heat flux applied on the cooling channel. The latest is related to the combustion of air with pyrolysis products. Because of this interaction between combustion and pyrolysis, it is useful to have information during the flight about the fuel composition. Furthermore, to control the thrust and the cooling, the mass flow rate of the injected fuel is required. It is not equal to the one pumped out of the tank because of carbon deposit along the channel during the pyrolysis process, because of transpiration through the porous wall and because of compressibility effect in supercritical flow.
Consequently, the COMPARER project aims at studying hydrocarbon pyrolysis and possible instrumentation thanks to a specific numerical modelling and to an experimental test bench.
The code, called RESPIRE (a French acronym for SCRamjet Cooling with Endothermic Fuel, Transient Reactor Programming), is a one dimensional program able to simulate the hypersonic vehicle cooling as well an academic chemical reactor heated by a furnace. It considers an existing detailed n-dodecane pyrolysis mechanism (1185 reactions, 153 species) [4] but it could treat other fluids with appropriate chemical scheme or with data tables giving the fluid properties [5]. The n-dodecane is used because of its purity and because it is representative of aeronautic kerosene. The test bench is particularly suitable for hydrocarbon pyrolysis at supercritical state (1900 K, 8 MPa) under stationary conditions but it aims at studying transient test cases too [6].
Both these tools have been used to identify some characteristic parameters of the pyrolysis phenomena [7]. The measurement methods under study in this paper are based on these parameters. Considering the chemical characterization, it is not mandatory to know the complete and detailed composition in real time for the control of the operational fuel-cooled engine. If about 90 % of the pyrolysis products quantity is obtained with four or five species, it would be sufficient to monitor their concentration for the control and combustion estimation. The ignition delay is a good indicator of the fluid capacity to burn [7]. This delay can be related to the chemical composition and particularly to light species such as methane or ethylene [8]. Consequently, the measurement method should focus on the detection of some chemical species, which will be related to ignition delay to predict their combustion, thus the thrust.
For the industrial use, the required accuracy is limited because the purpose is not to develop a specific technology but rather to evaluate the ability of the existing ones to give quantitative information and to use a commercial on-shelves sensor. The originality of this study is to test real- time and on-line methods under the conditions and for a purpose, to which they are not a priori dedicated. Rather than developing new technologies, it should be faster and cheaper to test some, for which the reliability is recognized. The present work uses an innovative approach because it
involves in-depth numerical calculations to evaluate a wide range of methods before testing it on the experimental bench. As far as we know, there is no similar work in the literature.
We have shown in previous works that the chemical composition of pyrolysed mixture is complex (more than hundred of compounds [7]). Furthermore, the fluid becomes supercritical because of the temperature and the pressure inside the cooling channel. Despite the large use of supercritical fluids in pharmaceutical or food-industries fields (mainly CO2 and H2O), the properties of supercritical mixtures and their experimental characterization (mass flow rate, viscosity, density,…) are still missing. Only few studies are available with measurements. These ones mainly consider CO2 or H2O [9], which do not yield to difficulties such as carbon deposit or multi-species flow. These fluids are studied at a temperature below 800 K for which it is easier to ensure the thermal withstanding of sensor (rather than at 1500 K for example). Some hydrocarbons are also studied but only as pure components at a temperature where pyrolysis does not appear [10]. The few studies considering supercritical hydrocarbons mixtures do not present real time measurements, but only a posteriori measures under non-supercritical state [11].
Because of the extreme conditions of temperature (1500 K at least) and pressure (3.5 MPa at least), and because of the unknown chemical composition of the fluid, commercial mass flow meter are not able to operate, whatever their principle [12] (even Coriolis flow meter). Due to the pyrolysis process inside the cooling channel, we have shown a probable high carbon deposit rate depending on the nature of the channel material [7]. This results in a jamming up which could disturb the instrument. Furthermore, a radial thermal gradient of about 40 K may appear inside the cooling channel [13]. This results in potential heterogeneity in the fluid flow, which makes the measurement difficult. In addition, the instruments have to provide real-time on line measurements (one measure or more per second). At Mach 8, one second corresponds to a distance greater than 2 km. It is not reasonable to obtain less than one measure during one second. The sensors should be robust and compact enough in order to be used for hypersonic in-flight application, subjected to various vibrations of unknown frequency and strong acceleration, with limited mass and bulk requirements.
The paper covers a very important and difficult topic: the measurement of composition and flow in a real-time harsh environment. A deliberate and scientific approach to screen the problem is taken to found possible real life and applicable solutions. The aim of this paper is to present some of selected real-time measurement methods, which can be suitable for onboard applications under extreme conditions. The first category focuses on the mass flow rate whereas the second one is dedicated to the chemical characterization. The principles of these technologies will be presented such as their evaluation for stationary and transient use, their accuracy and their suitability for an industrial use. The measurement of the fluid temperature in the cooling channel is possible thanks to an immersed thermocouple and it does not need to be studied presently.
2. Mass flow rate measurement
Several methods have been tested to evaluate their adaptability to the present purpose.
Their maximum uncertainties must be much lower than around 10 % of the initial mass flow rate, which corresponds to the mass loss due to carbon deposit and filtration through the porous wall.
For a first step, the error committed on the mass flow rate determination at the cooling channel outlet should be of the order of 10 % of the fluid quantity filtrating through the porous structure.
That is to say approximately 1 g.s-1. The range of measure should be from 10 g.s-1 to 200 g.s-1. For standard applications, in the range of 100 K to 800 K and/or from 0.1 MPa to 50 MPa, many mass flow sensors are commercially available. They are of great interest depending on the specificity of the application : the nature of the fluid and its phase, the possible multi-phases flow, the pressure and the temperature of the application, the environment conditions, the dynamics of the measure, the accuracy and the repeatability for example. Several mass flow meter technologies are adapted to liquid and gas phases, in particular the following ones : ultrasonic, Vortex, electromagnetic, Coriolis, thermal, volumetric or based on the pressure. However, these measurement instruments are not specifically designed for our application.
If the fluid temperature is known locally just before and just after a heating resistor, it should be possible to evaluate the mass flow rate with a calculation of thermal balance for local heat exchange. This requires measuring also the channel wall temperatures, which participates to
local heat transfer. Nevertheless, this simple method is not suitable for our purpose because all the computations conducted on this point give a maximum error on the mass flow rate of a factor 2 [14]. The error related to this method is due to the complex heat transfers in geometry with pin fin, in which much more detailed temperature cartography should be available to accurately determine the local mass flow rate. This is absolutely disqualifying.
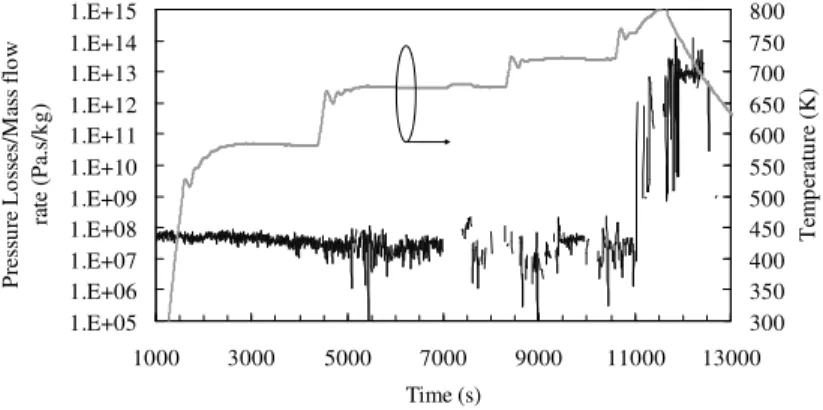
Other measurement methods have been numerically and/or experimentally tested at the laboratory. For example, a mass flow meter using the Venturi principle could be suitable for our purpose if some parameters are obtained thanks to data tables. The Venturi is mainly adapted to perfect fluids, weighing and uncompressible such as the non-viscous liquids. It allows linking the pressure loss to the flow speed thanks to the Bernoulli formula. This is a stationary method but due to its simplicity, it has been considered for this study. A 140 mm long stainless steel reactor with internal diameter of 0.9 mm has been inserted between two pressure transducers with accuracy of 0.1 % of the calibrated range, which is 0 bar-70 bars. Despite the limited accuracy, under homogeneous liquid phase flow conditions, the mass flow rate can be estimated by pressure losses measurements. But when the pyrolysis reaches a rate of about 20 wt.% after 10000 s of test duration length (Figure 1), the possible change of phase and multi-species flow makes the signal difficult to analyse. The ratio of pressure losses on mass flow rate depends not only on the friction coefficient or on the density but also on the bulk formation or on the reactor inclination.
Furthermore, the required measure precision (few Pascal for the pressure losses due to the considered specific surface mass flow rate) is estimated to be too high for our in-flight application even with differential pressure sensor. Other methods based on the pressure loss measurement (for example with unsteady measurement such as Vortex method) have also been tested but none of them seems very promising. Consequently, the following section focuses on a numerical and analytical study of the two most promising technologies only, considering all the limitations explained in the preceding part.
2.1. The hot wire
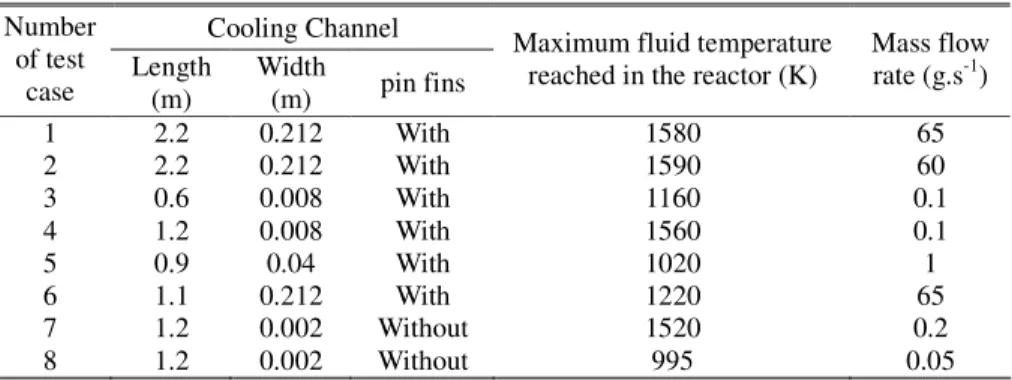
Considering the well-known principle of the hot wire [15] to determine the flow velocity, based on the Seebeck effect [16], it may be possible to obtain the mass flow rate. But first, it is necessary to know the density. For this purpose, the code developed in the framework of the COMPARER project has been used [5]. A wide range of different test cases has been considered (Table 1) for an operating pressure of 3.5 MPa. The standard configuration corresponds to an academic chemical reactor inserted in a furnace but the three calculations, with very high mass flow rate (over 60 g.s-1), are related to the cooling channel of the SCRamjet. The temperature profiles along the channel are not the same for all the cases. Consequently, the chemical compositions at the process outlet are different for all the computations because of the different geometries, mass flow rates and temperature profiles. This ensures a large representativity of the results to be obtained in this section.
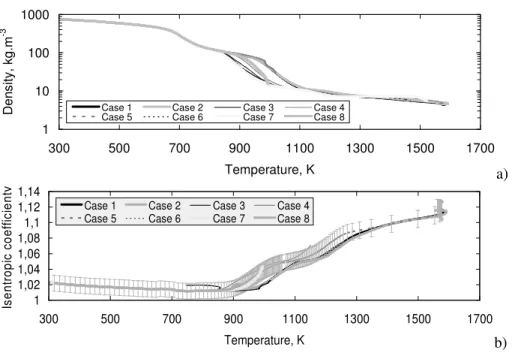
For these various different pyrolysis cases, the density is approximately a function of temperature, whatever the chemical composition (Figure 2a). A common behaviour is observed over 1100 K (with a discrepancy lower than 3 %) and of course under 850 K where no pyrolysis appears. The same trend is obtained for the isentropic coefficient (Figure 2b), which will be used later (section 2.2). The decomposed fuel temperature is waited to be greater than 1300 K near the cooling channel outlet in real SCRamjet configuration. It can be concluded that the density can be tabulated as a function of the temperature, for a given pressure. The mass flow rate is directly proportional to the density, so that there is the same uncertainty on the mass flow rate (3 %). This remains quite acceptable for the COMPARER project.
−
−
= − )
( .
initial wire,
wire 1 1 (1 . )
)
( A
t B
e T B B
t
T (1)
The measurement frequency of the hot wire depends notably on the wire diameter and it can be computed. To obtain a sufficient accuracy, it is preferable to consider a hot wire at a much higher temperature than the fluid. If the tungsten wire is heated electrically at a temperature around 2500 K for example, it is possible to compute its response time in the fluid flow depending on its diameter. The convective cooling of the wire governs the transient wire temperature (1) with the
following constants
fluid wire wire
wire wire
T S h
Cp
A= m and
fluid
1
B=T where mwire is the mass of the wire, Cpwire its isobar heat capacity,
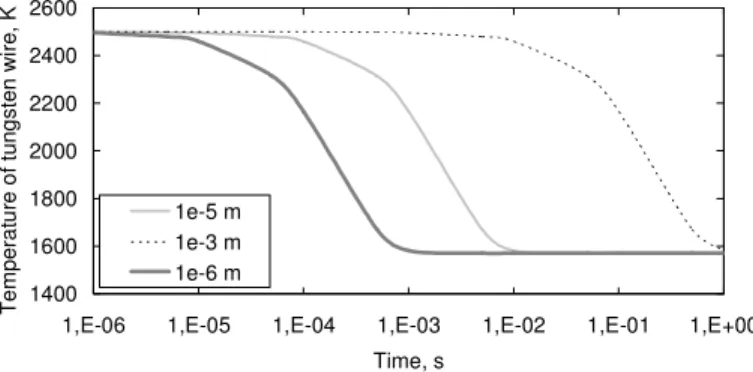
Swire its convective exchange surface, hwire the convective exchange coefficient and Tfluid the fluid temperature. Considering the variation of tungsten heat capacity with its temperature, thanks to the NIST database [17], three diameters are calculated for a given numerical flow case. For this test configuration, the channel wall temperatures are given, the fluid temperature is 1570 K, the flow speed 27 m.s-1, the cross-section 5.3.10-4 m² and the convective coefficient 3800 W.m-2.K-1 (Figure 3). A 10-5 m diameter has a time constant of about 2.10-3 s, which seems to be sufficient for our study under transient use because its response time is much lower than one second. This allows continuing the study of the hot wire on a more concrete aspect.
The hot wire is based on two different principles. For the first one with fixed intensity, the wire temperature is not constant. The resulting variation of the electric resistance is measured. The second way is to fix the wire temperature thanks to a Wheastone bridge. The applied voltage is linked to the flow speed by the King's law [15]. A preliminary calibrating is required. Eq.(2) gives the wire electric resistance Rwire,T at the temperature T with Rwire,300K the electric resistance at 300 K and CT,wire the temperature coefficient of the tungsten [18]. Its value corresponds to the absolute sensor accuracy and its derivative is the relative one. A wire diameter of 10-5 m presents a resistance comprised between 10 Ω and 20 Ω, between 1570 K and 2500 K. This is convenient for a sensor because there is no problem to measure it.
)) 300 .(
1 .( ,wire
wire,300K
wire, =R +C T−
R T T (2)
Considering a 10 V alimentation, an electric intensity of around 1 A should be applied to the wire. This value is necessary to heat the wire at a temperature near 2500 K and it is acceptable for the sensor. Furthermore, the intensity I needed to compensate the wire cooling in the fluid flow is 0.15 A (3). The electric power Ρelec, resulting in thermal power through the Joule effect, is equal to the convective heat flux between the wire and the fluid with an efficiency of one. All these data are acceptable for in-flight applications.
R T T S h
I2 Relec wire wire( fluid− wire) Ρ =
= (3)
The sensor should also be interesting for transient measurement. A mass flow rate gradient, which is representative of the variation that can be encountered in real fuel-cooled engine, is studied presently. A test case (to be compared to the one related to the Figure 3), with the same channel wall temperatures, has been used with a lower mass flow rate (60 g.s-1 instead of 65 g.s-1).
The outlet fluid temperature decreases from 1570 K to 1556 K. Thanks to previous equations (1 to 3), it is possible to determine that the hot wire needs 0.1 s to stabilize between these two temperatures. It corresponds to an intensity variation of 1 % (0.15 A). This is perfectly admissible for our purpose. Finally, it is previously required to calibrate the hot wire to measure the flow velocity. This calibration has to be done for various densities, whatever the chemical composition.
Then, data tables should be used for appropriate density, which is estimated depending on the temperature measurement (as seen in Figure 2).
As a conclusion, the technology of hot wire could be applicable to measure the mass flow rate. The wire has the advantage to be compact and hopefully robust enough in terms of mechanical and thermal strength in flows, which velocity is lower than few tenth of meter per second. A technical solution has even been thought to directly integrate such a sensor in the conception of the cooling channel with thermal and electric insulation towards this one.
Nevertheless, the hot wire has some drawbacks that have to be taken into account. This intrusive technology may locally increase the pyrolysis process in the surrounding boundary layer because its temperature exceeds the temperature of the fluid. Furthermore, if carbon deposit appears on the hot wire, due to coking activity during the pyrolysis, it could disturb the heat transfer between the fluid and the wire. It has to be noticed that the principle of the hot wire could also be used with a cooled wire, which gives the same advantage but without the local pyrolysis issue. The cooling of the wire could be obtained thanks to the Peltier effect [16]. For a diameter of 10-5 m, the response time is evaluated to be 10-2 s in order to have a stabilization of the wire from 1570 K to 1000 K.
2.2. The sonic throat
In the minimal section of the cooling channel, the flow velocity is exactly sonic particularly (but not only) if the downstream pressure is at least 0.528 lower than the upstream one (for an isentropic coefficient of 1.4). This appears presently in the cooling channel of the SCRamjet because the operating pressure is higher than 3.5 MPa and because the fluid is injected in the combustion chamber at a pressure around 0.2 MPa. Consequently, it may be possible thanks to Eq.4 [19] to obtain the mass flow rate m& in this minimal section
S
throat by measuring Ptot, the total pressure. c* is the characteristic velocity. Because the static pressure Ps is easier to measure, Eq.5 is used with a Mach number Μ of 1 in the throat, wherev p
C
=C
γ is the isentropic coefficient with Cv the isochoric heat capacity. It is thus required to compute the characteristic speed (6), which is the inverse of the flow rate coefficient CD, with
r MR
= the fluid constant, R the perfect gases constant and M the molar mass.
throat * tot
.1 .S c P
m&= (4)
2 1
tot
s .
2
1 1 −
−
− Μ
+
= γ
γ
γ P
P (5)
( 1) 0.5
2 1
D *
. 1
2
1
×
= +
=
− +
T r
C c γ
γ
γ γ
(6) In theory, the sonic throat is adapted to perfect gases flow with constant isobar heat capacity. Thus, it has to be tested in the specific conditions of our application. The static fluid temperature is required to determine the characteristic velocity. It can be easily measured at the minimal section with a thermocouple. Therefore, it is only needed to determine the isentropic coefficient
γ
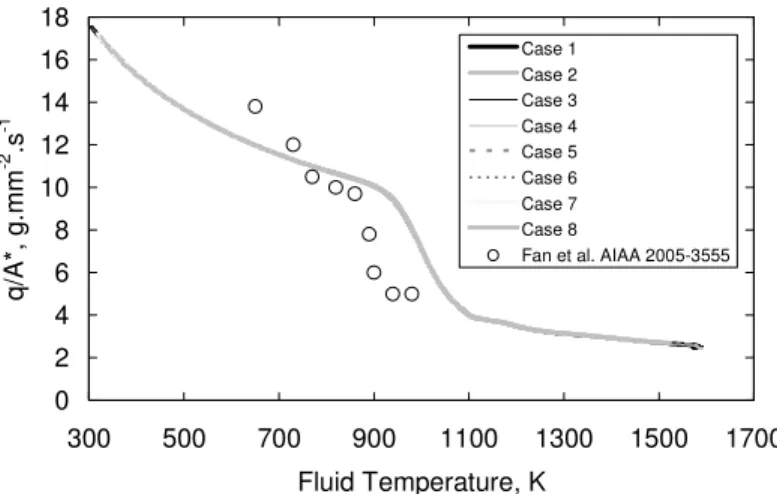
and the fluid constant r. These two parameters have been linked to the fluid temperature in order to build data tables. They have been calculated for the conditions given by the table 1. The isentropic coefficient (Figure 2b) appears to be mainly a function of the temperature, whatever the chemical composition, the residence time inside the cooling channel or the applied heat fluxes. The error bars correspond to ±10 %. This allows considering the isentropic coefficient as a function of temperature over a wide range, and particularly from 1300 K and above. The discrepancy is thus lower than 1 %. The same is observed for the fluid constant r. Consequently, it is possible to use data tables based on measured static temperature.Thanks to the above equations (4 to 6), the mass flow rate is known as a function of temperature for all the test cases. As a result, a sonic throat is numerically simulated for each point of the cooling channel. The resulting mass flow rates obtained for the cases of table 1 have been divided by the cross section area of the throat and are plotted as a function of temperature (Figure 4). The ratio of the mass flow rate on the cross section is directly linked to the temperature for all the calculations, despite the fact that the test cases are of various nature : length and width of the channel, with or without pin fins geometry, boundary temperature profile, mass flow rate, chemical composition. Furthermore, the results of Fan et al. [20] have been added afterwards on the figure to compare our numerical results about n-dodecane pyrolysis to their experimental measures on Chinese kerosene. Due to the chemical discrepancies between the fluids, the trends are qualitatively comparable but not quantitatively. Nevertheless, this is very encouraging. The results are good enough to be confident for using the sonic throat on supercritical multi-species flow.
The advantage of this non intrusive measurement method is its simplicity because it only needs to have a controlled minimal section and a measure of the static pressure and temperature at the throat. There is no chemical perturbation and the accuracy is about 1 %, which is better than the hot wire. Of course, in case of cross-section reduction due to coke deposit, the accuracy could be not so good. The crippling due to carbon deposit could be a problem if it disturbs the
temperature and pressure measurements or if it reduces the section importantly. A solution to reduce the coking activity could be to use CMC (Ceramic Matrix Composite) structures in order to avoid catalytic effect.
It is planned to test the sonic throat on the COMPARER test bench, at the end of 2009, at pressure and temperature as high as 6 MPa and 1500 K. For the industrial use, such a sensor is compact and robust. Its response time is roughly the one of temperature and pressure measurements. It could be preferably implemented near the injection hole, between the cooling channel and the combustion chamber. These holes present naturally the minimal section of the cooling channel.
3. Characterisation of the chemical composition
The composition of the main pyrolysis products (less than 5 to 6 species representing over 75 mol.%) is seek with an accuracy better than 2 mol.% for each compound. Each of the other species (several hundredths) present quantity lower than 1 mol.% and have only a minor impact on the ignition delay. The major species present mole fraction from 5 to 50 mol.%. This is the range of measures, which is wanted. Depending on the application, several analysis instruments are commercially available for very accurate measure on chemical compositions. For example, the mass spectrometer (MS) [21] allows identifying and quantifying all the components in a mixture, even some part per billion (ppb). It should be coupled preferably to a compound's separation system such as a Gas Chromatograph to ensure the identification step. Unfortunately, this is rather a laboratory technique, which requires at least several minutes to get the quantification of products. Vacuum pumps are also needed. This entire system is not adapted to the transient measurements and to the control purpose. Analysis methods, such as Gas Chromatograph with common detectors like flame ionisation one [22], are also not suitable for the same reasons.
Consequently, another kind of technology has to be used in order to characterize the chemical composition on a fuel-cooled system but with a probable lower accuracy. Thus the optical methods have been evaluated.
They can be passive and non-intrusive and they present a good response time (about one second). The only drawback could be the crippling of optical windows with the carbon deposit. A solution could be to protect these windows with a very thin and controlled nitrogen flow between the pyrolysed fuel and the window. Such technique is used for particle size analyzers measurement for example [23] and has already been tested in SCRamjet engine with limited air or nitrogen film injection [24].
In the optical technologies, the spectroscopic ones are the most interesting because they are common, well known and suitable for transient measurement [25]. Even if their size are still quite important, some new compact apparatus are now available with integrated optical lens, which is interesting for in-flight applications. The active methods, which stimulate the species, are particularly useful for low temperature flows with low signal or for very diluted mixture [26]. For example, the CARS (Coherent Anti-Raman Stokes) technology is used to track some species in combustion. However, for measurement in pyrolysed mixture at temperature up to 1500 K, and for pressure higher than 3.5 MPa, the passive methods have proved to be sufficient [10]. The Infrared spectroscopy (0.7 µm-100 µm) has also been used by MBDA-France and by its partners in the RAPIERE project to evaluate the combustion efficiency in the combustion chamber [24]. Thus, it is proved to be suitable for online onboard real-time measurement but also for first on-ground industrial setup. The FTIR method, based on optical interference treatment, was not impacted by the heavy vibration loads, which were observed during the tests. The wave length range still requires to be studied depending on the species to be identified and quantified. The hydrocarbons are visible in Infrared range but not in Ultra-Violet (10 nm – 400 nm) because they are fluorescent in this range [27]. This is the contrary for hydrogen. Hydrogen is not studied in this paper because its production is limited to few percent in mass during the pyrolysis process in the cooling channel.
It represents a molar fraction in the pyrolysed mixture lower than few percents. Furthermore, the hydrogen quantification has been treated in previous paper [28]. It is notably possible by means of thermal conductivity to detect and to quantify it [7].
The Fourier Transform InfraRed spectroscopy (FTIR) [29] is commonly used in industrial plants as control tool for example to detect hydrocarbons traces in pure nitrogen or oxygen flow.
This is a robust and easy to use technique. FTIR is sometimes linked to thermogravimetric analysis (TGA) in laboratory setup to study decomposition phenomena, such as pyrolysis process [30]. It is even used as a quantitative instrument but only to quantify one selected specie, which is already identified in the process [31-33]. The spectroscopic quantification methods are based on the analysis of the Infrared spectrum of the fluid because the spectrum depends on the measurement conditions (pressure, temperature, optical length) but also and mainly on the chemical bonds and quantity of the species. The Beer-Lambert law gives the absorbance of the signal notably as a function of the compound concentration. Some authors have used spectroscopic approach to determine a fluid composition but on samples with limited number of components [36-37]. It uses the fact that each chemical bond, and even each chemical species, can be identified by the wavelength corresponding to various excitation modes. For example [29], the ethane presents a vibration mode at 930 cm-1 whereas the acetylene has a one near 850 cm-1 and the methane at 4170 cm-1. The methane has a maximum signal at 2927 cm-1 approximately, whereas the maximum for acetylene is 3340 cm-1.Various similar wavelengths exist for the same vibration mode of different compounds. More details on the theory of infrared signal of molecules can be found in Ref [29].
It is thus possible to identify and quantify at least some selected species. A preliminary calibration of the FTIR is required under the condition of study. This is the main limitation.
Furthermore, it is difficult to quantify more than ten species because it requires to select a spectral zone for each chemical compounds, preferably without interactions with others. Nevertheless, the FTIR can be used to quantify the main species (those who are in majority under high temperature pyrolysis conditions). The other compounds will be quantified after grouping them in families:
alkenes, alkanes, cyclic, aromatic. From a dynamic point of view, several seconds are necessary to obtain an infrared spectrum of a mixture with DTGS (Deuterated TriGlycine Sulfate) detector and about one second with a MCT one (Mercury Cadmium Telluride), which is cooled down by liquid nitrogen. This is acceptable for the present study and it could even be decreased by diminishing the scan number and the spectrum range of signal acquisition. Furthermore, it is expected to link the Infrared spectra to the combustion process. We have shown [8] that to ensure the combustion of the pyrolysis mixture with an ignition delay lower than 0.1 ms (in SCRamjet mode), a minimum concentration of some species (like acetylene, ethylene and ethane) is required. It is notably needed to evaluate the quantity of these species in the mixture.
We present, in this section, the numerical exploitation that has been performed with Infrared spectra. The calculations have been conducted with the HITRAN software [34]. It is based on experimental database on molecular emission and it considers about twenty species over a wide range of temperature and pressure. No interpolation is provided between the data points.
The available hydrocarbons are CH4, C2H2, C2H6. HITRAN is dedicated to atmospheric studies even if an extrapolation is provided at higher conditions. The high temperature version of HITRAN, over 1000 K, is called HITEMP. More information about calculation methods and about uncertainties is given in Ref. [35]. An extrapolation from ambient pressure and temperature to supercritical extreme conditions of the existing database is questionable but this is the only way we have to get spectrum of multi-species mixture under our pyrolysis conditions. This point does not impact on the qualitative interest of the following study.
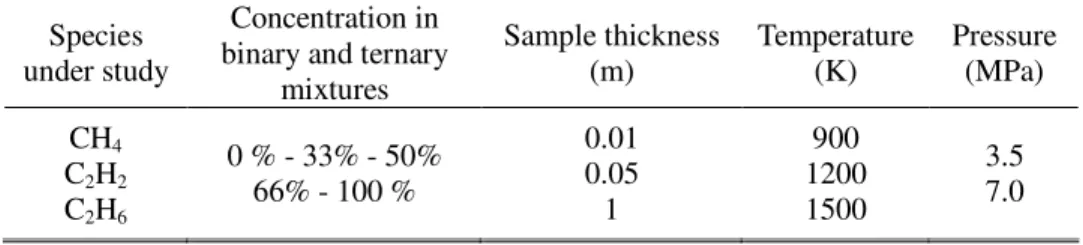
A parametric study has been conducted to check if the results of the software are in conformity with the literature. A wide range of computation conditions is chosen to ensure a good representativity of real conditions (Table 2). It is verified that the temperature enlarges the spectrum lines and increases both the transmission through the fluid and its self-emission. This is due to the thermal excitation of molecules, which vibration modes expand on wider spectral lines.
The pressure has the same effect for the spectrum width but it is slightly weaker. It is attributed to the density increase. This is confirmed by the study of sample thickness and by the sample dilution effects. The signal of diluted sample can also be influenced by the other added species (matrix effect in multi-species mixture). The spectrum of a multi-compound mixture is composed of the spectrum of each species. But it is still required to find the relationship between the spectrum of the mixture and the signals of the pure components (linear relationship or not). It has to be noticed that the spectrum resolution is also an important point because a very fine analysis of some specific lines needs a high resolution (much lower than 4 cm-1).
Thanks to the above considerations and computations, the wavelength of a specific spectral line corresponding to a vibration mode is shown to be related to the compound quantity despite the presence of similar species in the mixture. An example is given in emission for ethane at two temperatures over a wide range of molar fraction (Figure 5). This result is shown for dilution in other hydrocarbons (CH4 and C2H2). For temperatures of 1200 K and 1500 K, a slight displacement of the wavelength related to the maximum luminance peak is shown depending on the quantity of ethane. This could be an interesting parameter to monitor during pyrolysis process.
The accuracy is better for small amounts, under 50 mol.%, which is satisfactory. Indeed, the mole fraction that has been observed experimentally for ethane is much lower than this 50 mol.% [38].
For a molar fraction approaching 0 %, the wavelength does not tend to zero because the vibration mode exists even for a single particle. A fitting equation is proposed for both temperatures but it would be better to have only one, which considers the temperature as a parameter. This method requires a high spectral resolution for molar fraction over 50 % because in this range 1 mol.%
corresponds to a displacement of the maximum peak of 0.1 cm-1. This value is 0.25 cm-1 for mole fraction around 20 % and this is a FTIR resolution which is acceptable for commercial apparatus.
Furthermore, it may be difficult to quantify the ethane for molar fraction lower than 5 %. This is the limitation of the method but it is acceptable for the COMPARER project because the aim is to analyze the major species. The required accuracy is estimated to be of few percent on the absolute mole fraction.
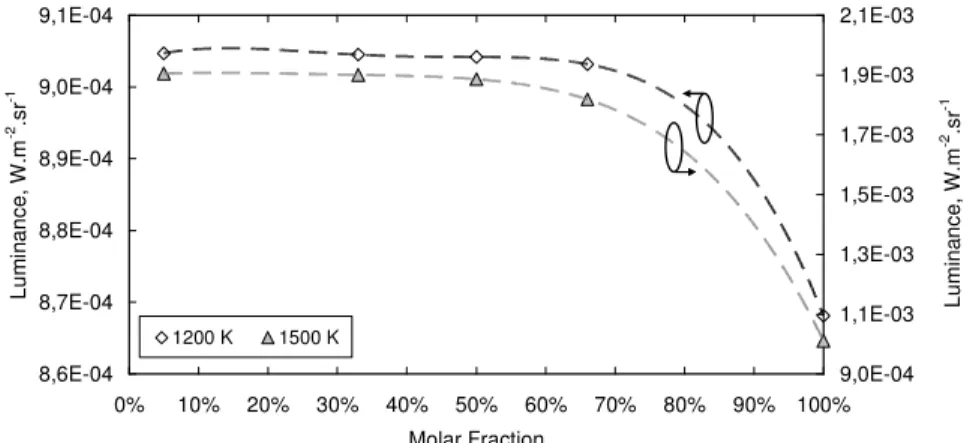
A similar approach has been undergone around 3140 cm-1. Instead of studying the wavelength of the vibration mode, the luminance signal is integrated over the wavelength range (Figure 6). The spectral peak width is used. The higher temperature -1500 K- gives a better sensibility than the case with 1200 K. Indeed, a factor two on the luminance is observed for a mole fraction variation from 5 to 100 mol.%. The results are interesting, in particular for high concentration of ethane, over 50 %, because of the sufficient sensibility of the method. It could be possible to combine the preceding method based on the spectral line position, around 910 cm-1, to quantify low concentration of compounds and the present one based on luminance integration around 3140 cm-1 for higher concentration. The limit between the two methods could be around 50 mol.%. This would allow evaluating the ethane quantity in various pyrolysed mixture. The methane and the acetylene have also been studied and such conclusions have been shown. This is of particular interest for methane for example because it is produced in large quantity (over 50 mol.% at 1400 K). This method can be extended to multi-species mixture because the other components do not have exactly the same infrared spectrum. Even for similar hydrocarbons, the wavelength of a vibration mode for a given chemical bond is function of the compound molar mass.
Finally, the infrared spectroscopy is able to furnish information about chemical concentration for some major species but not for chemical traces (mole fraction under few percent), except in transmission with long optical length. The n-dodecane pyrolysis at high temperature produces mainly hydrogen, methane, acetylene, ethylene and ethane. Information about these components could be sufficient for the chemical characterization, so that for the engine control. The hydrogen is known to be measurable through its thermal conductivity for example but it is also visible in UV as explained before. The IR and UV technology is suitable for onboard, online real-time measurement. Considering only few species decreases highly the post-treatment time. Furthermore, this method could need a limited calibration under the conditions of use because the accuracy, which is wanted, remains limited to few mole percent.
Thanks to these promising first numerical results, an experimental work has been started with IR spectroscopy. The real-time quantification of gaseous pyrolysis products is investigated under stationary conditions by comparison with GC/MS data. The RESPIRE code has been used to validate the transient behaviour of the real-time non-intrusive quantification method. An example is given for the n-dodecane pyrolysis with titanium reactor at 10 bars, 0,05 g.s-1 from 300 K to 1100 K (Figure 7). The agreement between the numerical and experimental data is satisfactory from 7000 s to the end of the test. After 7000 s (900 K), the absolute discrepancy between the two curves is found to be equal to 2 mol. % (represented by the arrows). This is largely satisfactory for a combustion purpose. Before 7000s, the strong discrepancy is due to the limitation of the experimental bench to quantify small amount of gas. Indeed, at the process outlet, the pyrolysed
mixture is split in three paths. The main one, about 95 vol %, is directed to the burner for safety reason. About 3 vol% to 5 vol % is analysed by GC/MS-FID-TCD. The remaining part is observed by FTIR. For temperature lower than 850K, the gasification rate is quite low and the quantity, which is provided to the IR spectrometer, is of the order of few tenths of micrograms per second.
The optical cell has a volume of 100 cm3, which is quite big to be filled at the given mass flow rate. At 7000 s, the gazeification rate is 7 wt.% and that corresponds to a sufficient quantity to experimentally get a dynamic of measure close to the one of the process. The quantification limit for small amount may also be responsible for the discrepancies before 7000 s (as explained before with numerical Hitran calculations). A time delay still exists around 10000s (Figure 7b) between both curves. The dynamic of the optical cell is slower than the one of the numerically estimated real process one. At 13000 s, no time delay is observable and the dynamic of the experiments is the one of the process itself. The gasification rate is 66 wt.% at 16000 s. By comparison with GC data under stationary conditions, the quantification limit by the IR method has been found to be 4 mol.% for each specie with an absolute error lower than 2 mol.% depending on the gazeification rate and absolute compounds quantity. Once again, this is comparable to the estimated limit with Hitran calculations.
4. Conclusion
The COMPARER project has been proposed in the framework of the cooling strategy, adopted for the thermal management of the scramjet. It aims at studying the phenomena and their interactions related to the fuel pyrolysis before identifying some characteristic parameters. The final purpose is to propose adapted real-time and online measurement methods for in-flight application. These methods should focus on the mass flow rate measurement and on the chemical characterization of the pyrolysed fluid. Due to the extreme difficulties encountered in the fluid flow (high temperature, supercritical state, multi-species, coke formation) and in onboard conditions (vibrations and acceleration of the vehicle), it has been chosen to evaluate the relevance of existing measurement methods. While the solutions themselves are not new inventions, the paper makes an important scientific contribution by showing how these particular methods may actually work in the considered environment. As far as we know, there are no measure instruments directly suitable for our purpose. A systematic approach has been used to test the suitability of various existing technologies. It has been verified if they are adequate to in-flight transient use (at least one measure per second). Two promising solutions have been found. The sonic throat enables to measure the mass flow rate with an uncertainty of about 1 % (in absence of coke deposit notably). The Infrared spectroscopy chemically characterizes the pyrolysed mixture with an accuracy of 1 to 2 mol.%.
The first numerical study has demonstrated that both technologies are interesting. Even if the FTIR spectroscopy could not be used to determine the exact composition of the fluid, such as a Gas Chromatograph for example, it is proved to give the proportion of some major light species in the mixture. The minimum quantification is about 5 % in mole. For mole fraction around 20 %, the accuracy obtained with a spectrum resolution of 0.25 cm-1 is 1 mol.%, which is very satisfactory for the combustion process management of the engine. The SCRamjet control requires a precision not better than 2 mol.%. A IR method has been found for mole fraction lower than 50 % (position of a maximum peak around 910 cm-1) and a complementary one over 50 mol.% (integration of the peak around 3140 cm-1). An IR measure can be furnished each second. It is of primary importance to estimate the mixture combustion; notably by relating the measures to the ignition delay.
The study presented in this paper has allowed to identify the promising measurement methods, which are now currently developed. A specific test cell has been designed and is used to evaluate experimentally the sonic throat and the IR spectroscopy. The information obtained with this technology are sufficient to chemically evaluate the fluid flow. The work will now focus on the burning ability of the pyrolysis by-products. Knowing the chemical composition is not an aim but only a way of predicting the combustion, thus the thrust of the engine. Nevertheless, this real- time non-intrusive technique could be of great interest in numerous fields, such as in petrochemical plants. Further exploitation of the IR signal has been done. For example, it is possible to identify two spectrum ranges related to gas and liquid phases (if applicable) in the
process. The ratio of peak area is related to the gasification rate, which is linked to the pyrolysis rate. This is a fast and simple way to estimate the fuel pyrolysis for on-ground plants.
Acknowledgements
The authors would like to give sincere thanks G Abraham and S. Bernard for their support on this project and to P Boureau for her help involving the English writing. The present work has been carried out with the contribution of the "Conseil Général du Cher (18)", of the "Conseil Régional du Centre", of the FRED, of the FEDER, of the FSE (European Union Special Funding) and of MBDA-France. The good evolution of the COMPARER project was made possible thanks to the contribution of Y. Parmantier, who is in charge of the project and the coordinator of the
"Pôle Capteurs et Automatismes" of Bourges.
References
[1] Fry R S, 2004, A century of ramjet propulsion technology evolution, Journal of Propulsion and Power, Vol. 20 No. 1 Jan.–Feb. 27–58
[2] Falempin F and Serre L, 2004, LEA flight test program – status in 2004, 40th AIAA Joint Propulsion Conference And Exhibit, AIAA-2004-3344, Fort Lauderdale, Florida, 11 - 14 July 2004
[3] Bouchez M and Beyer S, 2005, Ptah-socar fuel-cooled composite materials structure for dual-mode ramjet and liquid rocket engines - 2005 status, AIAA/CIRA 13th International Space Planes and Hypersonics Systems and Technologies, AIAA 2005-3434
[4] Dahm K D et al., 2004, Experimental and Modelling Investigation of the Thermal Decomposition of n- Dodecane, J. Anal. Appl. Pyrol. 71 865-81.
[5] Gascoin N, Gillard P, Dufour E and Touré Y 2007 Validation of transient cooling modeling for hypersonic application, Journal Of Thermophysics And Heat Transfer Vol. 21 N 1 Jan–Mar 2007 86–94 [6] Gascoin N et al., 2006, Measurements for fuel reforming for scramjet thermal management and combustion optimization : status of the COMPARER project, 14th AIAA/AHI Space Planes and Hypersonic Systems and Technologies Conference, Canberra, Australia, 6-9 Nov.
[7] Gascoin N 2006 Etude et mesure de paramètres pertinents dans un écoulement réactif Ph.D. Thesis available at http://tel.archives-ouvertes.fr/tel-00128418 Orleans University 30/11/06 Bourges
[8] Daniau E, Bouchez M, Herbinet O, Marquaire P M, Gascoin N and Gillard P 2005 Fuel reforming for scramjet thermal management and combustion optimization 13th AIAA/CIRA Hypersonic Conference Capua (Italy) 16-20 May AIAA 2005-3403
[9] Bazaev A R et al., 2003, PVTx measurements for H2O+D2O mixtures in the nearcritical and supercritical regions J. of Supercritical Fluids 26 115-28
[10] Chen X, Yasuda K, Sato Y, Takishima S and Masuoka H 2004 Measurement and correlation of phase equilibria of ethylene+n-hexane+metallocene polyethylene at temperatures between 373 and 473K and at pressures up to 20MPa Fluid Phase Equilibria 215 105–15
[11] Zhao S, Xu Z, Xu C, Chung K H and Wang R 2005 Systematic characterization of petroleum residua based on SFEF Fuel 84 635–45
[12] Gailledreau C Choix d'un débitmètre Techniques de l'Ingénieur R2200
[13] Gascoin N et al., 2006, Numerical and experimental validation of transient modeling for scramjet active cooling with supercritical endothermic fuel 4th International Energy Conversion Engineering Conference and Exhibit (IECEC) San Diego (USA) 26-29 june 2006 AIAA 2006-4028
[14] Gascoin N, Gillard P, Bernard S, Touré Y, Daniau E, Bouchez M Les méthodes de mesure COMPARER Internal technical document COMPARER Project September 2006 41 pages
[15] Schon J P, Comte-Bellot G and Charnay G Anémomètres à fil ou à film chaud Techniques de l'Ingénieur R2272
[16] Bonnier G and Devin E Couples thermoélectriques: Caractéristiques et mesure de température Techniques de l'Ingénieur R2590
[17] NIST National Institute of Standards and Technology Chemistry Webbook http://webbook.nist.gov/chemistry/ acceded in March, the third 2007
[18] Jones 2000 Langmuir Bulletin de l'Union des Physiciens 11/2000
[19] Bouchez M 2003 Propulsion par statoréacteur Third Year ESEM courses Energetic and Thermal Science speciality Orléans
[20] Fan X, Yu G and Li J 2005 Flow rate and calibration of kerosene cracking for supersonic combustion AIAA 2005-3555
[21] Chapman J R 1993 Practical organic mass spectrometry 2nd Edition Wiley Interscience John Wiley &
Sons New York
[22] Grob R L 1995 Modern practice of gas chromatography Editions Wiley Interscience Third Edition
[23] Malvern Instruments 2007 Instruments for material characterisation http://www.malvern.co.uk acceded the 02/12/2009
[24] Minard J P et al., 2002, RAPIERE: An innovative industrial optical measurement system for scramjet flows (first phase project final status in 2002), 11th International Conference Space Planes and Hypersonic Systems and Technologies, 29/09 – 04/10 2002 Orléans FRANCE AIAA-2002-5156 [25] Rouessac A 1992 Analyse chimique : méthodes et techniques instrumentales modernes Masson [26] Hollas J M 1987 Modern spectroscopy J. Wiley & Sons
[27] Colthup P B, Daly L H and Wiberly S E 1990 Introduction to infrared and Raman spectroscopy Academic Press
[28] Gascoin N et al. 21/10/2004 Mesures et contrôle de paramètres pertinents pour la régulation d'un statoréacteur mixte refroidi Troisième Rencontre Capteurs Bourges
[29] M. Dalibart, L. Servant, « Spectroscopie dans l’infrarouge », Techniques de l’Ingénieur, P 2845.
[30] Bassilakis R, Carangelo R M and Wojtowicz M A, 2001, TG-FTIR analysis of biomass pyrolysis, Fuel 80 1765-86
[31] van de Voort F R, Sedman J, Cocciardi R and Juneau S An automated FTIR method for the routine quantitative determination of moisture in lubricants: An alternative to Karl Fischer titration Talanta doi:10.1016/j.talanta.2006.10.042
[32] G. M. Arrigone, M. Hilton, « Theory and practice in using Fourier transform infrared spectroscopy to detect hydrocarbons in emissions from gas turbine engines », Fuel 84 (2005) 1052-1058
[33] A. Al-Alawi et al., « Automated FTIR analysis of free fatty acids or moisture in edible oils », JALA doi : 10.1016/j.jala.2005.11.002
[34] Rothman L S et al. 1998 The hitran molecular spectroscopic database and hawks (hitran atmospheric workstation): 1996 Edition J. Quant. Spectrosc. Radiat. Transfer Vol. 60 No. 5 665-710
[35] Rothman L S The HITRAN database Harvard-Smithsonian Center for Astrophysics http://cfa- www.harvard.edu/HITRAN/ accessed the 02/12/2009.
[36] Umber, J Spectroscopie infra rouge, Organic mineral and structural chemistry courses, Académie de Nancy-Metz http://www.ac-nancy-metz.fr/enseign/physique/chim/Jumber/Default.htm accessed the 02/12/2009
[37] Malow M, Schulze A and Krause U, 2006, The main gaseous products and the mass loss during the self-ignition of combustible materials, Proceedings of Sixth ISHPMIE Vol. III Dalhousie University Halifax NS Canada Aug 27-Sept.1 825-36
[38] N. Gascoin, P. Gillard, S. Bernard, E. Daniau, M. Bouchez, "Pyrolysis of Supercritical Endothermic Fuel: Evaluation for Active Cooling Instrumentation.", International Journal of Chemical Reactor Engineering, Vol. 6, Article A7, Ed. The Berkeley Electronic Press, 2008.
1.E+05 1.E+06 1.E+07 1.E+08 1.E+09 1.E+10 1.E+11 1.E+12 1.E+13 1.E+14 1.E+15
1000 3000 5000 7000 9000 11000 13000 Time (s)
Pressure Losses/Mass flow rate (Pa.s/kg)
300 350 400 450 500 550 600 650 700 750 800
Temperature (K)
Figure 1. Non constant ratio of pressure losses on mass flow rate during n-heptane pyrolysis.
1 10 100 1000
300 500 700 900 1100 1300 1500 1700
Temperature, K
Density, kg.m-3
Case 1 Case 2 Case 3 Case 4
Case 5 Case 6 Case 7 Case 8
a)
1 1,02 1,04 1,06 1,08 1,1 1,12 1,14
300 500 700 900 1100 1300 1500 1700
Temperature, K
Isentropic coefficientv
Case 1 Case 2 Case 3 Case 4 Case 5 Case 6 Case 7 Case 8
b)
Figure 2. a) Density and b) Isentropic coefficient as a function of temperature for a large variety of test cases.
1400 1600 1800 2000 2200 2400 2600
1,E-06 1,E-05 1,E-04 1,E-03 1,E-02 1,E-01 1,E+00 Time, s
Temperature of tungsten wire, K
1e-5 m 1e-3 m 1e-6 m
Figure 3. Transient temperature of tungsten wire immersed in a hot fluid according to its diameter.
0 2 4 6 8 10 12 14 16 18
300 500 700 900 1100 1300 1500 1700 Fluid Temperature, K
q/A*, g.mm-2 .s-1
Case 1 Case 2 Case 3 Case 4 Case 5 Case 6 Case 7 Case 8
Fan et al. AIAA 2005-3555
Figure 4. Numerical mass flow rate computation for different test cases (3.5 MPa).
y = 7,111Ln(x) + 920,773 R2 = 0,996 y = 7,751Ln(x) + 924,011
R2 = 0,974
895 900 905 910 915 920 925 930
0% 10% 20% 30% 40% 50% 60% 70% 80% 90% 100%
Molar Fraction
Luminance spectral line, cm-1
1200 K 1500 K
Figure 5. Relationship between the ethane concentration (in mixtures with methane and acetylene) and the exact wavelength position of the first main vibration mode.
8,6E-04 8,7E-04 8,8E-04 8,9E-04 9,0E-04 9,1E-04
0% 10% 20% 30% 40% 50% 60% 70% 80% 90% 100%
Molar Fraction Luminance, W.m-2 .sr-1
9,0E-04 1,1E-03 1,3E-03 1,5E-03 1,7E-03 1,9E-03 2,1E-03
Luminance, W.m-2 .sr-1 1200 K 1500 K
Figure 6. Relationship between the ethane concentration and the luminance of a vibration mode around 3140 cm-1 (in mixtures with methane and acetylene).
0%
5%
10%
15%
20%
25%
30%
0 2000 4000 6000 8000 10000 12000 14000 16000 18000 20000 Time (s)
Molar Fraction in Gas Phase
C3H8_FTIR C3H8_RESPIRE
a)
0%
2%
4%
6%
8%
10%
12%
14%
9000 9500 10000 10500 11000 Time (s)
Molar Fraction in Gas Phase C3H8_FTIR
C3H8_RESPIRE
b)
0%
2%
4%
6%
8%
10%
12500 13000 13500 14000 14500 Time (s)
Molar Fraction in Gas Phase C3H8_FTIR
C3H8_RESPIRE
c) Figure 7. Transient numerical computation and non-intrusive experimental measure of C3H8
formation at the process outlet (a) with time delay at average gazeification rate (b) and high gazeification rate (c).
Table 1. Conditions of the numerical test cases.
Cooling Channel Number
of test
case Length (m)
Width
(m) pin fins
Maximum fluid temperature reached in the reactor (K)
Mass flow rate (g.s-1)
1 2.2 0.212 With 1580 65
2 2.2 0.212 With 1590 60
3 0.6 0.008 With 1160 0.1
4 1.2 0.008 With 1560 0.1
5 0.9 0.04 With 1020 1
6 1.1 0.212 With 1220 65
7 1.2 0.002 Without 1520 0.2
8 1.2 0.002 Without 995 0.05
Table 2. Parameters of spectra computations with the HITRAN software.
Species under study
Concentration in binary and ternary
mixtures
Sample thickness (m)
Temperature (K)
Pressure (MPa) CH4
C2H2 C2H6
0 % - 33% - 50%
66% - 100 %
0.01 0.05 1
900 1200 1500
3.5 7.0