HAL Id: hal-01176246
https://hal.sorbonne-universite.fr/hal-01176246
Submitted on 15 Jul 2015
HAL is a multi-disciplinary open access archive for the deposit and dissemination of sci- entific research documents, whether they are pub-
L’archive ouverte pluridisciplinaire HAL, est destinée au dépôt et à la diffusion de documents scientifiques de niveau recherche, publiés ou non,
Contribution of Surface Distributions to
Constant-Phase-Element (CPE) Behavior: 1. Influence of Roughness
Christopher L. Alexander, Bernard Tribollet, Mark E. Orazem
To cite this version:
Christopher L. Alexander, Bernard Tribollet, Mark E. Orazem. Contribution of Surface Distribu- tions to Constant-Phase-Element (CPE) Behavior: 1. Influence of Roughness. Electrochimica Acta, Elsevier, 2015, pp.416-424. �10.1016/j.electacta.2015.05.010�. �hal-01176246�
Contribution of Surface Distributions to
Constant-Phase-Element (CPE) Behavior: 1. Influence of Roughness
IChristopher L. Alexandera, Bernard Tribolletb, Mark E. Orazema,∗
aDepartment of Chemical Engineering, University of Florida, Gainesville, FL, 32611, USA
bLISE, UPR 15 du CNRS, Universit´e P. et M. Curie, CP 133, 4 Place Jussieu, 75252 Paris cedex 05 France
Abstract
Finite–element simulations were used to calculate the influence of surface roughness of V-shaped grooves on the impedance of ideally polarized disk electrodes. The characteristic length associated with roughness was found to depend on the width or period of the roughness as well as the roughness fac- tor. The characteristic dimension associated with a rough disk was shown to be the disk radius multiplied by the roughness factor. This work shows that for small roughness factors, while roughness causes frequency dispersion, the frequency dispersion is seen only at frequencies that are much higher than those associated with the disk geometry. Thus, a constant–phase element associated with a surface distribution of time constants cannot be attributed to surface roughness.
Keywords: Frequency Dispersion, capacitance, impedance spectroscopy
Ipublished inElectrochimica Acta, 173 (2015), 416-424.
∗Corresponding author
Email address: meo@che.ufl.edu(Mark E. Orazem)
1. Introduction
Electrical circuits invoking constant–phase elements (CPE) are often used to fit impedance data arising from a broad range of experimental sys- tems. The impedance for a blocking electrode showing CPE behavior may be expressed in terms of ohmic resistanceRe and CPE parametersαand Q as
Z =Re+ 1
(jω)αQ (1)
whereω is the angular frequency in units of s−1. When α = 1, the system is described by a single time–constant, and the parameter Q has units of capacitance; otherwise,Qhas units of sα/Ωcm2 or F/s(1−α)cm2 [1].
While CPEs are commonly used to improve the fit to experimental impedance spectra, the explanation for their origin has been largely con- jectural. Recently, Jorcin et al. [2] have proposed that the CPE could have, as an origin, a distribution of time constants through a film or along an elec- trode surface. They supported their hypothesis with local impedance mea- surements. An interpretation for CPE behavior caused by a normal distribu- tion was developed in the form of a power–law distribution of resistivity.[3, 4]
The power–law model approach has been used successfully to extract a film capacitance and associated parameters for a variety of systems, including oxides on steel,[5] human skin,[5, 6] and polymer coatings.[7] [8]
Brug et al. [9] developed an expression for the capacitance extracted from a CPE caused by a surface distribution of capacitance or charge trans- fer resistance. The Brug model was shown to apply for the apparent CPE behavior associated with geometry-induced nonuniform current and poten- tial distributions on a disk electrode.[10, 11] As the geometry-induced CPE behavior appears only at high frequency,[12] the disk geometry cannot pro- vide an explanation for CPE behavior caused by surface distributions that may extend over many decades of frequency.
Several other potential causes for surface CPE behavior have been pro- posed, including porous electrodes,[13, 14, 15] specific adsorption,[16] surface roughness,[17, 18] and even heterogeneity on an atomic scale.[19] Since 1950, electrode roughness emerged as a leading explanation for CPE behavior.
In early experiments on solid electrodes, micro–scale surface roughness was believed to contribute to the non–ideality of electrochemical measure- ments. [13] Borisova and Ershler were the first to observe that roughness influenced electrochemical measurements.[20] They found that the extent of frequency dispersion was reduced by melting a metal electrode and letting
it cool to form into a droplet, suggesting that the smoother surface led to a more ideal response.
Following the development of fractal theory,[21] there was an attempt to correlate the fractal dimensions of the surface to the CPE exponentα.[22, 23]
Fractal geometry was shown to cause frequency dispersion, however a corre- lation between the fractal dimension and variance from ideality could not be found. Pajkossy showed experimentally that annealing can reduce the degree of frequency dispersion, even though the roughness of the surface remained the same, and thereby concluded that the frequency dispersion cannot be due to the geometric effect solely but may also have a contribution of atomic–
scale heterogeneities, distinguishing between the effects of a distribution of solution resistance and a distribution of surface properties.[17, 24, 25] Em- manuel used an analytic–continuation method to calculate the impedance of a 2D Hull cell and simulated the effect of a linear distribution of solution re- sistance assuming a uniform capacitance.[26] The results of his work showed that frequency dispersion occurred at high frequencies while the calculations yielded ideal behavior at low frequencies.
Thus, while roughness was initially considered to cause CPE behavior, recent work has questioned this premise. The objective of this work is to explore, by use of finite–element models, whether surface roughness could provide a valid physical explanation for CPE behavior associated with a sur- face distribution of time constants. An essential question in this analysis is whether electrochemical impedance spectroscopy measurements encompass the frequency at which roughness is expected to influence the impedance response.
2. Mathematical Development
The potential distribution within an electrolyte with uniform composi- tion is governed by Laplace’s equation,
∇2Φ = 0. (2)
For the present work, axisymmetric cylindrical coordinates were used in which the potential was assumed to be independent of the angular coordi- nate.
The potential was separated into steady-state and oscillating components as
Φ = ¯Φ + Ren
Φexp(jωt)˜ o
(3)
where ¯Φ represents the steady-state portion and ˜Φ represents the complex oscillating portion that is a function of frequency and position but indepen- dent of time. The same relationship for the potential applied to the electrode can be expressed as
V = ¯V + Ren
V˜exp(jωt)o
(4) For a capacitive system, the steady state potential is equal to zero; thus, only the oscillating component was calculated. Atr= 0, for ally, the symmetry condition ∂Φ/∂y˜ = 0 applied. Far from the electrode, as p
r2+y2 → ∞, Φ˜ → 0. This condition places the counterelectrode infinitely far from the working electrode.
Following Newman [27] and Huang et al. [28], the electrode was assumed to be ideally polarized. The normal flux at the surface of the electrode was expressed as
i=C0∂(V −Φ0)
∂t = −κ∂Φ
∂y y=0
(5) whereC0 is the capacitance on the electrode surface, κ is the conductivity of the electrolyte, and Φ0 is the potential outside the diffuse part of the electrode double layer.
The oscillating current density was converted to the frequency domain such that
˜i= jωC0( ˜V −Φ)˜ (6)
where ˜V is the potential perturbation at the electrode and ˜Φ is the complex oscillating potential within the electrolyte.
Frequency or time-constant dispersion for blocking electrodes may occur in any electrochemical setup that does not provide a uniform current dis- tribution across the working electrode surface. The characteristic frequency at which time-constant dispersion is evident corresponds to an ohmic resis- tance greater than or equal to the interfacial impedance. A dimensionless frequency,K, may be defined to be the ratio of ohmic resistance and inter- facial impedance as
K =ωC0Re (7)
such that frequency dispersion is induced atK ≥1. In the case of a blocking disk electrode within an insulating plane, the ohmic resistance in units of Ωcm2 is given by[29]
Re= πr0
4κ (8)
The interfacial impedance can be expressed as Z = 1
(9)
such that the dimensionless frequency is K= π
4 ωC0r0
κ (10)
Huang et al.[12] defined the dimensionless frequency to be K∗ = ωC0r0
κ (11)
and indicated that time-constant dispersion should be seen atK∗≥1. The present development suggests that the characteristic frequency should be seen instead at K = 1 or K∗ = 4/π. The inclusion of the π/4 factor does not affect significantly the prediction of the characteristic frequency.
The roughness of the electrode was quantified in terms of the roughness factor or rugosity, fr, obtained by dividing the true polarizable area by the geometric area.[30] A smooth electrode has a roughness factor of unity;
whereas, roughness factors much greater than unity may be attributed to porous electrodes. For a uniformly rough surface with concentric V–shaped grooves, the roughness factor may be expressed as fr = 1/cosθ, where θ represents the contact angle between the rough surface and a smooth plane.
3. Impedance Calculations
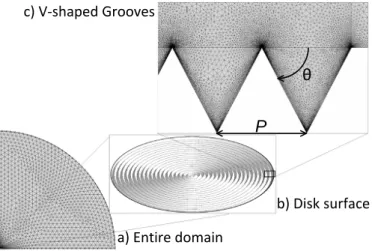
Three disk electrode configurations were simulated, including a com- pletely smooth electrode within an insulating plane, a rough electrode within an insulating plane, and a recessed rough electrode. The calculations were performed in axisymmetric cylindrical coordinates for a quarter of a circle domain, shown in Figure 1(a), which represents the electrolyte. The coun- terelectrode was located at p
r2+y2 = 500 cm, making the domain size at least 1000 times larger than the radius of the disk. A free triangular mesh was used with a greater density of elements near the working electrode. The grooved surface of the disk is shown in Figure 1(b), and an expanded view of the grooves is shown in Figure 1(c). The angleθused for the calculation of roughness factor is also shown in Figure 1(c).
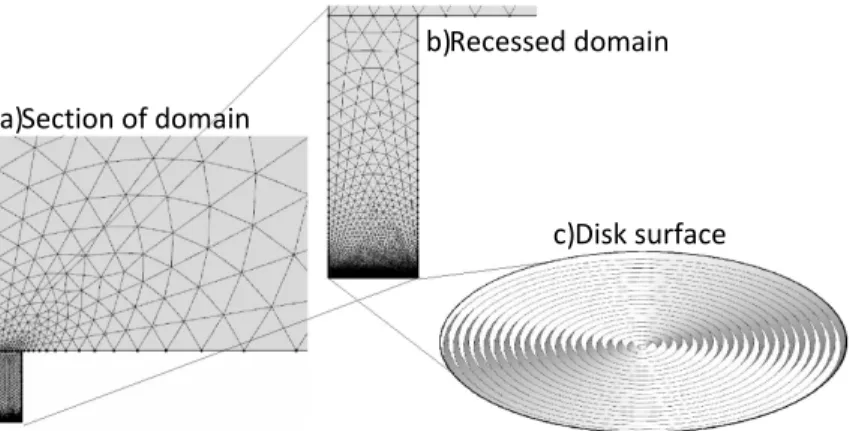
The electrode was placed in the y = 0 plane centered at r = 0 such that the angle between the electrode surface and the insulating plane was 180 degrees. The corresponding primary current distribution approaches infinity at the periphery of the disk. A recessed electrode was configured such that the insulating plane was perpendicular to the electrode surface as shown in Figure 2. The depth of the recess was three times the disk diameter, ensuring that the primary current distribution was uniform across
P θ
a) Entire domain
b) Disk surface c) V-shaped Grooves
Figure 1: Schematic representation showing the finite-element mesh used for the disk electrode simulations: a) entire domain; b) grooved surface of the electrode; c) detail of the grooved electrode.
a)Section of domain
b)Recessed domain
c)Disk surface
Figure 2: Schematic representation showing the finite-element mesh used for the recessed disk electrode simulations: a) portion of the domain emphasizing the recessed electrode;
b) the recessed electrode; and c) detail of the grooved electrode.
the electrode surface. A rough surface was simulated in both cases by adding concentric V–shaped grooves to the electrode surface, as is illustrated in magnified view in Figure 2(c). A rough recessed electrode was used to isolate the effect of the rough surface on the impedance; whereas, the rough electrode embedded within an insulating plane showed the coupled effect of the roughness and the nonuniform current distribution associated with the disk geometry.
4. Results and Discussion
The results of impedance simulations are presented to show the influence of surface roughness on electrodes embedded within an insulating plane.
Results from a recessed electrode are then used to distinguish between the effect of the roughness and the influence of disk geometry.
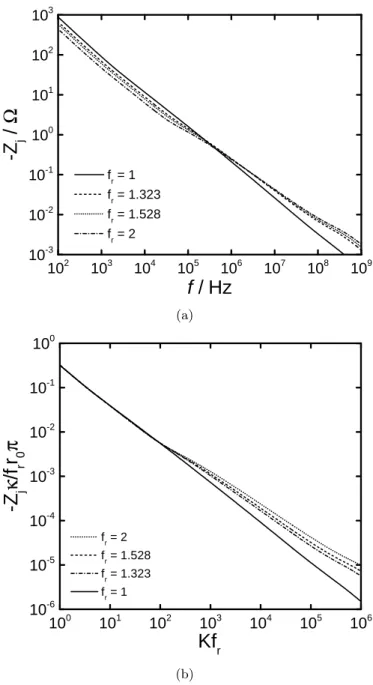
4.1. Influence of roughness on a disk electrode within an insulated plane The impedance of smooth and rough disk electrodes within an insulat- ing plane was simulated to show the coupled effect of surface roughness and nonuniform current distributions caused by disk geometry. The calculated imaginary part of the impedance is provided in Figure 3(a) as a function of frequency with the roughness factor as a parameter. The radius was 0.24 cm.
The simulated imaginary impedance for the rough electrodes at low frequen- cies was smaller than the impedance of the smooth electrode and decreased as the roughness factor was increased. The reduced impedance of the elec- trode could be attributed to the larger polarizable surface area. Conversely, the impedance of the rough electrode was larger than the impedance of the smooth electrode at high frequencies.
The imaginary part of the simulated global impedance, adjusted for the roughness of the electrode, is provided in Figure 3(b) as a function of dimen- sionless frequency. The dimensionless frequency for a rough–disk electrode can be expressed as
Kfr = πωC0frr0
4κ (12)
The impedance is expressed asZjκ/frr0π where the impedanceZj is scaled by unit area with units of Ω-cm2. The total surface area of a rough electrode isπfrr20. The use of the roughness factor in the scaling is confirmed by the superposition of the impedance at low frequencies where the current reaches all parts of the rough surface.
1 0 2 1 0 3 1 0 4 1 0 5 1 0 6 1 0 7 1 0 8 1 0 9 1 0 - 3
1 0 - 2 1 0 - 1 1 0 0 1 0 1 1 0 2 1 0 3
fr = 1 fr = 1 . 3 2 3 fr = 1 . 5 2 8 fr = 2
-Z
j/ Ω f / H z
(a)
1 0 0 1 0 1 1 0 2 1 0 3 1 0 4 1 0 5 1 0 6
1 0 - 6 1 0 - 5 1 0 - 4 1 0 - 3 1 0 - 2 1 0 - 1 1 0 0
fr = 2 fr = 1 . 5 2 8 fr = 1 . 3 2 3 fr = 1
-Z
jκ /f
rr
0π
K f
r(b)
Figure 3: Imaginary part of the calculated global impedance for a rough disk electrode with roughness factor as a parameter: a) dimensional impedance as a function of frequency; b) dimensionless impedance as a function of dimensionless frequencyKfr.
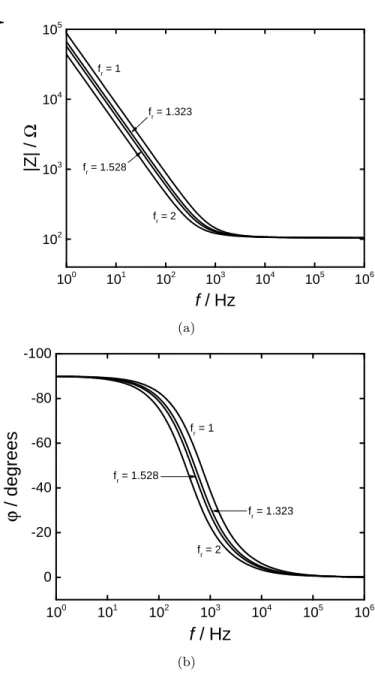
Bode phase plots are often used to represent impedance data. The phase was calculated from the real and imaginary parts of the impedance as
ϕ= arctanZj
Zr (13)
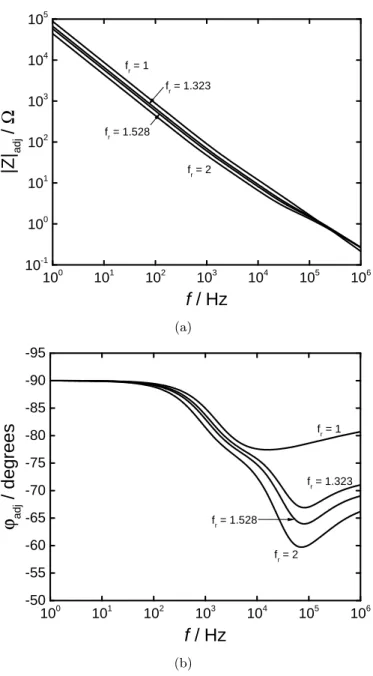
The magnitude and phase angle corresponding to the impedance presented in Figure 3 are expressed in Figure 4 as functions of frequency with the roughness factor as a parameter. The phase angle was zero at the high- frequency limit and -90◦ at the low–frequency limit. The inflection point corresponded to the characteristic frequency. One of the disadvantages of the Bode phase plot is that the contribution of the ohmic resistance may conceal important features. The ohmic-resistance-corrected modulus and phase angle,[31]
|Zadj|= q
(Zr−Re)2+Zj2 (14) and
ϕadj = arctan Zj
Zr−Re (15)
respectively, are shown in Figure 5. The ohmic–resistance–corrected phase angle, in particular, emphasizes the phase response of the electrode. The ohmic resistance used in equations 14 and 15 was obtained from the high- frequency limit of the calculated impedance. The adjusted–phase angle showed two deviations from an ideal capacitive response. However, the distinction between the two time constants was not clear.
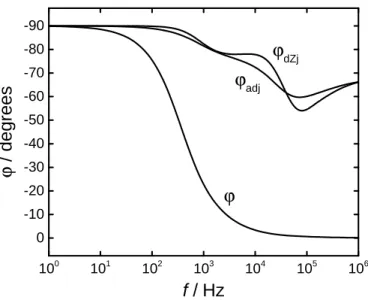
A clearer separation of features was obtained by use of an imaginary–
impedance–derived–phase angle, which is based only on the imaginary part of the impedance, i.e.,
ϕdZj =
dlog(Zj)
dlog(f) ×90◦ (16)
The derivative of the logarithm of the imaginary impedance with respect to the logarithm of the frequency, used previously to estimate the exponent for a constant-phase element,[31] is expressed here as a phase angle. A comparison between the imaginary–impedance–derived phase angle and the adjusted phase angle is presented in Figure 6 for a roughness factor of 2 and a roughness period of 40 µm. The imaginary–impedance –derived phase angle shows clearer delineation between the two deviations as compared to the ohmic–resistance–corrected phase angle.
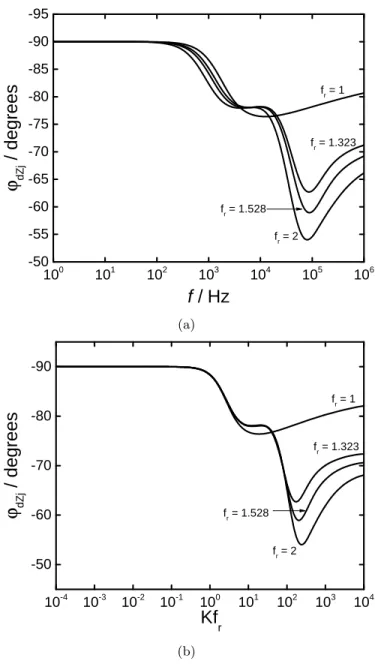
The imaginary–impedance–derived–phase angle is presented in Figure 7(a) as a function of frequency with the roughness factor as a parameter.
1 0 0 1 0 1 1 0 2 1 0 3 1 0 4 1 0 5 1 0 6 1 0 2
1 0 3 1 0 4 1 0 5
fr = 1
fr = 1 . 3 2 3
fr = 1 . 5 2 8
fr = 2
|Z|/ Ω f / H z
(a)
1 0 0 1 0 1 1 0 2 1 0 3 1 0 4 1 0 5 1 0 6
0
- 2 0 - 4 0 - 6 0 - 8 0 - 1 0 0
fr = 1
fr = 1 . 3 2 3 fr = 1 . 5 2 8
fr = 2
ϕ / degrees f / H z
(b)
Figure 4: Calculated global impedance as a function of frequency for a rough disk electrode with roughness factor as a parameter: a) magnitude; b) phase.
1 0 0 1 0 1 1 0 2 1 0 3 1 0 4 1 0 5 1 0 6 1 0 - 1
1 0 0 1 0 1 1 0 2 1 0 3 1 0 4 1 0 5
fr = 1
fr = 1 . 3 2 3
fr = 1 . 5 2 8
fr = 2
|Z| adj/ Ω f / H z
(a)
1 0 0 1 0 1 1 0 2 1 0 3 1 0 4 1 0 5 1 0 6
- 5 0 - 5 5 - 6 0 - 6 5 - 7 0 - 7 5 - 8 0 - 8 5 - 9 0 - 9 5
fr = 1
fr = 1 . 3 2 3
fr = 1 . 5 2 8
fr = 2
ϕ adj / degrees f / H z
(b)
Figure 5: Calculated global impedance as a function of frequency for a rough disk elec- trode with roughness factor as a parameter: a) ohmic–resistance–corrected magnitude; b) ohmic–resistance–corrected phase angle.
1 0 0 1 0 1 1 0 2 1 0 3 1 0 4 1 0 5 1 0 6
0
- 1 0 - 2 0 - 3 0 - 4 0 - 5 0 - 6 0 - 7 0 - 8 0 - 9 0
ϕ
ϕd Z j
ϕ / degrees f / H z
ϕa d j
Figure 6: Phase angles obtained from equations 21, 15, and 16 for the impedance presented in Figure 3 for a rough disk electrode as a function frequency. The roughness factor was fr= 2 and the roughness period wasP= 40µm.
The results for the smooth electrode showed non–ideal behavior at frequen- cies greater than 800 Hz due to the nonuniform current distribution caused by the electrode configuration [28]. For the rough electrodes, two distinct deviations from ideal behavior were observed. The lower-frequency devia- tion for a 0.24 cm radius electrode with a roughness factor of 2 occurred at frequencies equal to and greater than 300 Hz, which is 500 Hz less than that observed for the smooth electrode. The magnitude of the difference in frequency between the lower-frequency deviation of the rough electrode compared to the smooth electrode is proportional to the roughness factor.
The higher-frequency deviation occurred at roughly 20 kHz.
The characteristic frequency at which the current and potential distribu- tions on a smooth disk electrode within an insulating plane begin to influence the impedance response may be expressed as [12]
fc = κ 2πC0r0
4 π
(17) For a rough electrode, the radius must be modified to include the effect of surface roughness. Therefore, the characteristic frequency at which a rough disk electrode influences the impedance response is expressed as
fc = κ 4
(18)
1 0 0 1 0 1 1 0 2 1 0 3 1 0 4 1 0 5 1 0 6 - 5 0
- 5 5 - 6 0 - 6 5 - 7 0 - 7 5 - 8 0 - 8 5 - 9 0 - 9 5
fr = 1
fr = 1 . 3 2 3
fr = 1 . 5 2 8 fr = 2
ϕ dZj / degrees f / H z
(a)
1 0 - 4 1 0 - 3 1 0 - 2 1 0 - 1 1 0 0 1 0 1 1 0 2 1 0 3 1 0 4
- 5 0 - 6 0 - 7 0 - 8 0 - 9 0
fr = 1 . 3 2 3
fr = 1 . 5 2 8
fr = 2
fr = 1
ϕ dZj / degrees
K fr
(b)
Figure 7: Imaginary–impedance–derived–phase angle calculated from the impedance pre- sented in Figure 3 for a rough disk electrode: a) Imaginary–impedance–derived–phase angle as a function of frequency; b) Imaginary–impedance–derived–phase angle as a func- tion of dimensionless frequencyKfr.
1 0/ 2 P P
2 0/ 4
P P
P0
electrode
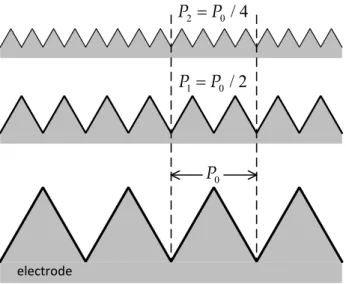
Figure 8: Schematic representation showing the manner in which the roughness period was varied for a fixed roughness factor equal to 2. The three configurations have the same surface area.
which is slightly smaller than the characteristic frequency associated with the influence of the nonuniform current distributions. Equation (18) ac- counts for the coupled effect of surface roughness and disk electrode ge- ometry. The dimensionless results, presented in Figure 7(b) in which the characteristic length included the roughness factor, showed that the initial deviation could be attributed to the coupled effect of disk geometry and surface roughness as it occurred at Kfr = 1. The magnitude of the higher–
frequency deviation increased as the roughness factor increased, but the characteristic frequency was not altered. This provides indication that the higher–frequency deviation may also be dependent on the roughness factor.
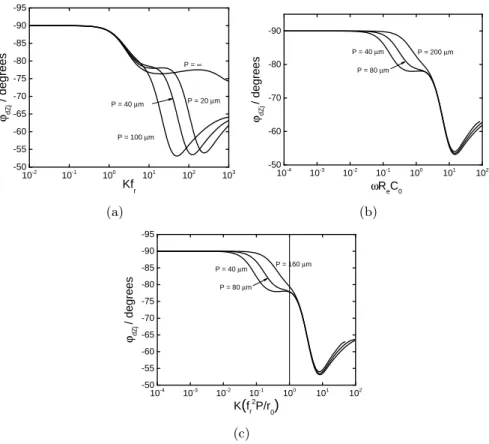
A series of simulations were performed in which the depth and period of the roughness was increased such that the roughness factor was fixed at 2, as illustrated in Figure 8. The imaginary–impedance–derived–phase angle cor- responding to the impedance response on electrodes with various roughness periods is presented in Figure 9(a) in which the dimensionless frequency was modified by the roughness factor. The results show that as the roughness depth increased, the characteristic frequency of the roughness decreased, but the magnitude of the deviation from ideality remained consistent. Also, the portion of the plot that is superimposed is the low–frequency deviation representative of the coupled effect of the nonuniform current distribution
1 0- 2 1 0- 1 1 00 1 01 1 02 1 03 - 5 0
- 5 5 - 6 0 - 6 5 - 7 0 - 7 5 - 8 0 - 8 5 - 9 0 - 9 5
P = 4 0 µm P = 2 0 µm
P = 1 0 0 µm
P = ∞
ϕdZj / degrees
K fr
(a)
1 0- 4 1 0- 3 1 0- 2 1 0- 1 1 00 1 01 1 02
- 5 0 - 6 0 - 7 0 - 8 0 - 9 0
P = 8 0 µm
P = 4 0 µm P = 2 0 0 µm
ϕdZj / degrees
ωR eC 0
(b)
1 0- 4 1 0- 3 1 0- 2 1 0- 1 1 00 1 01 1 02
- 5 0 - 5 5 - 6 0 - 6 5 - 7 0 - 7 5 - 8 0 - 8 5 - 9 0 - 9 5
P = 8 0 µm
P = 4 0 µm P = 1 6 0 µm
ϕdZj / degrees K (fr2
P / r
0) (c)
Figure 9: The imaginary–impedance–derived–phase angle calculated from impedance sim- ulations of a rough disk electrode within an insulating plane with the roughness period as a parameter and the roughness factor held constant: a) Phase angle as a function of fre- quency modified by the roughness factor; b) Phase angle as a function ofωReC0in which the ohmic resistance was calculated from recessed electrode simulations (see equation 19);
c) Phase angle as a function of dimensionless frequency derived from the approximated ohmic resistance.
due to the disk geometry and the surface roughness.
The ohmic resistance associated with the rough grooves may be deter- mined from the frequency at which dispersion occurs which can be obtained from recessed electrode simulations as
Re= 1 2πfcC0
(19) The results of Figure 9(a) are provided in Figure 9(b) as a function of the dimensionless frequency, Equation 7. In this case, the superposition oc- curred at the higher frequency deviation, indicating that the ohmic resis- tance obtained from recessed electrode simulations is also applicable to disk electrodes within an insulating plane.
The ohmic resistance of the grooves is dependent on the shape of the grooves and therefore can only apply to a particular geometry. An approxi- mation of the ohmic resistance of the rough grooves that is general enough to be independent of geometry was observed to be a function of the roughness factor and the width or period of the grooves expressed as
Re≈ fr2P
κ (20)
The corresponding dimensionless frequency may be expressed as Kfr2P/r0= ωC0fr2P
κ (21)
The imaginary—impedance—derived phase angle is shown in Figure 9(c) as a function of the dimensionless frequency corresponding to the approxi- mated ohmic resistance. The approximation of the ohmic resistance showed the same superposition of the higher frequency deviation as did the results in Figure 9(b) in which the true ohmic resistance was used. Similar superpo- sition was observed for simulations of grooves separated by smooth surfaces and for rectangular indentations. The results suggest that the characteristic dimension associated with the roughness is on the order offr2P.
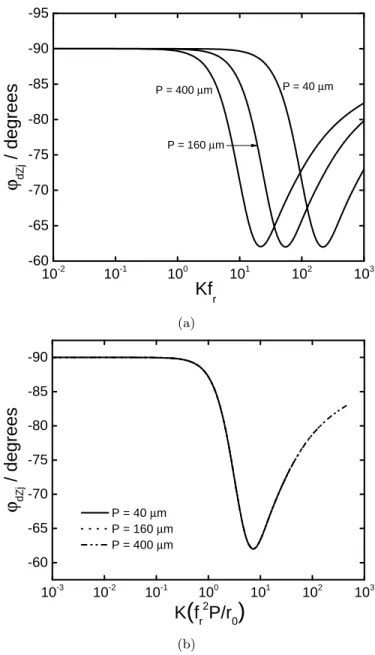
4.2. Influence of Surface Roughness on a Recessed Electrode
Simulations were performed on a rough recessed electrode to isolate the effect of the surface roughness from that of the disk geometry. The imaginary–impedance–derived phase angle, presented in Figure 10(a) as a function of dimensionless frequency with the roughness period as a param- eter, shows that the frequencies at which deviation from an ideal response
1 0 - 2 1 0 - 1 1 0 0 1 0 1 1 0 2 1 0 3 - 6 0
- 6 5 - 7 0 - 7 5 - 8 0 - 8 5 - 9 0 - 9 5
P = 1 6 0 µm
P = 4 0 0 µm P = 4 0 µm
ϕ dZj / degrees
K fr
(a)
1 0 - 3 1 0 - 2 1 0 - 1 1 0 0 1 0 1 1 0 2 1 0 3
- 6 0 - 6 5 - 7 0 - 7 5 - 8 0 - 8 5 - 9 0
P = 4 0 µm P = 1 6 0 µm P = 4 0 0 µm
ϕ dZj / degrees K
(
fr2P / r 0
)
(b)
Figure 10: Imaginary–impedance–derived–phase angle calculated from the simulated impedance of a rough recessed electrode with the roughness period as a parameter: a) as a function of dimensionless frequencyKfr; and b) as a function of dimensionless fre- quencyKfr2P/r0.
occurred decreased as the depth of the roughness increased. The length scale used to make the frequency dimensionless was the product of the roughness factor and the radius of the disk.
The imaginary–impedance–derived–phase angle is presented in Figure 10(b) as a function of the dimensionless frequency that is based on the a characteristic dimensionfr2P. The results for three different roughness peri- ods, seen in Figure 10(a), superpose when plotted as a function ofKfr2P/r0. The product of the roughness factor and the geometric disk radius is the characteristic dimension for a rough disk; whereas the radius of the disk is the characteristic length for a smooth electrode. The period of the rough- ness multiplied by the square of the roughness factor is the appropriate characteristic length associated with the roughness itself.
The deviation from an ideal response of a rough recessed electrode at high frequency may be explained by the nonuniform current and potential distribution along the electrode surface presented in Figure 11. The results for K=10−5 are presented in Figure 11(a) and the results at K=103 are pre- sented in Figure 11(b). The streamlines represent the current distribution and the potential distribution is shown as a false color gradient. At low frequencies, the potential varied uniformly with the depth of the roughness such that the current lines were parallel to the y–axis. The potential distri- bution at high frequencies followed the surface profile and the current did not reach the deepest parts of the rough surface. The change in current distribution with frequency caused the observed frequency dispersion.
The local current density at a peak and a trough of one of the the grooves of the electrode surface is presented in Figure 12 as a function of frequency for a recessed electrode. The current was very small at low frequencies, as expected for a blocking electrode, and increased with frequency in the same manner for both the peak and trough. At high frequencies, the current at the peak increased sharply; whereas, the current at the trough dropped to zero.
The frequency at which the current at the peak and the trough diverged corresponded to the frequency at which the surface roughness influenced the impedance.
The effective capacitance of the electrode/electrolyte interface may be determined from the imaginary part of the impedance as
Ceff =
−1 ωZj
(22) The ratio of the effective capacitance and the input capacitance is provided in Figure 13 for the recessed electrode as a function of dimensionless fre-
Peak
Trough
(a)
(b)
Figure 11: The current paths obtained as Re{˜iexp(jwt)}at a fixed time,t: a) atK= 10−5; b) atK = 103. The potential distribution within the electrolyte adjacent to the rough surface is shown by the false–color representation.
1 0 - 2 1 0 - 1 1 0 0 1 0 1 1 0 2 1 0 3 1 0 4 1 0 5 - 0 . 0 2
0 . 0 0 0 . 0 2 0 . 0 4 0 . 0 6 0 . 0 8 0 . 1 0 0 . 1 2
iP e a k- iT r o u g h
iT r o u g h
iP e a k
i / mA/cm2
f / H z
Figure 12: Calculated current density at a peak and trough for a recessed electrode as a function of frequency.
1 0 - 5 1 0 - 3 1 0 - 1 1 0 1 1 0 3 1 0 5 1 0 7
0 . 4 0 . 6 0 . 8 1 . 0 1 . 2 1 . 4 1 . 6 1 . 8 2 . 0 2 . 2
fr = 1 fr = 1 . 3 2 3 fr = 1 . 5 2 8 fr = 2
C
eff/C
0K f
rFigure 13: The ratio of the calculated effective capacitance and the input capacitance as a function of dimensionless frequencyKfr with the roughness factor as a parameter for recessed disk electrodes.
1 0 0 1 0 1 1 0 2 1 0 3 1 0 4 1 0 5 1 0 0
1 0 1 1 0 2 1 0 3 1 0 4 1 0 5 1 0 6 1 0 7
fr = 5 r0 = 0 . 5 c m
κ/ C 0= 1 0 2 c m / s κ/ C 0= 1 0 3 c m / s
f c/ Hz f r2 P o r frr 0 / µm
κ/ C 0= 1 0 4 c m / s
fr = 5 , P = 4 µm
Figure 14: The characteristic frequencies, fc, associated with dimensionless frequencies K(fr2P/r0) = 1 orK(fr) = 1 at which the surface roughness influences the impedance as a function of either the roughness depth or the product of roughness factor and electrode radius withκ/C0as a parameter.
all parts of the rough electrode at low frequencies, making the capacitance ratio equal to the roughness factor. At high frequencies, the penetration depth of the current was smaller than the depth of the roughness, and the capacitance ratio decreased due to the nonuniform current distribution as- sociated with the combined effects of the disk geometry and the surface roughness. The effective capacitance of the smooth disk,fr = 1, was equal to the input capacitance,C0, for all of the frequencies simulated.
An inherent difficulty in determining the characteristic frequency associ- ated with roughness is that the shape of the roughness greatly influences the ohmic resistance[17]. Nevertheless, according to the geometry-independent ohmic resistance expressed in Equation 25, the characteristic frequency at which roughness begins to influence the impedance may be roughly esti- mated as
fc = κ
2πC0fr2P (23)
which may be compared to the characteristic frequency developed for a rough disk geometry in equation 18.
The frequency at which time–constant dispersion was observed is pre- sented in Figure 14 as a function of fr2P for three different ratios of elec-
trolyte conductivity and interfacial capacitance. The characteristic length frr0 associated with a disk within an insulating plane is also provided. The 104 cm/s conductivity to capacitance ratio may be obtained for a capaci- tanceC0 = 1 µF/cm2, representative of an oxide layer, and conductivityκ
= 0.01 S/cm, representing a 0.1 M NaCl solution. The value κ/C0 = 103 cm/s may correspond to a capacitanceC0 = 10 µF/cm2 representative of a double layer on an inert metal, and a conductivity, κ = 0.01 S/cm, again indicative of a 0.1 M NaCl solution.
For an inert rough disk electrode with a roughness factor of 5 and an average width or period of roughness equal to 4 µm (approximately half of the average particle size of No. 1000 grit paper), frequency dispersion due to roughness will initiate at a frequency of 16 kHz for κ/C0 = 103. If the electrode radius is 0.5 cm, frequency dispersion due to the disk geometry within an insulating plane will occur at 65 Hz, which is much lower than the frequency at which the effect of surface roughness is observed.
The results presented here demonstrate that surface roughness on solid electrodes influences the impedance response when coupled with the effect of nonuniform current distributions due to disk electrode geometry. For small roughness factors, roughness by itself causes frequency dispersion only at frequencies greater than that due to the geometry of disk electrodes.
However, since the roughness factor is a parameter contained within the characteristic dimension of the disk geometry and the surface roughness, there will exist cases in which the roughness of the disk will cause frequency dispersion at frequencies lower than the effect of the disk geometry. Porous electrodes provide an example in which the roughness factor can be on the order of 1000 and the effect of disk geometry would not be seen. Specifi- cally, whenfrP is greater thanr0, frequency dispersion due to the surface roughness will control.
Comparisons are provided in Figure 15 for the imaginary–impedance–
derived–phase angle associated with a smooth disk electrode, a rough disk electrode within an insulating plane with fr = 2 and P = 40 µm, and a rough recessed disk electrode withfr= 2 andP = 40µm. The geometry of the smooth disk electrode within an insulated plane caused deviation from ideal behavior at Kfr = 1 due to the nonuniform current distribution. The line representing the rough, recessed electrode showed frequency dispersion at Kfr = 20, which is numerically equal to Kfr2P/r0=1. The rough electrode within the insulating plane showed the effect of both the disk geometry and the roughness. The roughness effect occurred at Kfr = 20 and the disk geometry effect was observed at Kfr = K = 1.
1 0 - 2 1 0 - 1 1 0 0 1 0 1 1 0 2 1 0 3 - 5 0
- 5 5 - 6 0 - 6 5 - 7 0 - 7 5 - 8 0 - 8 5 - 9 0 - 9 5
R o u g h R e c e s s e d D i s k fr= 2 P = 4 0 µm R o u g h D i s k fr= 2 P = 4 0 µm
S m o o t h D i s k
ϕ dZj / degrees
K fr
Figure 15: The imaginary–impedance–derived–phase angles calculated from impedance simulations of a rough recessed electrode (fr= 2 andP= 40µm), a rough disk electrode within an insulating plane (fr= 2 andP = 40µm), and a smooth disk electrode within an insulating plane.
as the ohmic resistance associated with the roughness, other geometries were modeled to ensure the use of the approximated ohmic resistance. Rectan- gular grooves as well as separated V-shaped grooves were simulated. The spacing between the grooves can be accommodated by replacing fr2 with frfp where fp is the surface area of the groove divided by the area of the groove mouth. Therefore, the ohmic resistance is approximated by
Re ≈ frfpP
κ (24)
and the characteristic frequency at which the roughness will begin to influ- ence the impedance is
fc=κ/2πC0frfpP (25) Thus, the development presented here is general and can be applied to dif- ferent shapes of roughness.
5. Conclusions
The role of surface roughness on solid electrodes was studied using nu- merical finite element simulations under the assumption of a uniform ca- pacitance. Cell geometries including a rough recessed disk electrode and
smooth and rough disk electrodes within an insulating plane were used to assess the effect of surface roughness and the coupled effect of roughness and disk geometry.
The electrode configuration in which a disk electrode is placed within an insulating plane gives rise to a nonuniform–radial current distribution at frequencies greater than dimensionless frequencyK= 1 which results in fre- quency dispersion. If the surface of the electrode is not completely smooth, the geometry of the surface profile also induces current distributions. The results showed that for a uniformly defined rough surface, two distinct de- viations from ideality occurred. The low–frequency deviation is indicative of the coupled effect of surface roughness and the disk geometry, and the high–frequency deviation represents the influence of the surface roughness.
The frequency at which the coupled effect of the roughness and the ge- ometry of the disk affects the impedance is slightly lower than that of a completely smooth electrode due to the larger surface area of the rough disk. The characteristic length associated with this effect was found to be frr0 where fr is the roughness factor and r0 is the geometric or observ- able radius of the disk. The characteristic frequency at which frequency dispersion is caused by the geometry of a rough disk can be expressed as fc = 2κ/π2C0frr0.
The characteristic frequency for general surface roughness is not as easily defined as it depends on the shape and size of the roughness. A geometry–
independent approximation of the ohmic resistance was defined as fr2P/κ.
This expression was used to estimate the characteristic frequency at which the roughness will begin to influence the impedance as fc = κ/2πC0fr2P. The analysis showed that, for micron-scale roughness periods and roughness factors less than 5, the roughness–induced frequency dispersion occurs at a frequency higher than that associated with the disk geometry. Roughness factors less than 5 with the period of the roughness on the order of 4µm, however, will not cause distortions in the impedance measured at frequen- cies below 10 kHz unless the the conductivity of the solution is extremely small. Thus, constant–phase–element behavior at low frequencies cannot be attributed to surface roughness. This analysis suggests that, as frequency dispersion is strongly governed by the period of roughness, micron-scale and smaller heterogeneities of different types are unlikely to provide an explana- tion for constant–phase impedance responses.
Roughness, however, does influence the value of parameters extracted from the low–frequency part of an impedance measurement. The effective capacitance, for example, isCeff =frC0whereC0is the surface capacitance.
6. Acknowledgements
M. Orazem acknowledges partial support from the University of Florida Research Foundation Professorship.
[1] M. E. Orazem, B. Tribollet, Electrochemical Impedance Spectroscopy, John Wiley & Sons, Hoboken, NJ, 2008.
[2] J.-B. Jorcin, M. E. Orazem, N. P´eb`ere, B. Tribollet, CPE analysis by local electrochemical impedance spectroscopy, Electrochimica Acta 51 (2006) 1473–1479.
[3] B. Hirschorn, M. E. Orazem, B. Tribollet, V. Vivier, I. Frateur, M. Mu- siani, Constant-phase-element behavior caused by resistivity distribu- tions in films: 1. theory, Journal of The Electrochemical Society 157 (2010) C452–C457.
[4] B. Hirschorn, M. E. Orazem, B. Tribollet, V. Vivier, I. Frateur, M. Mu- siani, Constant-phase-element behavior caused by resistivity distribu- tions in films: 2. applications, Journal of The Electrochemical Society 157 (2010) C458–C463.
[5] M. E. Orazem, B. Tribollet, V. Vivier, S. Marcelin, N. P´eb`ere, A. L.
Bunge, E. A. White, D. P. Riemer, I. Frateur, M. Musiani, Inter- pretation of dielectric properties for materials showing constant-phase- element (CPE) impedance response, Journal of The Electrochemical Society 160 (2013) C215–C225.
[6] E. A. White, M. E. Orazem, A. L. Bunge, Characterization of dam- aged skin by impedance spectroscopy: Chemical damage by dimethyl sulfoxide, Pharmaceutical Research 30 (2013) 2607–2624.
[7] M. Musiani, M. Orazem, N. Pbre, B. Tribollet, V. Vivier, Determi- nation of resistivity profiles in anti-corrosion coatings from constant- phase-element parameters, Progress in Organic Coatings 77 (2014) 2076–2083.
[8] A. S. Nguyen, M. Musiani, M. E. Orazem, N. Pbre, B. Tribollet, V. Vivier, Impedance analysis of the distributed resistivity of coat- ings in dry and wet conditions, Electrochimica Acta (2015) In Press.
[9] G. J. Brug, A. L. G. van den Eeden, M. Sluyters-Rehbach, J. H.
Sluyters, The analysis of electrode impedances complicated by the pres- ence of a constant phase element, Journal of Electroanalytical Chem- istry 176 (1984) 275–295.
[10] V. M. W. Huang, V. Vivier, M. E. Orazem, N. P´eb`ere, B. Tribollet, The apparent CPE behavior of a disk electrode with faradaic reactions, Journal of The Electrochemical Society 154 (2007) C99–C107.
[11] B. Hirschorn, M. E. Orazem, B. Tribollet, V. Vivier, I. Frateur, M. Mu- siani, Determination of effective capacitance and film thickness from cpe parameters, Electrochimica Acta 55 (2010) 6218–6227.
[12] V. M. W. Huang, V. Vivier, M. E. Orazem, N. P´eb`ere, B. Tribollet, The apparent CPE behavior of an ideally polarized disk electrode: A global and local impedance analysis, Journal of The Electrochemical Society 154 (2007) C81–C88.
[13] R. de Levie, Electrochemical response of porous and rough electrodes, in: P. Delahay (Ed.), Advances in electrochemistry and electrochemical engineering, Interscience Publishers, 1967, pp. 329–395.
[14] A. Lasia, Impedance of porous electrodes, Journal of Electroanalytical Chemistry 397 (1995) 27–33.
[15] H. K. Song, H. Y. Hwang, K. H. Lee, L. H. Dao, The effect of pore size distribution on the frequency dispersion of porous electrodes, Elec- trochimica Acta 45 (2000) 2241–2257.
[16] T. Pajkossy, T. Wandlowski, D. M. Kolb, Impedance aspects of anion adsorption on gold single crystal electrodes, Journal of Electroanalytical Chemistry 414 (1996) 209–220.
[17] T. Pajkossy, Impedance of rough capacitive electrodes, Journal of Electroanalytical Chemistry 364 (1994) 111–125.
[18] Z. Kerner, T. Pajkossy, Impedance of rough capacitive electrodes: The role of surface disorder, Journal of Electroanalytical Chemistry 448 (1998) 139–142.
[19] M. Birla Singh, R. Kant, Theory of anomalous dynamics of electric double layer at heterogeneous and rough electrodes, The Journal of Physical Chemistry C 118 (2014) 5122–5133.
[20] T. Borisova, B. Ershler, Determination of the zero voltage points of solid metals from measurements of the capacity of the double layer, Zhurnal Fizicheskoi Khimii 24 (1950) 337–344.
[21] B. B. Mandelbrot, The Fractal Geometry of Nature, Freeman, San Franscisco, 1982.
[22] A. L. Mehaute, G. Crepy, Introduction to transfer and motion in fractal media: The geometry of kinetics, Solid State Ionics 9 (1983) 17–30.
[23] L. Nyikos, T. Pajkossy, Fractal dimension and fractional power frequency-dependent impedance of blocking electrodes, Electrochim- ica Acta 30 (1985) 1533–1540.
[24] Z. Kerner, T. Pajkossy, On the origin of capacitance dispersion of rough electrodes, Electrochimica Acta 46 (2000) 207–211.
[25] T. Pajkossy, Impedance spectroscopy at interfaces of metals and aque- ous solutions: Surface roughness, CPE and related issues, Solid State Ionics 176 (2005) 1997–2003.
[26] B. Emmanuel, Computation of ac responses of arbitrary electrode ge- ometries from the corresponding secondary current distributions: A method based on analytic continuation, Journal of Electroanalytical Chemistry 605 (2007) 89–97.
[27] J. S. Newman, Frequency dispersion in capacity measurements at a disk electrode, Journal of The Electrochemical Society 117 (1970) 198–203.
[28] V. M. W. Huang, V. Vivier, M. E. Orazem, N. Pbre, B. Tribollet, The apparent constant-phase-element behavior of a disk electrode with faradaic reactions a global and local impedance analysis, Journal of The Electrochemical Society 154 (2007) C99–C107.
[29] J. S. Newman, Resistance for flow of current to a disk, Journal of the Electrochemical Society 113 (1966) 501–502.
[30] S. Trassati, R. Parsons, Interphases in systems of conducting phases, Pure and Applied Chemistry 58 (1986) 437–454.
[31] M. E. Orazem, N. P´eb`ere, B. Tribollet, Enhanced graphical representa- tion of electrochemical impedance data, Journal of the Electrochemical Society 153 (2006) B129–B136.