HAL Id: hal-00934930
https://hal.archives-ouvertes.fr/hal-00934930
Submitted on 22 Jan 2014
HAL is a multi-disciplinary open access archive for the deposit and dissemination of sci- entific research documents, whether they are pub- lished or not. The documents may come from teaching and research institutions in France or abroad, or from public or private research centers.
L’archive ouverte pluridisciplinaire HAL, est destinée au dépôt et à la diffusion de documents scientifiques de niveau recherche, publiés ou non, émanant des établissements d’enseignement et de recherche français ou étrangers, des laboratoires publics ou privés.
Defining Groundwater Remediation Objectives with Cost-benefit Analysis: Does It Work?
Jean-Daniel Rinaudo, Stéphanie Aulong
To cite this version:
Jean-Daniel Rinaudo, Stéphanie Aulong. Defining Groundwater Remediation Objectives with Cost- benefit Analysis: Does It Work?. Water Resources Management, Springer Verlag, 2014, 28 (1), pp.261-278. �10.1007/s11269-013-0483-0�. �hal-00934930�
Defining groundwater remediation objectives with cost-
1
benefit analysis: does it work?
2 3
J-D. Rinaudo and S. Aulong 4
5
BRGM (French Geological Survey) 1034 rue de Pinville, 34 000 Montpellier, 6
France.
7
*Corresponding author (E-mail: jd.rinaudo@brgm.fr) 8
9
Abstract 10
The use of cost-benefit analysis (CBA) is increasingly advocated as a tool for supporting
11
water planning decisions, in particular at the local (site) level. This paper questions whether
12
CBA is relevant for evaluating groundwater management options at the scale of large
13
regional aquifers. It highlights the difficulties related to estimating the cost of groundwater
14
protection and remediation measures at the regional (water body) level. It also identifies
15
methodological challenges in estimating the economic value of the benefits of groundwater
16
protection. The paper is based on an original case study carried out on the upper Rhine
17
valley aquifer in eastern France. The methodology deployed combines engineering
18
approaches to assess the cost of remediation and economic methods (contingent valuation)
19
to estimate the benefits associated with groundwater improvement.
20 21
Keywords 22
Cost-benefit analysis; groundwater remediation; contingent valuation 23
survey; volatile organic compounds (VOC); willingness to pay.
24 25 26
1. INTRODUCTION 28
Following the promulgation of the Water Framework Directive (2000/60/EC), the European 29
Commission prepared and published a daughter directive (2006/118/EC) which focuses on 30
groundwater-specific issues. One of the main purposes of this daughter directive was to 31
establish a general framework and procedures for specifying the quality levels which should 32
be achieved in various hydro-geological contexts (Quevauviler, 2008). The Directive 33
recognises that groundwater quality objectives should be set considering the local geological 34
context and natural background concentrations and that no uniform standards should apply 35
uniformly across Europe.. The definition of groundwater quality objectives may also be based 36
on an economic assessment of the costs and benefits of reaching different quality levels 37
(Brouwer, 2008). This flexible policy approach leads to a new demand for methodologies and 38
reference case studies which can be used to construct a practical Cost-Benefit Analysis (CBA) 39
approach for application in groundwater protection programs. This paper employs a case 40
study approach to discuss some of the key related methodological issues.
41
Implementing cost-benefit analyses of alternative groundwater protection or restoration 42
scenarios is no trivial task. For historical reasons, CBA has been more widely used in the US 43
than in European countries (Pearce, 1998) in particular for promoting efficient use of scarce 44
financial resources allocated to soil and groundwater decontamination (Kiel & Zabel, 2001).
45
Concerning industrial contamination, CBA has mostly been applied at the site (local) level 46
(Hardisty & Özdemiroglu, 2005; Rinaudo & Loubier, 2005). CBA has also been used to 47
assess agricultural pollution control programs, with one study considering a range of pollution 48
levels (Yada & Wall, 1998). However, American studies have generally focused on situations 49
where the benefits of groundwater protection and/or decontamination are related to direct 50
groundwater use. Benefits are often considered as avoided costs – such costs consisting of 51
health-damage costs (Sharefkin, Shechter & Kneese, 1984) or the cost of averting behaviours 52
(Abdalla, 1994, Yadav & Wall, 199). Even contingent valuation studies mainly consider use 53
benefits (for a review see Hardisty & Özdemiroglu, 2005, Poe, Boyle & Bergstrom, 2001).
54
This is a quite different situation from that of Europe, where the population is almost entirely 55
supplied by public water systems. The only direct link that exists between groundwater 56
quality and households’ wellbeing is the price they pay for the drinking-water supply 57
(increasing water treatment cost in case of pollution) and the possible impact of groundwater 58
deterioration on groundwater-dependent ecosystems. Clearly, only a tiny minority of 59
households depending on private wells would be directly concerned by health risks due to 60
groundwater pollution or by the need to invest in private treatment. A consequence is that, in 61
the European context, groundwater valuation studies should focus more on the ecological 62
benefits generated by action programs, and less on direct use benefits alone. This is also 63
required by the European Water Framework Directive.
64
The first methodological issue investigated in this paper is how to assess the economic value 65
of ecological benefits associated with groundwater protection or remediation. The Contingent 66
Valuation (CV) method can theoretically be used to assess such ecological benefits, if 67
respondents are provided with precise information on the impact that the action scenario in 68
question would have on a groundwater-dependent ecosystem (Carson et al, 2001; Brouwer, 69
2008). However, a review of the literature shows that few studies have done this. Following 70
the seminal study by Edwards (Edwards, 1988), a significant literature has addressed how to 71
assess the economic value of groundwater protection benefits. In the USA, following the 72
recommendation of the Water Resources Council, most of the studies have used the 73
contingent valuation (CV) method. In their 2001 paper, Poe et al. identify 19 groundwater 74
valuation studies using CV (Poe, Boyle & Bergstrom, 2001). However, Poe notes that many 75
of these studies are valuing the improvement of groundwater quality when used by 76
households for their own water supply. An extreme example is the study of Jordan &
77
Elnagheeb (1993) who assess the willingness of households to pay for treating groundwater 78
before use. Fewer studies were designed to assess both use and non-use benefits, considering 79
the impacts on groundwater-dependent ecosystems (Lazo, Schulze et al. 1992) and the 80
interactions between groundwater and ecosystem-protection benefits (Randal, DeZoysa & Yu, 81
2001). In Europe, published studies are still scarce and they do not really address the issue of 82
the valuation of the ecological benefits of groundwater protection and remediation (Press &
83
Söderqvist, 1998, Rozan, Stenger & Willinger, 1997, Stenger & Willinger, 1998, Tentes &
84
Damigos, 2012).
85
The second methodological issue investigated in this paper relates to the evaluation of 86
benefits associated with various groundwater-quality levels. Most of the studies found in the 87
literature use the contingent valuation method to assess a population’s willingness to pay 88
(WTP) for achieving a specific predefined groundwater-quality target. This paper presents an 89
attempt to fill this gap by means of a case study in which costs and benefits are estimated for 90
several groundwater-quality levels. The originality of the approach lies in the combination of 91
economic and engineering approaches: these are too often kept separate in the economic 92
literature which focuses solely on benefits. The approach is implemented in a case study 93
located in eastern France where the groundwater is polluted with Volatile Organic 94
Compounds (VOC), a group of substances widely used (mainly as solvents) in industry and 95
frequently detected in groundwater.
96
This paper is organised as follows. The next section describes the case study area and the 97
methodology used to assess the cost of remediation and the benefits generated. Results are 98
presented in the third section, and the paper concludes with a discussion of problems related 99
to the use of contingent valuation in groundwater CBA.
100
2. CASE STUDY AND METHODOLOGY 101
2.1. Presentation of the case study 102
The upper Rhine valley alluvial aquifer is located between Germany and France, and covers 103
4200 square kilometres. With a reserve of approximately 45 km3 of water - approximately 104
half of the volume of Lake Geneva - this aquifer is one of the largest fresh water reserves in 105
Europe. Groundwater from the Rhine alluvial valley supplies 75% of the drinking water needs 106
and about half of the industrial water needs of the region. More than three million inhabitants 107
of Alsace (France) and Baden-Württemberg (Germany) directly depend on this resource for 108
their water supply. Although usable for drinking purposes without prior treatment in most 109
locations, groundwater has been progressively affected by both diffuse and point-source 110
pollution since the 1970s. Four major pollutions sources threaten this aquifer: nitrates, 111
pesticides, chlorides, and VOC. High VOC concentrations have been detected downstream of 112
several industrial areas. The most frequently observed molecules are trichloroethylene (TCE), 113
tetrachloroethylene (PCE) and 111 trichloroethane (111 TRI). In a groundwater-quality 114
measurement campaign carried out in 1996-97, at least one of the three substances listed 115
above was detected in 38% of the 423 French and 533 German groundwater samples. The 116
measured concentrations were less than 0.2 µg/l in 70% of the contaminated samples. Values 117
ranging between 0.2 and 10 µg/l are reported in 25% of the samples. Only 6% of the samples 118
show concentrations higher than 10 µg/l, which is the maximum value for drinking water use 119
according to the EU standard.
120 121
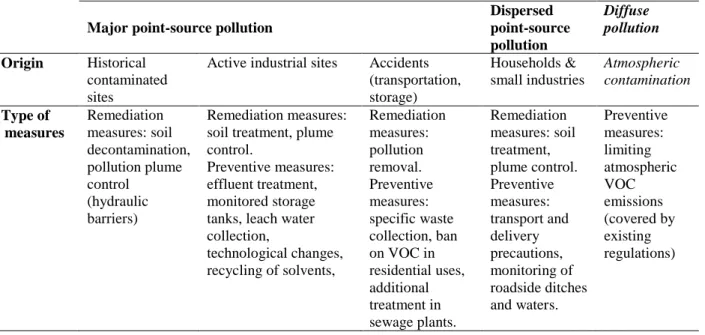
2.2. Programme of groundwater-restoration measures: design and cost assessment 122
The first part of the research consisted of developing a tool for designing and assessing the 123
cost of the programme of measures required to achieve various groundwater-quality 124
objectives. The major steps involved in the development of that tool are depicted in figure 1.
125
The tool incorporates several databases and Visual Basic queries developed using Microsoft 126
Access ®. Given a groundwater-quality objective (maximum concentration) specified by the 127
user, the tool successively performs the following steps:
128
(1) It first identifies all groundwater areas where the observed VOC concentration exceeds 129
the targeted threshold value; this is done by using the regional groundwater-quality 130
database, which comprises information for 423 monitoring points; this step defines the 131
geographical scope of the programme of measures.
132
(2) The tool then identifies all sites and firms (industrial companies and other) located 133
within the area selected in Step 1 which are likely to generate a significant risk of 134
pollution. Companies are selected using a list of 110 potentially polluting activities 135
which was established after an extensive literature review, internet searches, and 136
advice from industrial experts. This step also uses statistical databases which provide 137
detailed technical and economic information on all firms at the municipal level 138
(SIREN database) and on historical contaminated sites (Basias and Basol databases).
139
(3) The third step consists of identifying the prevention and remediation measures that 140
need to be implemented for all selected firms and historical contaminated sites. This is 141
based on a matrix specifying a list of measures for each of the 110 economic activities 142
considered (Table 1). This matrix was also established based on literature review, 143
internet search, and expert advice.
144
(4) Finally, the tool assesses the total cost of the programme of measures defined in Step 145
3. This is based on a cost matrix which specifies the investment and recurring costs for 146
all measures. An annual cost is estimated considering the technical lifespan of each 147
measure, applying a 4% discount rate. More details on the types of measures and on 148
cost estimation are provided in Appendix 1.
149 150 (5)
Major point-source pollution
Dispersed point-source pollution
Diffuse pollution Origin Historical
contaminated sites
Active industrial sites Accidents (transportation, storage)
Households &
small industries
Atmospheric contamination Type of
measures
Remediation measures: soil decontamination, pollution plume control
(hydraulic barriers)
Remediation measures:
soil treatment, plume control.
Preventive measures:
effluent treatment, monitored storage tanks, leach water collection,
technological changes, recycling of solvents,
Remediation measures:
pollution removal.
Preventive measures:
specific waste collection, ban on VOC in residential uses, additional treatment in sewage plants.
Remediation measures: soil treatment, plume control.
Preventive measures:
transport and delivery precautions, monitoring of roadside ditches and waters.
Preventive measures:
limiting atmospheric VOC emissions (covered by existing regulations)
(6) Table 1: Overview of measures considered for remediation of VOC pollution.
151
152
153
Figure 1: Main steps of the methodology used for designing the programme of measures.
154 155 156 157
2.3. Assessment of environmental benefits 158
2.3.1. Contingent valuation survey 159
The second part of the research consisted of assessing the benefits associated with 160
groundwater protection. The benefits were estimated by eliciting the population’s willingness 161
to pay (WTP) for the two levels of groundwater protection. A contingent valuation survey was 162
carried out between March and July 2006 using a postal survey. The mail survey method was 163
chosen to ensure that respondents would have sufficient time to get to know an unfamiliar 164
subject, and think about preferences. Following a careful pre-test of the questionnaire in 140 165
face-to-face interviews, the questionnaire was mailed out to 5,000 households selected in rural 166
localities (2,000), urban areas (2,000) and in municipalities located outside the aquifer which 167
used other water resources (1,000). The survey response rate was 13%, equally distributed 168
between urban and rural municipalities (49 – 51%) and with respectively 79 and 21% of 169
respondents located above and outside the aquifer.
170
One of the main specific characteristics of the survey consisted of asking respondents to 171
consider and value two scenarios (for a similar approach focusing on surface water, see 172
Lienhoop & Messner, 2009). The first scenario, assumes that groundwater-remediation 173
measures are implemented only in areas where pollutant concentrations exceed drinking- 174
water standards. The main expected benefits consist of avoiding costly water treatment for 175
present and future generations. Respondents are informed that traces of contamination remain 176
in parts of the aquifer with possible impacts on groundwater-dependent aquatic ecosystems 177
(wetlands, rivers). Drinking water supply may also contain traces of contaminants but at 178
concentration levels below European standards (no health risk). This information is supported 179
in the questionnaire by a groundwater-quality map. The second scenario assumes that 180
groundwater-remediation measures are implemented in all areas where traces of VOC are 181
detected. The benefits of this scenario derive from restoring pristine water quality. This also 182
means that tap water delivered to citizen is totally free of contaminants (not even traces); that 183
groundwater-dependent ecosystems are no longer threatened by residual groundwater 184
pollution; and that future generations inherit a much improved natural heritage. The main 185
features of the two scenarios which were presented to respondents are summarised in Table 2.
186 187
Scenario 1 Scenario 2
Objective Restoring groundwater potability Restoring natural groundwater quality (no traces of solvents in the long term)
PoM timing 10 years 10 years
Actions implemented as part of the
scenario
- Remediation measures implemented in historical contaminated sites located in areas where CS exceeds drinking water
threshold value
- Preventive measures applied (through regulation) in all enterprises using chlorinated solvents and located in areas where concentrations in solvents exceed
drinking water threshold.
- Remediation measures implemented in historical contaminated sites located in areas where traces of solvents are detected
- Preventive measures applied (through regulation) in all enterprises using chlorinated solvents and located in areas where traces of solvents have been detected Expected
benefits
- Drinking water quality level restored within 10 years but traces of CS remain in
the aquifer, with risk of impacts on ecosystems.
- Reduction in future drinking-water treatment cost.
- Natural quality restored, traces of CS disappear within 50 years: natural
attenuation contributes.
- Environmental benefits for ecosystems and water-related species, absence of risk for
humans using groundwater.
- Heritage benefits (for future generations).
Table 2: Summary of groundwater scenario presented to respondents in the survey questionnaire.
188
2.3.2. Contingent valuation questionnaire 189
The questionnaire is organised as follows. It starts with a brief description of the upper Rhine 190
valley aquifer, accompanied by a map intended to help respondents determine whether the 191
locality they live in is located above the aquifer or not. This is followed by a set of questions 192
related to the respondent’s use of the aquifer (private well, drinks tap water or not, practice of 193
leisure activities related to water). It then focuses on respondent’s perception and knowledge 194
of groundwater. Respondents are then informed about the groundwater contamination 195
problem and its expected future evolution. The four major pollution sources (nitrates, 196
pesticides, chlorides from the mining industry, and chlorinated solvents) are presented. We 197
explain that whereas the problems of nitrates, pesticides, and chloride should be solved by 198
2015 by measures already implemented, pollution by chlorinated solvents will remain as an 199
obstacle to good groundwater quality. The extent of today’s pollution by chlorinated solvents 200
is depicted on a map which shows in red the locations where solvents have been found in 201
concentrations exceeding drinking-water thresholds, and in yellow where traces that do not 202
exceed the drinking water threshold have been found. The text briefly identifies the origins of 203
the contamination and outlines the future pollution trends if no remediation and preventive 204
measures are undertaken to control the pollution. The description of the two action scenarios 205
follows. Respondents are then asked how realistic the scenarios are and about their 206
willingness to pay to obtain the related benefits. Follow-up questions are used to understand 207
their motivations to pay (or to refuse payment). The questionnaire ends by collecting the 208
respondent’s socio-economic characteristics.
209
The two scenarios are presented successively to respondents1. Households are asked how 210
much they would be willing to pay over ten years2 on top of their water bill . A payment card 211
is offered to the respondents to elicit their WTP. The card includes thirty five amounts, with a 212
minimum of €2 (besides a zero bid which is also allowed) and a maximum of €500 (value 213
chosen after the questionnaire was tested in face-to-face interviews, see below). 3 214
215 216
1 A careful pre-test of the questionnaire showed that the order in which the two scenarios were presented to respondents had no effect on stated WTP. In the postal survey, the two scenarios were presented in the same order in all questionnaires.
2 Respondents are requested to state the amount they would be willing to pay over the ten years corresponding to the implementation of the program of measures. WTP is thus expressed in €/household/year over 10 years.
3 For a discussion of the pro and cons of the payment card approach versus the dichotomous choice experiment approach, see Ryan et al, 2004.
3. RESULTS 217
3.1. Cost of groundwater restoration 218
In the first scenario, we assume that specific protection and remediation measures are applied 219
to sites and firms located in areas where groundwater exhibits VOC concentrations exceeding 220
the drinking-water quality threshold. No specific action is undertaken in other areas where the 221
presence of VOC is detected but does not exceed the drinking-water threshold. The second 222
scenario aims at suppressing all sources of VOC contamination. This scenario assumes that 223
the same technical measures are applied to all sites and firms located in areas where traces of 224
VOC have been detected, including locations where pollution does not exceed drinking-water 225
standards. The programmes of measures corresponding to the two scenarios are assessed 226
using the computer tool described in the previous section.
227
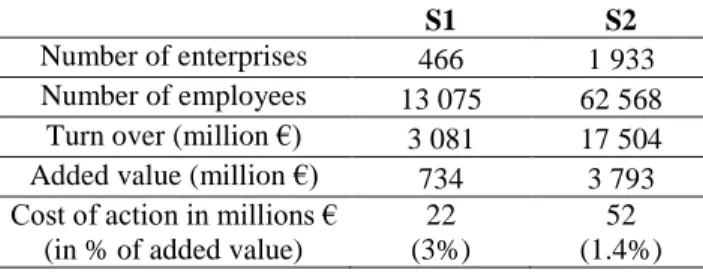
As shown in Table 3, the number of firms involved in the programme of actions is 228
significantly larger for the second scenario than for the first one. The total cost, estimated at 229
€52 million, is more than twice that of Scenario 1 (€22 million)4. One of the questions then 230
raised by policy makers is whether the benefits generated by the overall higher water quality 231
justify the additional cost of approximately €30 million.
232 233
S1 S2
Number of enterprises 466 1 933 Number of employees 13 075 62 568
Turn over (million €) 3 081 17 504 Added value (million €) 734 3 793 Cost of action in millions €
(in % of added value)
22 (3%)
52 (1.4%)
Table 3: Enterprises located in areas where the presence of VOC is detected and for which preventive measures
234
are implemented (Scenarios 1 and 2).
235 236
4 Investment costs that will be incurred at the beginning of the period represent respectively 82% and 86% for the two scenarios. Recurring operational and maintenance cost will spread over a ten-year periods. They are
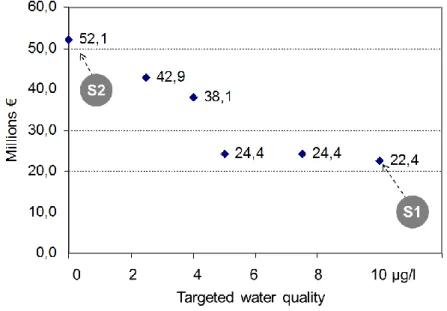
The calculations were then repeated for several water quality objectives. In each calculation, 237
the objective was defined by a target groundwater maximum VOC concentration which 238
ranges between 0 (removal of all traces of pollutant) and the drinking-water quality standards 239
(DWQS). The results, depicted in Figure 2 below, show that the cost of the programme 240
remains relatively stable for a targeted water quality of between 50% and 100% of the 241
DWQS. The cost of the PoM increases significantly when the quality objective goes below 242
40% of the DWQS. The increase which occurs around 40% is mainly due to an increase in the 243
number of historical contaminated sites involved in the programme of actions.
244
245
Figure 2: Evolution of the total cost as a function of the targeted quality threshold value 246
(expressed in percentage of drinking water standards for COV).
247 248 249
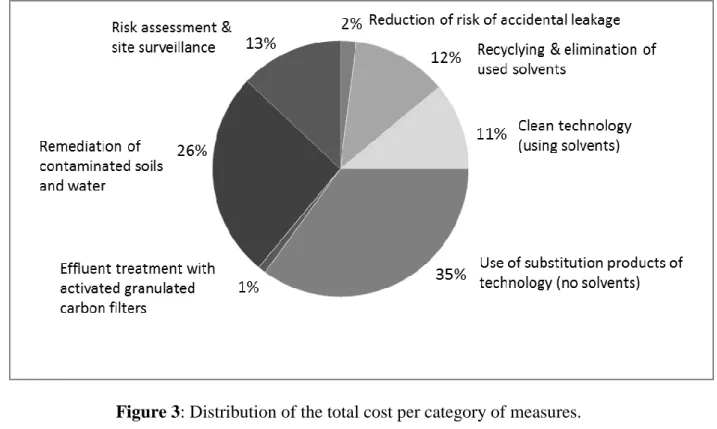
These results were presented to experts from the Rhine Meuse Water Agency. They 250
considered them to be a very useful input to their planning process. They emphasized the 251
difficulties they usually face when trying to assess the cost of groundwater remediation 252
programmes covering several hundreds or thousands of pollution sources. The systematic 253
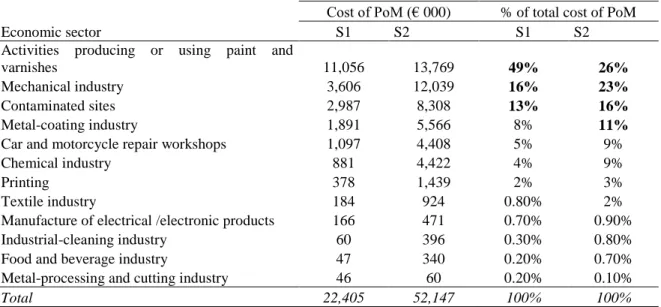
approach implemented in this research provided useful elements for budget planning. They 254
were also very interested to learn that most of the cost was related to actions to be 255
implemented in three industrial sectors (see Table 4). Last but not least, the information 256
related to the distribution of cost per category of action (see Figure 3) was also considered to 257
be very useful when planning actions regarding the budget, and technical and human 258
resources.
259 260
Economic sector
Cost of PoM (€ 000) % of total cost of PoM
S1 S2 S1 S2
Activities producing or using paint and
varnishes 11,056 13,769 49% 26%
Mechanical industry 3,606 12,039 16% 23%
Contaminated sites 2,987 8,308 13% 16%
Metal-coating industry 1,891 5,566 8% 11%
Car and motorcycle repair workshops 1,097 4,408 5% 9%
Chemical industry 881 4,422 4% 9%
Printing 378 1,439 2% 3%
Textile industry 184 924 0.80% 2%
Manufacture of electrical /electronic products 166 471 0.70% 0.90%
Industrial-cleaning industry 60 396 0.30% 0.80%
Food and beverage industry 47 340 0.20% 0.70%
Metal-processing and cutting industry 46 60 0.20% 0.10%
Total 22,405 52,147 100% 100%
Table 4: Enterprises located in areas where the presence of VOC is detected and for which preventive measures
261
are implemented (Scenarios 1 and 2).
262 263
264
Figure 3: Distribution of the total cost per category of measures.
265 266
3.2. Willingness to pay for groundwater protection: survey results 267
The results of the survey highlight the fact that the population is concerned about groundwater 268
protection. Groundwater pollution is identified as the second most important environmental 269
problem after air pollution (45 and 48% respectively).
270
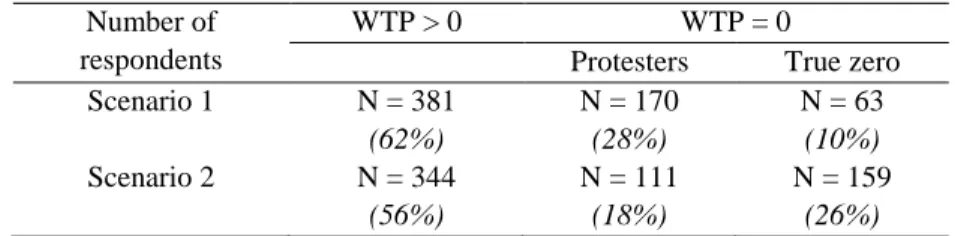
Sixty-two percent of respondents would agree to pay for remediating groundwater under 271
Scenario 1, which consists of restoring drinking-water quality standards in the aquifer. The 272
average stated WTP is €42/year/household (in 2006 €), which is in the lower range of values 273
reported elsewhere in the world (see Bergstrom et al., 2001). It is also slightly lower (in 274
constant euros) than the WTP values estimated by Stenger et al. (1998) in the same case study 275
ten years earlier. Note that comparison of stated WTP in absolute value terms is a difficult 276
exercise, since WTP values are highly dependent on the information provided to respondents 277
(baseline scenario, information related to health impacts of pollution, etc.).
278
When asked to justify why they contribute, most respondents explain they want to preserve an 279
option for potential future use of the aquifer for themselves (option value) or future 280
generations (bequest value). Other reasons presented are the personal current direct use of the 281
aquifer via the municipal water supply system (direct use value) and the satisfaction from 282
preserving aquatic life in groundwater dependent ecosystems for present (indirect use value) 283
and future generations (bequest value).
284
Another interesting result is that 54% of respondents in our survey are willing to pay more for 285
improving groundwater quality beyond strict compliance with drinking-water quality 286
standards (€76/year/household on average). Information collected by the authors when testing 287
the questionnaire in face-to-face interviews helps understanding this result. Many respondents 288
are concerned by the presence of dangerous substances in the water they drink, even if the 289
authorities can guarantee that drinking-water standards are met. Most of these people are 290
drinking bottled water because they do not place trust in tap water. They are therefore willing 291
to pay to remove all traces of pollution so that they can again rely on tap water for daily use.
292
Their WTP reflects an increased use value. Other respondents indicate their willingness to pay 293
for removing environmental risks which are not related to health (potential impacts of VOC 294
on fauna and flora). Their WTP indicate a non-use value. Overall, it was not possible from our 295
survey to disentangle use and non-use values.
296
The study also reveals that the population is very sensitive to the implementation of the 297
“polluter pays” principle. Many respondents, who refused to contribute to the scenarios for 298
protest motives (see column “protest” in table 5), argued that polluters (industries) should pay, 299
not citizens. Similar attitudes have been reported in other case studies where polluters are 300
known and theoretically liable to pay for remediation costs (Tentes & Damigos, 2012).
301 302
Number of respondents
WTP > 0 WTP = 0
Protesters True zero
Scenario 1 N = 381
(62%)
N = 170 (28%)
N = 63 (10%)
Scenario 2 N = 344
(56%)
N = 111 (18%)
N = 159 (26%) Table 5: Number of respondents accepting refusing to pay for the two scenarios.
303 304
3.3. WTP econometric analysis 305
Econometric models were developed to investigate whether the expected relationships 306
between WTP and independent variables hold. Separate models were tested and estimated to 307
explain the stated WTP for Scenarios 1 and 2. We used both OLS regressions5 (excluding 308
zero values) and the Tobit model (for WTP ≥ 0 excluding protest bids). Both statistical models 309
tend to underestimate WTP as compared to the observed (survey) values. However, we 310
consider that the predictive capacity of the models is acceptable (Table 6) 311
312
Mean WTP WTP > 0 WTP ≥ 0 without protest bids
OLS regression Observed Tobit model Observed
Scenario 1 €29.2 €42 €20.4 €36.4
Scenario 2 €50.0 €76 €34.5 €52
Table 6: Predicted WTP for Scenarios 1 and 2 with OLS and Tobit models.
313
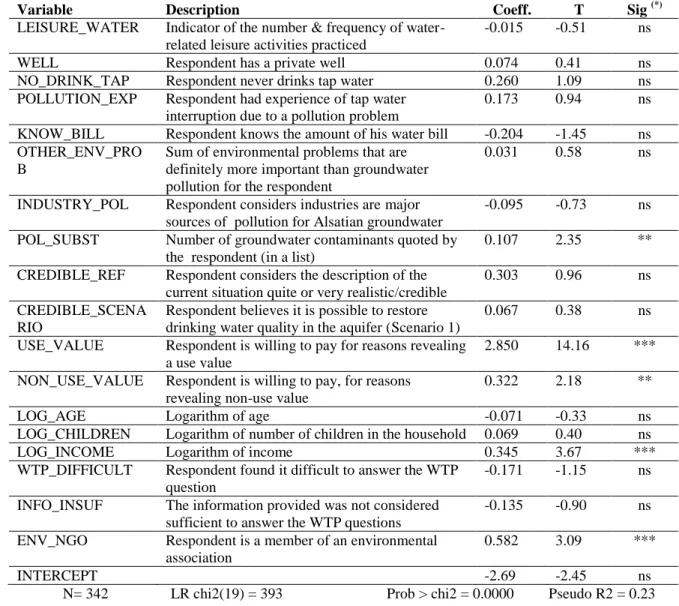
Overall, the econometric analysis confirms the validity of responses, since WTP correlates as 314
expected with the main explanatory variables (see Table 7). WTP is positively correlated with 315
income with an elasticity of 0.35 in Scenario 1 and 0.54 in Scenario 2 (significant at the 99%
316
level). WTP is also negatively correlated with age (99% confidence level) and positively 317
correlated with membership in a nature-protection association.
318
5 The estimated model is a semi-log model: Log(WTP)= ai.Xi + bi log(Yi) + C where Yi are AGEZ, NUMBER OF CHILDREN and INCOME and Xi are all other dependent variables except income. All parameters bi can directly be interpreted as elasticity.
WTP seems to be strongly determined by the motivations quoted by respondents when 319
justifying their decisions to pay. Two binary variables were constructed to describe these 320
motivations. The first one takes the value 1 if respondent has quoted some reasons which are 321
related to use values (USE_VALUE) and the second one if respondent has quoted reasons 322
related to non-use values (NON_USE_VALUE). The estimated coefficients however show 323
that the effect of the first variable is much greater than the second (approximately 4 times) 324
and this holds for both scenarios. This means that individuals whose WTP is motivated by 325
direct use benefits are likely to pay €17.3 more than others. By contrast, quoting a non-use 326
benefit as WTP motivation only increases WTP by €1.3.
327
Another interesting result of the econometric analysis is that there is no statistical difference 328
between the “willingness to pay” amounts declared by households living above the aquifer 329
(and using it for their water supply) and others living outside the aquifer. The later may not be 330
aware of the boundaries of the aquifer, or wrongly believe their water supply currently 331
depends from the aquifer. They may also consider that they will be able to use that resource in 332
the new future if pipelines are constructed to import that water to where they live. This 333
finding suggests that users and non-users are equally concerned by groundwater protection.
334 335 336
Variable Description Coeff. T Sig (*) LEISURE_WATER Indicator of the number & frequency of water-
related leisure activities practiced
-0.015 -0.51 ns
WELL Respondent has a private well 0.074 0.41 ns
NO_DRINK_TAP Respondent never drinks tap water 0.260 1.09 ns
POLLUTION_EXP Respondent had experience of tap water interruption due to a pollution problem
0.173 0.94 ns
KNOW_BILL Respondent knows the amount of his water bill -0.204 -1.45 ns OTHER_ENV_PRO
B
Sum of environmental problems that are definitely more important than groundwater pollution for the respondent
0.031 0.58 ns
INDUSTRY_POL Respondent considers industries are major sources of pollution for Alsatian groundwater
-0.095 -0.73 ns
POL_SUBST Number of groundwater contaminants quoted by the respondent (in a list)
0.107 2.35 **
CREDIBLE_REF Respondent considers the description of the current situation quite or very realistic/credible
0.303 0.96 ns
CREDIBLE_SCENA RIO
Respondent believes it is possible to restore drinking water quality in the aquifer (Scenario 1)
0.067 0.38 ns
USE_VALUE Respondent is willing to pay for reasons revealing a use value
2.850 14.16 ***
NON_USE_VALUE Respondent is willing to pay, for reasons revealing non-use value
0.322 2.18 **
LOG_AGE Logarithm of age -0.071 -0.33 ns
LOG_CHILDREN Logarithm of number of children in the household 0.069 0.40 ns
LOG_INCOME Logarithm of income 0.345 3.67 ***
WTP_DIFFICULT Respondent found it difficult to answer the WTP question
-0.171 -1.15 ns
INFO_INSUF The information provided was not considered sufficient to answer the WTP questions
-0.135 -0.90 ns
ENV_NGO Respondent is a member of an environmental association
0.582 3.09 ***
INTERCEPT -2.69 -2.45 ns
N= 342 LR chi2(19) = 393 Prob > chi2 = 0.0000 Pseudo R2 = 0.23
337
(*) : Sig stands for statistical significance. “ns” indicate that the variable is not significant; ** and *** indicate
338
the variable is significant at the 95% and 99% level. All variables included in the model improve the overall fit.
339
Others have been removed.
340
Table 7: Estimated Tobit model for log(WTP) in Scenario 1.
341 342
3.4. WTP aggregation and cost benefit analysis 343
The main objective of the contingent valuation survey was to assess the benefits of two 344
scenarios for groundwater pollution remediation. The total benefits of each scenario can be 345
roughly estimated by extrapolating the average stated WTP to the entire population affected 346
by groundwater quality. The extrapolation can be done by simply multiplying the average 347
WTP by the number of households in the region and by ten years (period during which 348
respondents have agreed to pay). The aggregation procedure is more complex if the survey 349
sample is not representative of the regional population. As this was the case in the present 350
survey, the bias was corrected before extrapolating the results6. The aggregate willingness to 351
pay for the entire region (considered as a proxy for groundwater protection benefits) was 352
subsequently estimated at €236 million over a ten-year period for Scenario 1 (drinking-water 353
quality level) and €377 million for Scenario 2 (natural-groundwater quality level). Table 4 354
shows that the net present value for the two groundwater restoration scenarios is largely 355
positive (resp. € 224 and 340 million). From a pure welfare economics perspective, the results 356
suggest that the second scenario should be preferred. This conclusion should however be 357
considered with caution, considering uncertainties related to the population concerned (benefit 358
extrapolation) and the cost estimation (assumptions related to measure adoption rates, see 359
appendix).
360 361
4. DISCUSSION 362
The main objective of the case study presented in this paper was to investigate the relevance 363
of cost benefit analysis for assessing groundwater remediation, considering two scenarios 364
targeting different water quality objectives. It highlights a number of methodological 365
difficulties related to costs and to benefit-estimation procedures which are discussed in this 366
section.
367 368
4.1. Cost estimate uncertainty 369
Concerning costs, one of the main challenges lies in the scale at which WFD remediation 370
6 The sample bias was corrected as follows. We calculated an average WTP per professional category in our sample, using the national occupational classification system. The adjusted values were then used to extrapolate results of the survey to the entire regional population.
programmes have to be defined. While engineers are used to designing decontamination 371
programmes at scales ranging from a few hectares to few square kilometres, it is much more 372
difficult to assess the level of effort – both in technical and financial terms – required to 373
improve the quality of an aquifer extending over several thousand square kilometres, 374
particularly in the case of non-agricultural pollution. The case study presented in this paper 375
illustrates the complexity associated with the identification of multiple potential pollution 376
sources and the definition of technical measures that should be implemented to prevent any 377
further emission, or to contain and/or decontaminate existing pockets of contaminated 378
groundwater. The approach proposed in this paper, which consists of combining various 379
sources of statistical data with expert advice, allows a gross estimate of the total cost to be 380
produced. However, a high uncertainty is attached to the results obtained. This uncertainty 381
could probably not be reduced without engaging over costly surveys and studies to 382
characterise the actual pollution level in thousands of potentially contaminated or 383
contaminating sites and firms. If we accept that the uncertainty of the cost estimate is 384
irreducible, then the value to decision makers of the numerical results of CBA remains 385
limited, whatever efforts are made to assess the benefits. We contend however that the 386
economic approach provides a useful analytical framework for putting together pieces of 387
knowledge which are scattered among a large number of experts and stakeholders. In that 388
sense, the main outcome of an economic evaluation of costs and benefits is not the precise 389
figures that are produced, but the fact that it helped to construct a shared knowledge base on 390
which decision makers may rely when making and justifying their decisions.
391 392
4.2. The limits of CVM for assessing the benefits of groundwater protection 393
The paper also addresses several questions related to the use of contingent valuation for 394
assessing the benefits of groundwater protection in the European context. One of the main 395
challenges is related to the nature of the benefits to be estimated. While most previous CV 396
studies focussed on areas where groundwater was intensively used, the WFD requires 397
Member States to assess the benefits of groundwater protection for all types of aquifers, 398
including those which are not exploited. Economists are therefore asked to assess non-use 399
benefits, including the indirect benefits of groundwater remediation for dependent ecosystems 400
such as rivers and wetlands, and option and bequest values. One of the main problems is then 401
to accurately describe this indirect effect in CV surveys. This is all the more difficult that 402
water scientists themselves are not able to model the complex relationships that determine 403
pollution transfer from aquifers to rivers and wetlands, and the subsequent impacts on flora 404
and fauna. If the information presented in the questionnaire is too vague, what does WTP 405
actually measure? In the present case, the difference between stated WTP for Scenarios 1 and 406
2 actually measure relatively “fuzzy” benefits (Lienhoop et Messner, 2009) and there are few 407
options for reducing this fuzziness.
408
Another key difficulty related to the use of CV for evaluating groundwater protection benefits 409
is that respondents generally know very little about groundwater, how the resource works, the 410
threats that endanger it, and the benefits associated with its protection or remediation. This is 411
again more pronounced in the EU situation where only a few households rely solely on 412
private wells for their drinking-water supply. Let us recall that, in our case study, 82% of the 413
respondents considered that they were not well informed about the groundwater problem 414
described in the questionnaire, although more than half had already heard about groundwater 415
pollution, with 20% being able to quote a precise example. To make sure that all respondents 416
value the same good, questionnaires should therefore be designed to convey adequate 417
information on groundwater, its problems, and the benefits associated with its protection. As 418
already mentioned in the literature, this may have a WTP-enhancing effect. Another concern 419
is that households may be in a situation of preference construction7 when stating their WTP, 420
which cast doubts on the validity of the values elicited (Slovic, 1995).
421
We also found, during the pre-test of the questionnaire, several poeple refusing to pay 422
(protesters) because they did not believe it would be technically feasible to restore 423
groundwater quality when pollution sources were so many and spread over so large an area.
424
To strengthen the credibility of our scenario, and to reduce the rate of protest bids, we had to 425
provide some technical description of the actions that would actually be undertaken to reach 426
the environmental objectives. Although we tried to minimise this information and to 427
emphasise the benefits that would be derived from the scenario, there is a risk that some of the 428
respondents may have evaluated their WTP with reference to what they thought the cost 429
would be, instead of truly evaluating scenarios in terms of increased utility. We believe this 430
risk is inherent to groundwater valuation: since respondents are not aware of how an aquifer 431
functions, they need to receive information not only on the resource and the services it 432
provides, but also on the technical actions that will be implemented to improve its quality.
433 434
4.3. From WTP to aggregated benefits 435
Once WTP has been estimated, another challenge of CBA lies in aggregating WTP at the 436
regional level. This involves identifying the population affected by the protection of the 437
specific aquifer under study. One approach suggested by Bateman consists of using distance 438
decay functions, which are estimated econometrically by adding distance as one explanatory 439
variable in the econometric model (Bateman, Day, Georgiou & Lake, 2006). While this 440
approach is appealing for surface waters, which are often used for recreational purposes, it is 441
not clear whether it applies to groundwater or not. In the case study presented in this paper, 442
7Economists generally assume that CV survey respondents have pre-existing preferences for the environmental good under study, based on the level of satisfaction or utility it provides. Some authors however argue that people's preferences are sometimes constructed in the process of elicitation. This might be the case when
for instance, we did not find any significant difference in WTP between respondents located 443
above the aquifer and others. This result is consistent with the observation that most 444
respondents justify their WTP decision by a concern for future generations. The question then 445
becomes how to identify the population that may be affected by the protection of the aquifer?
446
The problem was easily solved in our case study owing to the very specific geographical 447
configuration in which the aquifer occupies more than half of the region’s area and is 448
surrounded by mountains that also delineate the region’s boundaries8. Assuming that the 449
entire regional population is concerned was a reasonable assumption. But what should be 450
done in other contexts where the boundaries of the aquifer do not correspond to any relevant 451
territory from a political, cultural or economic perspective? Again, improving the accuracy of 452
WTP estimates is of limited use if their aggregation remains highly uncertain.
453
Another caveat of cost-benefit analysis that should be acknowledged is that, when dealing 454
with groundwater-management issues, we generally do not properly consider time effects.
455
Even where hydrodynamic groundwater models are available, there is often great uncertainty 456
concerning the time-lag between the moment when remediation measures are implemented 457
(and costs paid) and the date at which benefits will fully appear. Even with a low discount rate 458
(typically 2 to 4% for groundwater, depending on the country), an error of 5 to 10 years can 459
totally change the results of the analysis.
460
4.4. Conclusion 461
A major innovation of the European Water Framework Directive (2000/60/EC) (WFD) is to 462
explicitly recognise that economics should play a key role in the development of river basin 463
management plan. Although Cost Benefit Analysis is not mentioned in the Directive, some 464
8 We assume that the German population living on the other side of the Rhine (state of Baden Württemberg) does not feel concerned by groundwater protection on the French part of the alluvial valley. Indeed, hydrogeologists tell us that pollution occurring in one country will generally not impact the other one, the Rhine river acting as a hydraulic barrier (a few exceptions reporter though). Whether German citizen perceive things like this should
experts are suggesting using it to support the definition of water quality objectives (Brouwer, 465
2008). They suggest that CBA could be used to justify derogation under article 4 if it can be 466
proven that the costs of implementing the WFD outweigh the benefits of reaching good 467
ecological status. By extension, the same argue that CBA could be used to set groundwater 468
quality objectives, under the general rules set by the Groundwater Directive (2006/118/EC).
469
For all the reasons advocated in the discussion above, and based on the case study presented 470
in this paper, we argue here that the use of CBA is inappropriate to justify derogations as part 471
of the Water Framework Directive under present conditions. Additional research needs to be 472
conducted to ensure that non-use benefits can actually be captured by stated preference 473
methodologies when considering large-scale aquifers in the European context. Also, given 474
that primary studies are not feasible in each specific case study, significant efforts must be 475
devoted to the production of a set of CV studies representative of European groundwater 476
situations. These studies should be produced with a uniform methodology, in order to 477
facilitate benefit transfers in the longer term. Additional research is also needed on the 478
engineering side of the analysis.
479
CBA nonetheless provides a very relevant framework for incorporating in a single coherent 480
picture complex environmental, engineering and economic information related to 481
groundwater contamination, pollution sources, measures that need to be implemented and 482
economic consequences. Many CBA analysts agree that, while this evaluation technique helps 483
organizing and structuring the arguments that support social decision making processes, it 484
does not replace them (see case studies reported in Brouwer & Pearce, 2005). It also helps 485
confronting and integrating the visions of the different parties concerned. And it can be used 486
as a tool for communicating the rationale behind decisions to various stakeholders. Provided 487
that values used are scientifically sound.
488 489
Acknowledgements: The research presented in this paper was part of the EU funded project 490
Background cRiteria for the IDentification of Groundwater thresholds (BRIDGE), Contract n°
491
SSPI-2004-006538. We would like to thank Alain Saada (Brgm) for identifying and 492
characterising groundwater remediation measures. Roy Brouwer and Sebastiaan Hess (IVM, 493
Free University of Amsterdam) for the support they provided in drafting and testing the 494
contingent valuation questionnaire. We also acknowledge the contribution from Hélène 495
Bouscasse and Mathieu Rouzère (students) and the technical support provided by Agence de 496
l’Eau Rhin Meuse (Sophie Nicolaï and Jean-Luc Salleron).
497
REFERENCES
Abdalla, C. W., 1994 - Groundwater values from avoidance cost studies : implication for 498
policy and future research, American Journal of Agricultural Economics, 76, pp.
499
Bateman, I. J., Day, B. H., Georgiou, S. and Lake, I., 2006 - The aggregation of 500
environmental benefit values: Welfare measures, distance decay and total WTP, Ecological 501
Economics, 60, pp. 450-460Bergstrom, J.C., Boyle, K.J., Job, C.A., Jo Kealy, M., 1996.
502
Assessing the economic benefits of ground water for environmental policy decisions. Journal 503
of the American Water Resources Association 32, 279-291.
504
Brouwer, R (2008) The potential role of stated preference methods in the Water Framework 505
Directive to assess disproportionate costs. Journal of Environmental Planning and 506
Management, 51(5): 597-614 507
Brouwer, R. and Pearce, D. (2005). Cost benefit analysis and water resources management.
508
Cheltenham / Northampton, Edward Elgar Publishing.
509
Carson, R.T., Flores, N.E., Meade, N.F., 2001. Contingent Valuation: Controversies and 510
Evidence, Environmental and Resource Economics 19, 173-210.
511
Edwards, S. F., 1988 - Option prices for groundwater protection, Journal of Environmental 512
Economics and Management, 15, pp. 475-487 513
Hardisty, P. E. and Özdemiroglu, E., 2005 - The economics of groundwater remediation and 514
protection, CRC Press, p.
515
Jordan, J. L. and Elnagheeb, A. H., 1993 - Willingness to pay for improvements in drinking 516
water quality, Water Resour. Res., 29, pp. 237-245 517
Kiel, K. and Zabel, J., 2001 - Estimating the Economic Benefits of Cleaning up Superfund 518
Sites : the case of Woburn, Massachussetts, Journal of Real Estate Finance and Economics 22, 519
pp. 163 à 184 520
Lazo, J. K., Schulze, W. D., McClelland, G. H. and Doyle, J. K., 1992 - Can Contingent 521
Valuation Measure Nonuse Values?, American Journal of Agricultural Economics, 74, 522
December 1, 1992, pp. 1126-1132 523
Lienhoop, N. and Messner, F., 2009 - The Economic Value of Allocating Water to Post- 524
Mining Lakes in East Germany, Water Resources Management, 23, 2009/03/01, pp. 965-980 525
Pearce, D., 1998 - Environmental Appraisal and Environmental Policy in the European 526
Union, Environmental and Resource Economics, 11, 1998/04//, pp. 489-501 527
Poe, G. L., Boyle, K. J. and Bergstrom, J. C. (2001). A preliminary analysis of contingent 528
values for ground water quality revisited. The Economic Value of Water Quality. J. C.
529
Bergstrom, K. J. Boyle and G. L. Poe. Cheltenham, U.K., Edward Elgar: 137-162.
530
Press and Söderqvist, T. (1998). On estimating the benefits of groundwater protection : a 531
contingent valuation study in Milan. Regulating chemical accumulation in the environment:
532
the integration of toxicology and economics in environmental policy making. T. Swanson and 533
M. Vighi. Cambridge, Cambridge University Press: 278.
534
Quevauviler, P., 2008 - From the 1996 groundwater action programme to the 2006 535
groundwater directive - what have we done, what have we learnt, what is the way ahead ?, 536
Journal of Environmental Monitoring, 10, pp. 408-421 537
Randal, A., Dezoysa, D. and Yu, S. (2001). Groundwater, surface water and wetland 538
vakuation in Ohio. The economic value of water quality. J. C. Bergstrom, K. J. Boyle and P.
539
G. L. Cheltenham UK, Edward Elgar: 83-99.
540
Rinaudo, J.-D. and Loubier, S. (2005). Cost-benefit analysis of large scale groundwater 541
remediation in France. Cost Benefit Analaysis and Water Resources Management. R.
542
Brouwer and D. Pearce. Cheltenham /Northampton, Edward Elgar Publisher: 290-314 543
Ryan, M., Scott, D.A., Donaldson, C., 2004. Valuing health care using willingness to pay: a 544
comparison of the payment card and dichotomous choice methods. Journal of Health 545
Economics 23, 237-258.
546
Rozan, A., Stengter, A. and Willinger, M., 1997 - Valeur de préservation de la qualité de l'eau 547
souterraine : une comparaison entre usagers et non-usagers, Cahiers d'Economie et Sociologie 548
Rurales, 45, pp. 62-92 549
SharefkinN, M., Shechter, M. and Kneese, A., 1984 - Impacts, costs, and techniques for 550
mitigation of contaminated groundwater: A review, Water Resour. Res., 20, pp. 1771-1783 551
Slovic, P., 1995 - The construction of preference American Psychologist, 50, pp. 364-371.
552
Stenger, A. and Willinger, M., 1998 - Preservation value for groundwater quality in a large 553
aquifer: a contingent valuation study of the Asatian aquifer, Journal of Environmental 554
Management, 53, pp. 177 - 193 555
Tentes, G. and Damigos, D., 2012 - The Lost Value of Groundwater: The Case of Asopos 556
River Basin in Central Greece, Water Resources Management, 26, pp. 147-164 557
Yadav, S. N. and Wall, D. B., 1998 - Benefit-cost analysis of best management practices 558
implemented to control nitrate contamination of groundwater, Water Resour. Res., 34, pp.
559
497-504 560
561
APPENDIX 562
563
Selection of measures and estimation of cost of programme of measures 564
565
A.1. DEFINITION OF MEASURE AND UNIT COST ESTIMATE 566
Two types of measures can be applied to the different pollution sources. Preventive measures 567
aim at reducing new contamination of the aquifer whereas remediation measures aim at 568
removing existing stocks of COV present in soils or groundwater.
569
A.1.1. Remediation measures 570
Remediation measures can apply to large scale industrial sites (abandoned sites or sites in 571
activity) as well as to small sites (car repair workshops for instance). Concerning historical 572
abandoned sites, they consist in (i) conducting risk assessment studies in 100% of the sites, 573
(ii) implementing soil and water sampling, analysis and surveillance (installation of 574
monitoring wells in 50% of the sites) and decontaminating groundwater pollution plumes or 575
contaminated soils located above the aquifer (approximately 20% of the sites are concerned).
576
The type of measure to be implemented in each site was selected considering the extent of soil 577
and water contamination (described in the BASIAS database). The cost was estimated for 578
each site through an extrapolation of real cost data obtained from a limited number of sites in 579
the case study area.
580
We also consider that small scale soil and water contamination occurs in firms in activity but 581
no detailed database allows locating where exactly this happens. The probability of soil and 582
water contamination varies depending on the economic activity. To assess the cost of the 583
programme of measure, we assume, for each branch of activity, the percentage of firms 584
where: (i) a risk assessment study has to be implemented (cost of about €5000), (ii) 585
investigative and surveillance soil and water monitoring has to be implemented (cost ranging 586