HAL Id: hal-01140201
https://hal.archives-ouvertes.fr/hal-01140201
Submitted on 8 Apr 2015
HAL is a multi-disciplinary open access archive for the deposit and dissemination of sci- entific research documents, whether they are pub- lished or not. The documents may come from teaching and research institutions in France or abroad, or from public or private research centers.
L’archive ouverte pluridisciplinaire HAL, est destinée au dépôt et à la diffusion de documents scientifiques de niveau recherche, publiés ou non, émanant des établissements d’enseignement et de recherche français ou étrangers, des laboratoires publics ou privés.
M. Merlin, Thomas Perot, Sandrine Perret, Nathalie Korboulewsky, P. Vallet
To cite this version:
M. Merlin, Thomas Perot, Sandrine Perret, Nathalie Korboulewsky, P. Vallet. Effects of stand compo- sition and tree size on resistance and resilience to drought in sessile oak and Scots pine. Forest Ecology and Management, Elsevier, 2015, 339, pp.22-33. �10.1016/j.foreco.2014.11.032�. �hal-01140201�
1
Effects of stand composition and tree size on resistance and resilience to drought in sessile 1
oak and Scots pine 2
3
Morgane Merlin, Thomas Perot, Sandrine Perret, Nathalie Korboulewsky, Patrick Vallet 4
Irstea, UR EFNO Ecosystèmes Forestiers, Centre de Nogent-sur-Vernisson, F-45290 Nogent- 5
sur-Vernisson, France 6
Corresponding author:
7
Morgane Merlin 8
morgane.merlin@orange.fr 9
Irstea, UR EFNO Ecosystèmes Forestiers, F-45290 Nogent-sur-Vernisson, France 10
2 Abstract
11
The IPCC previsions for the upcoming decades include an increase in frequency and intensity 12
of drought events in several regions worldwide, including Northern Europe. Drought 13
significantly affects forest ecosystems through decreased productivity, increased vulnerability 14
to biotic disturbances and increased subsequent mortality. How forest ecosystems maintain 15
resistance and resilience to drought events are important questions. Our study aimed to assess 16
whether species mixture or an individual tree size within a stand alters a given tree’s 17
resilience and resistance to drought. A retrospective study of tree-ring widths allowed us to 18
calculate resistance, resilience and recovery indices for five recent drought events: 1976, the 19
1990-1992 period, 2003, 2006 and 2010. These drought events were selected based on the 20
SPEI (Standardized Precipitation Evapotranspiration Index) drought index. Our study sample 21
consisted of 108 individual sessile oak (Quercus petraea (Matt.)) or Scots pine (Pinus 22
sylvestris L.) trees sampled in 2012 and 2013 (Orleans forest, central France) in pure and 23
mixed stands, divided into three diameter classes corresponding to three sizes: large, medium 24
and small trees. Scots pine performed better than sessile oak during the 1990-1992 and 2010 25
droughts while the contrary was observed for the 2003 and 2006 droughts. They performed 26
equally in 1976. We suggest that the differing sensitivity of the two species to spring and 27
summer drought explained this result. In our study, stand composition had no effect on 28
resilience or resistance for either species. The size effect in oaks was unclear as small oaks 29
displayed either a better performance or a worse performance than large oaks. Small pines 30
displayed better resistance and resilience than pines of a larger size. This work stressed the 31
importance of taking into account stand composition and trees size as well as soil and climatic 32
conditions for each drought events to achieve a better understanding of the diversity of 33
responses to climatic variations among forest ecosystems.
34
3
Keywords: drought; resistance; resilience; sessile oak; Scots pine; tree size; stand 35
composition.
36
1. Introduction 37
In the recent decades, the long term increase in temperature and changes in precipitation 38
patterns (IPCC, 2013) accompanied by an increase in the frequency and intensity of extreme 39
climatic events such as droughts (Smith, 2011) have been the object of several studies. The 40
events are major disturbances, both ecologically and socially. The intense 1976 and 2003 41
droughts in Europe marked people’s minds, and foresters were no exception. They were the 42
first to witness forest decline and tree mortality following these droughts. The ability of forest 43
ecosystems to face such climate changes and extreme events has become a major question for 44
the scientific community. There is a large number of studies addressing this question (Bréda et 45
al., 2006; Allen et al., 2010; Lloret et al., 2012). At the ecosystem level, the composition 46
(Smith, 2011; Cavin et al., 2013), structure and distribution of forests as well as the water, 47
carbon and nutrient cycles are expected to be modified in the context of climate change (Bréda 48
et al., 2006; Galiano et al., 2011; Cheaib et al., 2012). Impacts on tree growth and wood 49
production are becoming significant with increasing forest decline and mortality in some parts 50
of Europe, especially in Mediterranean environments (Martinez-Vilalta and Piñol, 2002;
51
Vacchiano et al., 2012; Vilà-Cabrera et al., 2013).
52
To assess ecosystem stability or species response, three basic aspects can be considered:
53
resistance, recovery and resilience (Grimm and Wissel, 1997). Resistance is the capacity of an 54
ecosystem, species or individual to remain basically unchanged when it is subjected to a 55
disturbance. Recovery is the capacity to regain growth or any other characteristic negatively 56
affected after a disturbance. Resilience is the ability to recover pre-disturbance structures and 57
functions after a disturbance. In the perspective of climate change, these three aspects are 58
4
essential to conserving ecosystems and their functions, or at a smaller scale, species and even 59
individuals.
60
Ecosystems involve several levels of complexity and diversity. Many studies have examined 61
the benefits of mixed forests (Forrester et al., 2006; Kelty, 2006). Interest in mixed stands is 62
inspired by observations of increased biodiversity in the ecosystem (Felton et al., 2010), 63
better resistance to some biotic disturbances (Jactel and Brockerhoff, 2007; Perot et al., 2013) 64
and an increase in productivity in most cases when compared to monoculture stands (Knoke 65
et al., 2008; Vallet and Perot, 2011). Despite an increasing number of studies relative to 66
mixed stands, we still know little about their functioning compared with pure stands. Niche 67
complementarity, which enables a better use of the available resources – including water, is a 68
common hypothesis to explain increased productivity in mixtures (Lebourgeois et al., 2013).
69
Therefore, studying the potential consequences of climate change – induced modifications in 70
water availability on mixed and monoculture stands is crucial. Two hypotheses could be made 71
for the response of mixed stands to drought. Firstly, mixed stands could improve individual 72
tree species’ performance during drought; a species might be mixed with another species 73
which does not occupy the same water reserves. This would lead to a release of intraspecific 74
competition combined with the possibility of facilitation alleviating drought stress through a 75
partitioning of the water reserves between the species (Lebourgeois et al., 2013; Pretzsch et 76
al., 2013). The involved species would be expected to benefit from this interaction. Secondly 77
and reversely, mixed stands could decrease individual species’ performance during drought as 78
it has been observed depending on the tree species and soil conditions. This would result in an 79
increased interspecific competition during drought stress (Jucker et al., 2014). The involved 80
species or the least competitive species would then suffer from mixing during water shortage 81
periods, affecting tree growth and functions such as photosynthesis, transpiration or sap flow 82
(Grossiord et al., 2014).
83
5
Another level of complexity in forest ecosystems lies in the existence of varying individual 84
tree size within a stand. The majority of studies conducted on the impact of drought on forest 85
stands focus on dominant trees, i.e. the largest in diameter with generally more developed 86
crowns and root systems. It is possible to hierarchically organize the trees in an even-aged 87
stand according to their diameter, reflecting differences between individual tree functional 88
statutes within an even-aged stand (Dhôte, 1994). This hierarchy implies a differential 89
availability of resources such as water (Dawson, 1996), nutrients and light (Dhôte, 1994). It 90
also affects the intensity of competition between individuals. Population hierarchy can 91
consequently play an important role in an individual’s responses to climatic and biological 92
disturbances (Pichler and Oberhuber, 2007; Martín-Benito et al., 2008; Mérian and 93
Lebourgeois, 2011; Zang et al., 2012). It is important to incorporate both stand composition 94
(pure or mixed stands) and individual tree size in the stand as explanatory variables when 95
studying tree species response to abiotic disturbances such as drought in order to assess the 96
risks associated with climate change and to propose adapted forest management strategies.
97
We studied the effects of tree size and stand composition on resistance and resilience to 98
drought in terms of radial growth for two species: a deciduous broadleaved species; sessile 99
oak (Quercus petraea Matt.) and a conifer needled species; Scots pine (Pinus sylvestris L.).
100
These two tree species have very different characteristics, suggesting they may have different 101
responses to drought (Bréda et al., 2006; Eilmann et al., 2006; Bréda and Badeau, 2008;
102
Michelot et al., 2012a), and are widespread throughout European forests in both pure and 103
mixed stands. Sessile oak is a mesophilic species with a deep root system which prefers semi- 104
shady environments well adapted to occasional droughts. During periods of water deficit, leaf 105
water potential is reduced, potentially leading to xylem cavitation. The large vessels in oak 106
earlywood are very sensitive to winter embolism (Tyree and Cochard, 1996) and water 107
circulation must be restored each spring by the formation of at least one new tangential row of 108
6
large vessels. Sessile oak is common in Western Europe and is the most widespread species 109
in French forests (National Forest Inventory data). Scots pine is a light-demanding evergreen 110
species. Its root system is more superficial than most broadleaved species but it does develop 111
a strong first pivot and lateral roots. Water potential in the needles is maintained above a 112
threshold level thanks to stomatal closure during periods of water deficit which minimizes the 113
risk of xylem cavitation. Scots pine can stop its radial growth entirely when conditions are too 114
harsh possibly leading to missing tree rings. Its drought tolerance as defined by Niinemets and 115
Valladares (2006) is slightly higher than sessile oak. It is widely distributed throughout 116
temperate and boreal Europe and is common in French forests and around the Mediterranean 117
basin. Both species are present in pure or mixed stands at our study site in the Orléans National 118
Forest in central France.
119
Radial growth is sensitive to biotic and abiotic disturbances (Lebourgeois et al., 2010; Olivar 120
et al., 2012; Wiley et al., 2013; Palacio et al., 2014). It can be used for past climatic 121
reconstructions or for retrospective analysis of tree performance during past known 122
disturbances (Speer, 2010). We thus used radial growth to evaluate how individual trees 123
responded to past climatic severe events such as drought using indices of resistance, recovery 124
and resilience. We selected five drought events between 1970 and 2013 based on the SPEI 125
(Standardized Precipitation Evapotranspiration Index), a drought index defined by Vicente- 126
Serrano et al. (2010). We sought to answer the following three questions:
127
1. Do sessile oak and Scots pine respond differently to past drought events?
128
2. Does stand composition (mixed stand versus pure stand) improve or deteriorate 129
individual tree’s radial growth during drought events?
130
3. Does tree status represented by tree size affect individual tree’s response to drought?
131
2. Material and methods 132
7 2.1. Study site and species
133
For simplification, it is reasonable to partitionate this continuum of tree diameter.Three 134
classes of tree size can thus be distinguished based on diameter: large trees, medium trees and 135
small trees, excluding understorey trees. The study site is located in the center of France, in 136
the Orléans National Forest (France, 48°00′N, 2°09′ E) which extends over 35,000 hectares and 137
is managed by the National Forest Office. Elevation ranges from 107 m to 174 m a.s l.
138
Throughout the forest the soil is relatively poor and acidic with a sandy clay-loam texture 139
(Table 1Erreur ! Source du renvoi introuvable.), and is classified as a planosol (IUSS Working 140
Group, 2014). Superimposed layers of clay and sand lead to a temporary perched water table 141
in winter, but the low soil water storage capacity reduces available water for plants in 142
summer. The area has a temperate continental climate with an oceanic influence (mean 143
minimum temperature of 0.7 °C in February; mean maximum temperature of 25 °C in July).
144
The mean annual rainfall is 740 mm (1969 to 2013 data from the weather station at Nogent- 145
sur-Vernisson, France).
146
The species studied were sessile oak Quercus petraea (Matt.) and Scots pine Pinus sylvestris 147
L., managed in pure or mixed stands.
148
Table 1. Physico-chemical characteristics of the forest site soil (at 20-40 cm in depth, mean, 149
standard deviation (s.d.), n=30). Cation exchange capacity (CEC) is given in milli-equivalents 150
of hydrogen per 100 g (meq/100g).
151
Clay Fine silt
Coarse silt
Fine sand
Coarse
sand C N C/N pH-
KCl CEC
(%) (%) (%) (%) (%) (%) (%) (meq/100g)
Mean 8.6 11.8 7.9 14.3 55.8 0.92 0.046 19.6 4.43 4.21 (s.d.) (2.4) (2.8) (2.3) (2.2) (7.5) (0.25) (0.010) (2.9) (0.16) (2.58)
2.2. Sampling design 152
8
Nine plots were selected on three sites in even-aged stands (50 – 80 years old) as part of the 153
Oak Pine Tree Mixture Experiment (OPTMix) (Korboulewsky et al., 2013). Each site has one 154
plot of pure sessile oak, one plot of pure Scots pine and one plot with a mixture of the two 155
species. All plots have similar soil conditions, floral compositions, tree age, sylvicultural 156
treatments and diameter distributions (Table 2). For each plot, a 1.5-2 ha area was delimited 157
and the position of each tree was mapped before the individual tree selection process. Nine 158
trees per species and per plot were chosen according to a stratified sampling design with 159
constraints. We studied the following two factors:
160
- The local composition or mixing rate: the mixing rate in the local environment (a 10m- 161
radius circle around each selected tree) was calculated as a percentage of the partial 162
Relative Density Index, or RDI (Reineke, 1933). The calibration for both species of the 163
self-thinning boundaries needed for the RDI calculation followed Charru et al. (2012) 164
based on data from the National Forest Inventory for the northern half of France. In pure 165
stands, the RDI proportion of the target species was 100%. In mixed stands, the RDI of 166
the companion species was set between 40 and 80% to ensure that the sampled trees from 167
pure and mixed stands had contrasted mixing rates.
168
- Tree size: this reflects the hierarchy in tree diameter between individual trees, related to 169
the social status within the stand. We distinguished three tree size classes in our study:
170
small trees, medium trees and large trees. Based on 2012 or 2013 tree diameters, the trees 171
at each site were assigned to one of these classes. Understorey trees were excluded. For 172
the selection process, we defined four quantiles from the diameter distribution for each 173
species: 28% quantile, 38% quantile, 61% quantile and 71% quantile to obtain three 174
intervals clearly separated. Small trees of a given species were sampled in the interval 175
[minimum diameter; 28% quantile], medium trees were sampled in the interval [38%
176
quantile; 61% quantile] and large trees were sampled in the interval [71% quantile;
177
9
maximum diameter]. However, individual tree-level dynamics may have changed during 178
the growing process due to modifications in the local environment or to genetics, and tree 179
size may also have changed. To refine the influence of the hierarchy on the individuals’
180
responses to each drought event, we redefined the tree size classes for each drought event 181
studied here (see section 2.4 for the selection of the drought events) based on three 182
relative diameter classes (smallest, intermediate, largest) reconstructed from tree ring 183
analyses.
184
The local density was estimated using the RDI. It was set between 0.5 and 0.75 to ensure 185
similar competition conditions among sample trees. We visually checked the general form of 186
the candidate trees to ensure that the selected trees were representative of the stand 187
population.
188
The final sample consisted of 108 trees from the two species, the two stand composition types 189
(pure or mixed) and the three tree size classes; three tree replicates per plot were included 190
(Table 2). In autumn 2012 and 2013, the selected trees were felled and a 10cm thick cross 191
section was cut 1.30m above the ground, or as close as possible to this level when defects 192
(branches, damage or sap pockets) were present.
193
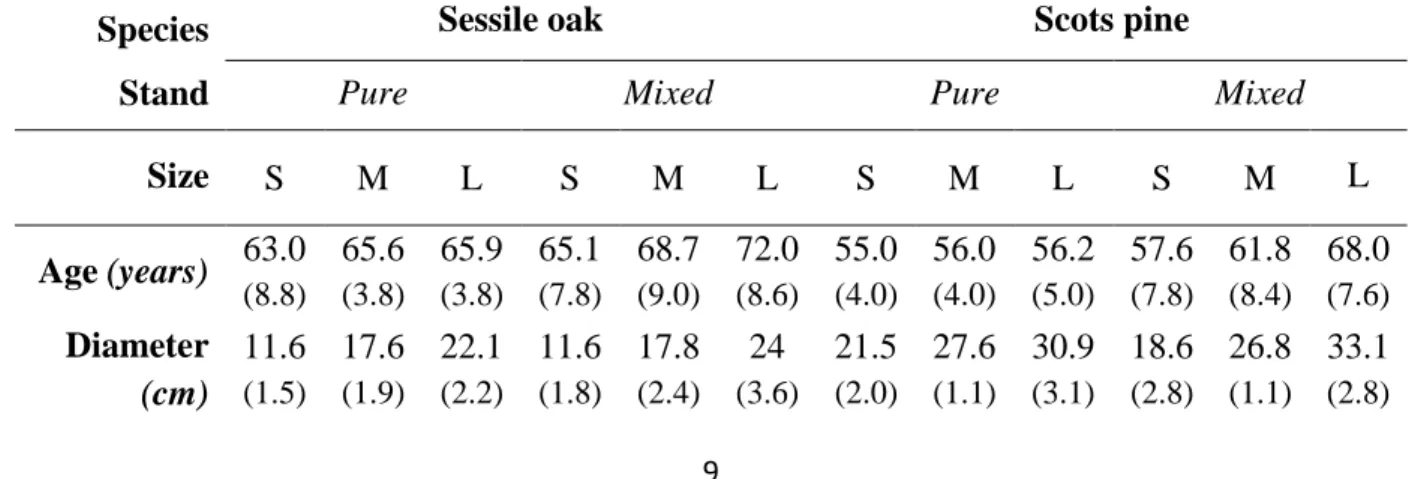
Table 2. Mean age and mean diameter at 1.30m for each species, stand composition type and 194
tree size class. Age and diameter standard deviation are indicated in parentheses. Nine trees 195
were sampled for each species, stand composition and size. S: small ; M: medium ; L: large.
196
Species Sessile oak Scots pine
Stand Pure Mixed Pure Mixed
Size S M L S M L S M L S M L
Age (years) 63.0 (8.8)
65.6 (3.8)
65.9 (3.8)
65.1 (7.8)
68.7 (9.0)
72.0 (8.6)
55.0 (4.0)
56.0 (4.0)
56.2 (5.0)
57.6 (7.8)
61.8 (8.4)
68.0 (7.6) Diameter
(cm)
11.6 (1.5)
17.6 (1.9)
22.1 (2.2)
11.6 (1.8)
17.8 (2.4)
24 (3.6)
21.5 (2.0)
27.6 (1.1)
30.9 (3.1)
18.6 (2.8)
26.8 (1.1)
33.1 (2.8)
10 2.3. Tree-ring analyses
197
We used the WinDendro software (Regent, 2005) to measure tree-ring widths from pith to 198
bark along two radii along a systematic north-south axis. The east-west axis was not used to 199
avoid reaction wood or possible ovalization related to the prevailing east-west winds in this 200
region. A visual crossdating was performed for known reference dates: ‒ the 1976 drought 201
and the Diprion pini attack on pine between 1981 and 1986 (Perot et al., 2013). We used a 202
DigiMicro 2.0 Scale USB camera (Mikroskop Digital Kamera, DNT), an SMZ745 wen 203
(Nikon) and an Eclipse E200 microscope (Nikon) to help us clarify the position of a few tree 204
rings close to the pith. Statistical crossdating was performed with the COFECHA software 205
(Grissino-Mayer, 2001).
206
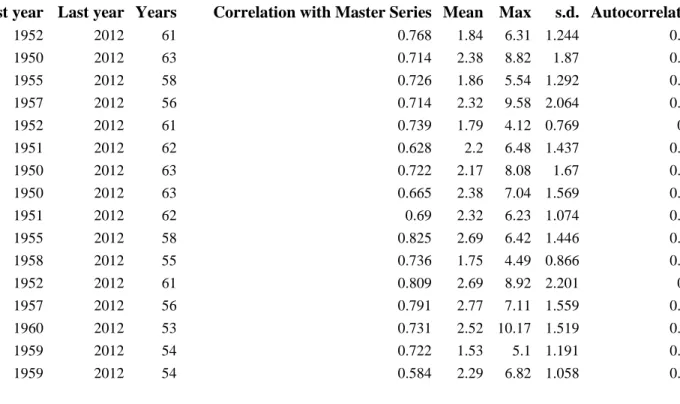
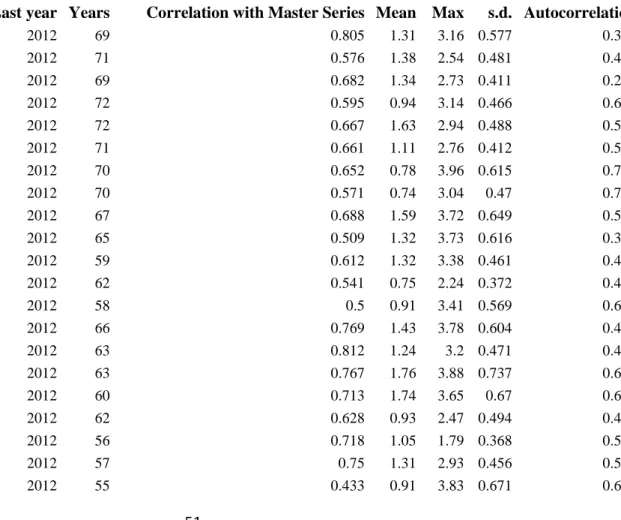
The following statistics from the COFECHA software output (see Appendix B for detailed 207
result for each sampled tree) were used to verify the quality of the tree-ring series (Grissino- 208
Mayer, 2001). Series intercorrelation (SI) is a measure of the strength of the signal common 209
to all the trees sampled. Most chronologies have values between 0.550 and 0.750. In our 210
sample, SI was 0.577 for oak and 0.631 for pine. These values indicate a good common signal 211
among the individuals sampled. The Expressed Population Signal (EPS) ensures that the trees 212
sampled accurately represent a hypothetical population. This is verified when EPS > 0.85 213
(Wigley et al., 1984). This condition was verified in our study with an EPS of 0.96 for sessile 214
oak, and 0.98 for Scots pine.
215
The analysis was restricted to the 1970-2013 period, which corresponds to the extent of the 216
meteorological data available for the study sites. Moreover, tree growth dynamics are usually 217
different during the juvenile stage and the adult and mature stages. The choice of the 1970- 218
2013 period ensured that the sampled trees were not in the juvenile stage ( 219
11
Figure 2). Two radial growth variables were calculated. Ring width (RW) per year was 220
calculated as the average ring width over the two radii along the north-south axis. Tree basal 221
area increment (BAI) was calculated per year as follows:
222
= − × 4
where is tree diameter for year . was calculated from the cumulative ring widths of 223
the tree ring series for each year.
224
2.4. Climatic data and drought index 225
Daily minimum, maximum and average temperature and precipitation for the last 44 years 226
(1969-2013) were collected from the Irstea weather station (France, 47°50′ N, 2°44′ E) located 227
twenty kilometers from the study forest. Drought events were identified based on the SPEI 228
(Standardized Precipitation Evapotranspiration Index) drought index (Vicente-Serrano et al., 229
2010) calculated with the spei CRAN package. This index has the advantage of incorporating 230
the effects of temperature on drought and considering different time scales indicative of the 231
chronic, long-term or exceptional character of each drought event and can be used to estimate 232
changes in the dynamics and/or intensity of drought events over previous decades. Monthly 233
SPEI is a standardized variable (see Vicente-Serrano et al. (2010) for details of the 234
standardization). It is based on the degree of water surplus or deficit, defined as the difference 235
between the monthly precipitation and the monthly Thornthwaite potential evapotranspiration 236
(Thornthwaite, 1948). In this study, the SPEI for each year was calculated for the growing 237
season spanning seven months from April to October. At this time scale, there is a fairly good 238
correlation between the growth variables (RW for oak and BAI for pine, results not shown) 239
and the SPEI values. When SPEI was under the value of -1, the year was considered a severe 240
drought year (Potop et al., 2014). Following this criterion, the selected drought events in our 241
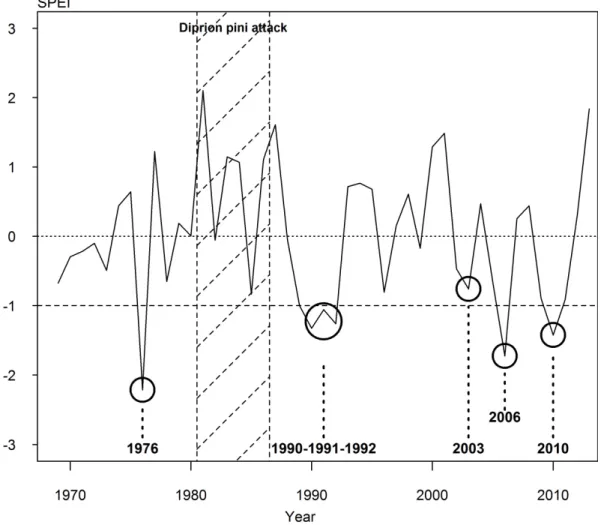
study were: 1976, 2006, 2010 and the period 1990-1991-1992 (Figure 1). We added the year 242
12
2003 since a short but intense summer drought event occurred then that has been largely 243
studied as an important drought event in Europe (Ciais et al., 2005; Pichler and Oberhuber, 244
2007; van der Werf et al., 2007; Lebourgeois et al., 2010). Moreover, the SPEI during the 245
summer months of 2003 was considerably below the threshold of -1, with a value of -2.4.
246
Figure 1. SPEI computed for the growing season (April to October) from 1970 to 2013. The 247
selected drought events are indicated by a bold circle. The horizontal dotted line indicates the 248
threshold of -1 below which a drought was considered severe. The 1981 to 1986 period 249
(hatched zone) was removed from our analysis because of severe pine defoliation by Diprion 250
pini.
251
252
2.5. Resistance, recovery and resilience indices 253
13
We used the resistance, recovery and resilience indices defined by Lloret et al. (2011) to 254
quantify individual tree responses to the drought events we selected. We hypothesized that 255
pre-disturbance period reflect the expected growth missing during the year of the disturbance.
256
To support this hypothesis, the growth variables on which the indices are based must not 257
show any strong temporal trend, so we used RW for sessile oak and BAI for Scots pine ( 258
Figure 2).
259
Figure 2. Raw tree-ring growth series for sessile oak and Scots pine according to tree age.
260
Each tree-ring series is printed in grey. The bold line represents the series mean averaged for 261
all trees. (a) for sessile oak; the growth variable presented is RW, (b) for Scots pine: the 262
growth variable presented is BAI. The vertical dotted line indicates the age in 1976 (oldest 263
drought studied here) of the youngest tree sampled.
264
265
266
14
The absence of strong age-related trends (excluding the juvenile period) on these two growth 267
variables allowed us to calculate the response indices with raw data (non-transformed or 268
standardized data). Since comparing indices based on two different growth variables could be 269
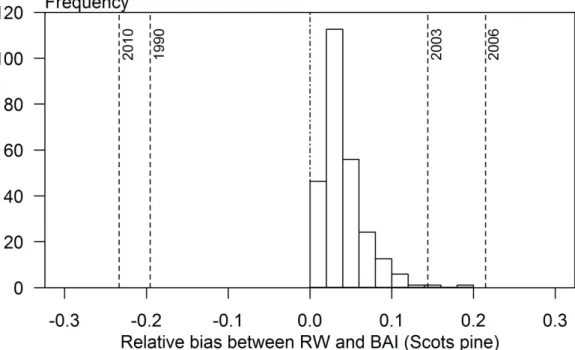
misleading when interpreting the species responses (see section 2.6 for the statistical models), 270
we quantified the error resulting from using BAI for Scots pine for each drought event. We 271
included a multiplying factor to link the index calculated with BAI with the one calculated 272
with RW (see Appendix A for further details):
273
= ×
For the five drought events selected, the relative bias 1 − induced by the use of BAI for 274
Scots pine is much smaller (around 4-9%) than the differences between the oak and pine 275
responses (between 15-36%) for the same drought events (Appendix A, Figure A 1). The use 276
of different growth indices for the two species does not influence the direction of the results 277
obtained for the comparison of the two species (see Appendix A).
278
Growth during pre-and post-disturbance periods ( and ! ) was calculated as the 279
average growth in the 3 years respectively before and after disturbance. There is a trade-off 280
between retaining a long enough period to ensure a good estimation of the mean growth 281
before and after the drought event and the risk of an overlap between the pre- or post- 282
disturbance period and adjacent drought events. Growth during disturbance is the growth 283
observed the year of the drought event (or the average growth over the period of the 284
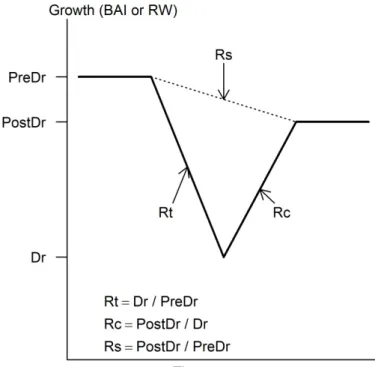
disturbance in the case of a drought spanning several years, i.e. 1990 to 1992). Resistance, 285
recovery and resilience are defined as follows (Figure 3):
286
-
Resistance = / : the individuals’ ability to withstand harsh conditions 287(e.g. drought).
288
15
-
Recovery = ! / : the individuals’ ability to restore a level of growth after 289disturbance relative to the damage during the disturbance.
290
-
Resilience = ! / : the ability of an individual to regain post- 291disturbance growth similar to pre-disturbance growth.
292
Figure 3. Resistance Rt, recovery Rc and resilience Rs indices in a hypothetical case, adapted 293
from Lloret et al. (2011). Resistance (solid line) and resilience (dotted line) correspond to the 294
negative slopes, so the steeper the decline, the lower the resistance and resilience. Recovery 295
(solid line) corresponds to the positive slope.
296
297
The post-disturbance period for 2003 and the pre-disturbance period for 2006 overlap. We 298
therefore decided to use the 2006 post-disturbance period to calculate the 2003 indices and the 299
2003 pre-disturbance period for the 2006 indices. This choice removes the immediate impact 300
on growth of the 2003 drought event on individual tree responses to the 2006 drought. It 301
should also be noted that resilience for the 2010 drought event is incomplete for the trees 302
sampled in 2012 as only two years of data were available after the drought event to calculate 303
the resilience index for these trees.
304
16 2.6. Statistical analyses
305
Our first question on species specific response to drought was tested for each drought event.
306
We used linear mixed models where response indices (transformed with the natural logarithm 307
when necessary to meet the assumptions of normality of the residuals) were dependent 308
variables and species (fixed factor) and plot (random factor) were explanatory variables. The 309
linear mixed model for a given drought event was as follows, with sessile oak as the 310
reference:
311
#$% = & + &#+ ($ + )#$%
where #$% is one of the three indices calculated for a tree * of a species + in plot ,, & is the 312
intercept representing the sessile oak average for the relevant index and year; &# is the plot 313
random effect; ($ is the species effect (i.e. the difference for the relevant index and year 314
between Scots pine and the reference – sessile oak) and )#$% are the residuals of the model.
315
For each drought event, the species effect was removed in the model if it was found to be not 316
significant.
317
We also used linear mixed models to answer our second and third questions on stand 318
composition and tree size effects on individual’s performance during drought events for each 319
species and each drought event. The dependent variables were the indices of response to 320
drought (log-transformed when necessary). The explanatory variables were stand composition 321
(mixed or pure, fixed effect), tree size (large, medium and small, fixed effect) and plot 322
(random effect). The full linear mixed model used to test the effects of composition and tree 323
size for a given drought event and one species was as follows, with large trees growing in 324
pure stands as the reference:
325
#$%- = & + &#+ .$+ /%+ ./$%+ )#$%-
17
where #$%- is one of the three indices calculated for a tree 0 belonging to a size * in 326
composition + for the plot ,, & is the intercept representing the reference (large trees growing 327
in pure stands) average for the relevant index and year; &# is the plot random effect; . is the 328
composition effect (i.e. the difference between the reference – pure – and mixed stands); / 329
corresponds to the tree size parameter (i.e. the difference between the reference – large – and 330
each of the other two size classes); ./ is the interaction between composition and size; and 331
)#$%- are the residuals of the model. For each model, variables which were found to be not 332
significant were removed to improve the estimations of the significant variables. The 333
interaction parameter ./ was consequently removed from all models as it was never 334
significant. All statistical analyses were performed with the nlme package of the R statistical 335
software (R Development Core Team, 2014). The significance threshold was set at 0.05.
336
3. Results 337
Growth decreased during the drought events for both sessile oak and Scots pine as resistance 338
values were less than 1 in average (Table 3). Mean index values showed relatively high levels 339
of resistance to drought and resilience for both species (Table 3).
340
Table 3. Mean values (and standard deviation s.d.) of the resistance, recovery and resilience 341
indices. Mean values are calculated for each species over the five selected drought events.
342
Resistance Rt Recovery Rc Resilience Rs
Oak Pine Oak Pine Oak Pine
Mean 0.759 0.787 1.361 1.366 0.994 0.985
s.d. 0.218 0.274 0.606 0.765 0.434 0.457
3.1. Comparison between the two species’ response to drought events 343
The species effect was significant for some drought events, and differs depending on the 344
index. Pine was more resistant than oak for 1990-1992 and 2010 droughts and more resilient 345
18
for the 1990-1992 drought only. Oak was more resistant for the 2003 and 2006 droughts, 346
recovered better after the 2010 drought (Table 4Erreur ! Source du renvoi introuvable.).
347
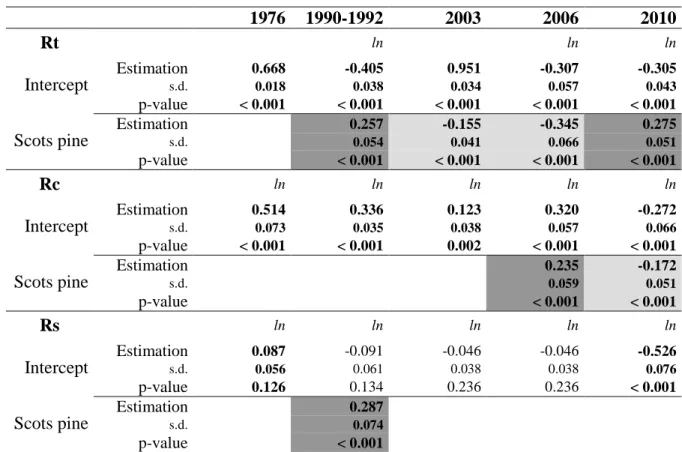
Table 4. Results from the linear mixed models for species effect on resistance Rt, recovery Rc 348
and resilience Rs indices for the five selected drought events. For each model, when the 349
“species” variable was not significant, we chose to remove it completely. Parameters are 350
estimated with sessile oak as the reference. ln below a drought event indicates that logarithm 351
transformation of the response variable was used to fit the model. The estimates and standard 352
deviations (s.d.) were not back transformed when the logarithm was applied. Significant 353
results are shown in bold characters. Shading indicates the direction of the difference between 354
Scots pine and the reference, i.e. sessile oak; dark grey: positive difference; light grey:
355
negative difference.
356
1976 1990-1992 2003 2006 2010
Rt ln ln ln
Intercept
Estimation 0.668 -0.405 0.951 -0.307 -0.305
s.d. 0.018 0.038 0.034 0.057 0.043
p-value < 0.001 < 0.001 < 0.001 < 0.001 < 0.001
Scots pine
Estimation 0.257 -0.155 -0.345 0.275
s.d. 0.054 0.041 0.066 0.051
p-value < 0.001 < 0.001 < 0.001 < 0.001
Rc ln ln ln ln ln
Intercept
Estimation 0.514 0.336 0.123 0.320 -0.272
s.d. 0.073 0.035 0.038 0.057 0.066
p-value < 0.001 < 0.001 0.002 < 0.001 < 0.001
Scots pine
Estimation 0.235 -0.172
s.d. 0.059 0.051
p-value < 0.001 < 0.001
Rs ln ln ln ln ln
Intercept
Estimation 0.087 -0.091 -0.046 -0.046 -0.526
s.d. 0.056 0.061 0.038 0.038 0.076
p-value 0.126 0.134 0.236 0.236 < 0.001
Scots pine
Estimation 0.287
s.d. 0.074
p-value < 0.001
357
19
3.2. Effects of stand composition on species responses to drought events 358
The effect of stand composition (pure or mixed stands) on sessile oak or Scots pine responses 359
was never significant for the selected drought events and was thus removed from all models 360
(Table 5,
361
20
Table 6. Results from the linear mixed models for stand composition and tree size effects on 362
resistance Rt, recovery Rc and resilience Rs indices of Scots pine for the five selected drought 363
events. Parameters are estimated with pure stands and large trees as the references. ln below a 364
drought event indicates that logarithm transformation of the response variable was used to fit 365
the model. Estimates and standard deviations (s.d.) were not back transformed when the 366
logarithm was applied. Significant results are shown in bold characters. Shading indicates the 367
direction of the difference between each factor level and the references, i.e. large trees and 368
pure stands; dark grey: positive difference; light grey: negative difference.
369
).
370
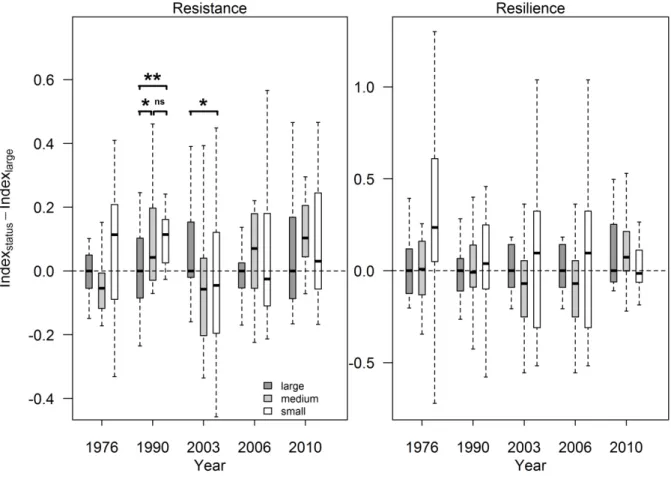
3.3. Effects of tree size on species responses to drought events 371
3.3.1. Sessile oak 372
The effect of the tree size on the sessile oak response to drought was variable depending on 373
the year and the index considered. In 2003, 2006 and 2010, small trees showed significantly 374
lower resistance (2003) or recovery (2006, 2010) than did large trees. The opposite result was 375
found for resistance for the 1990-1992 drought event (Table 5, 376
Figure 4). There was no effect of tree size on sessile oak resilience for any of the five drought 377
events considered.
378
3.3.2. Scots pine 379
Several significant results were found. The general trend for Scots pine indicates better 380
resistance and resilience among small individuals than among large individuals ( 381
21
Table 6. Results from the linear mixed models for stand composition and tree size effects on 382
resistance Rt, recovery Rc and resilience Rs indices of Scots pine for the five selected drought 383
events. Parameters are estimated with pure stands and large trees as the references. ln below a 384
drought event indicates that logarithm transformation of the response variable was used to fit 385
the model. Estimates and standard deviations (s.d.) were not back transformed when the 386
logarithm was applied. Significant results are shown in bold characters. Shading indicates the 387
direction of the difference between each factor level and the references, i.e. large trees and 388
pure stands; dark grey: positive difference; light grey: negative difference.
389
, Figure 5). There were no significant effects of stand composition or tree size for some 390
indices and drought events (
391
22
Table 6. Results from the linear mixed models for stand composition and tree size effects on 392
resistance Rt, recovery Rc and resilience Rs indices of Scots pine for the five selected drought 393
events. Parameters are estimated with pure stands and large trees as the references. ln below a 394
drought event indicates that logarithm transformation of the response variable was used to fit 395
the model. Estimates and standard deviations (s.d.) were not back transformed when the 396
logarithm was applied. Significant results are shown in bold characters. Shading indicates the 397
direction of the difference between each factor level and the references, i.e. large trees and 398
pure stands; dark grey: positive difference; light grey: negative difference.
399
).
400
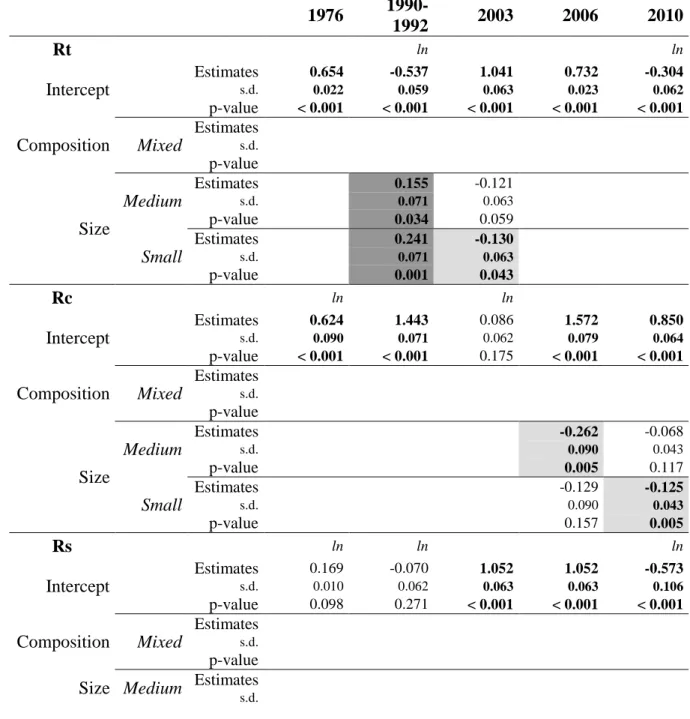
23
Table 5. Results from the linear mixed models for stand composition and tree size effects on 401
resistance Rt, recovery Rc and resilience Rs indices of sessile oak for the five selected 402
drought events. Parameters are estimated with pure stands and large trees as the references. ln 403
below a drought event indicates that logarithm transformation of the response variable was 404
used to fit the model. Estimates and standard deviations (s.d.) were not back transformed 405
when the logarithm was applied. Significant results are shown in bold characters. Shading 406
indicates the direction of the difference between each factor level and the references, i.e. large 407
trees and pure stands; dark grey: positive difference; light grey: negative difference.
408
1976 1990-
1992 2003 2006 2010
Rt ln ln
Intercept
Estimates 0.654 -0.537 1.041 0.732 -0.304
s.d. 0.022 0.059 0.063 0.023 0.062
p-value < 0.001 < 0.001 < 0.001 < 0.001 < 0.001
Composition Mixed
Estimates
s.d.
p-value
Size
Medium
Estimates 0.155 -0.121
s.d. 0.071 0.063
p-value 0.034 0.059
Small
Estimates 0.241 -0.130
s.d. 0.071 0.063
p-value 0.001 0.043
Rc ln ln
Intercept
Estimates 0.624 1.443 0.086 1.572 0.850
s.d. 0.090 0.071 0.062 0.079 0.064
p-value < 0.001 < 0.001 0.175 < 0.001 < 0.001
Composition Mixed
Estimates
s.d.
p-value
Size
Medium
Estimates -0.262 -0.068
s.d. 0.090 0.043
p-value 0.005 0.117
Small
Estimates -0.129 -0.125
s.d. 0.090 0.043
p-value 0.157 0.005
Rs ln ln ln
Intercept
Estimates 0.169 -0.070 1.052 1.052 -0.573
s.d. 0.010 0.062 0.063 0.063 0.106
p-value 0.098 0.271 < 0.001 < 0.001 < 0.001
Composition Mixed
Estimates
s.d.
p-value Size Medium Estimates
s.d.
24 p-value
Small
Estimates
s.d.
p-value 409
25
Table 6. Results from the linear mixed models for stand composition and tree size effects on 410
resistance Rt, recovery Rc and resilience Rs indices of Scots pine for the five selected drought 411
events. Parameters are estimated with pure stands and large trees as the references. ln below a 412
drought event indicates that logarithm transformation of the response variable was used to fit 413
the model. Estimates and standard deviations (s.d.) were not back transformed when the 414
logarithm was applied. Significant results are shown in bold characters. Shading indicates the 415
direction of the difference between each factor level and the references, i.e. large trees and 416
pure stands; dark grey: positive difference; light grey: negative difference.
417
1976 1990-
1992 2003 2006 2010
Rt ln ln
Intercept
Estimates 0.607 -0.148 0.790 0.481 -0.029
s.d. 0.045 0.058 0.022 0.059 0.032
p-value < 0.001 0.014 < 0.001 < 0.001 0.367
Composition Mixed
Estimates
s.d.
p-value
Size
Medium
Estimates 0.088 0.105
s.d. 0.052 0.065
p-value 0.095 0.112
Small
Estimates 0.128 0.137
s.d. 0.052 0.065
p-value 0.017 0.041
Rc ln ln ln
Intercept
Estimates 0.425 0.334 1.220 1.801 -0.450
s.d. 0.085 0.044 0.058 0.126 0.091
p-value < 0.001 < 0.001 < 0.001 <0.001 < 0.001
Composition Mixed
Estimates
s.d.
p-value
Size
Medium
Estimates
s.d.
p-value
Small
Estimates
s.d.
p-value
Rs ln ln ln ln ln
Intercept
Estimates -0.220 0.186 -0.288 -0.253 -0.479
s.d. 0.070 0.092 0.080 0.081 0.100
p-value 0.003 0.049 0.001 0.003 < 0.001
Composition Mixed
Estimates
s.d.
p-value
26 Size
Medium
Estimates 0.323 0.219 0.149
s.d. 0.089 0.113 0.115
p-value < 0.001 0.059 0.203
Small
Estimates 0.337 0.310 0.275
s.d. 0.089 0.113 0.115
p-value < 0.001 0.009 0.021
418
Figure 4. Difference between the resistance or resilience index value for large sessile oak trees 419
and the values for the other tree size classes for each drought event. For each year and tree 420
size, the segments and stars indicate the level of significance of the difference between large 421
Scots pine trees and other trees from the models. The models were re-run with the medium 422
size as the reference to test the difference between this size and the small size. *: p < 0.05; **:
423
p < 0.01; ***: p < 0.001.; ns: not significant.
424
425
Figure 5. Difference between the resistance or resilience index value for large Scots pine trees 426
and the values for the other tree size classes for each drought event. For each year and tree 427
27
size, the segments and stars indicate the level of significance of the difference between large 428
Scots pine trees and other trees from the models. The models were re-run with the medium 429
size as the reference to test the difference between this size and the small size. *: p < 0.05; **:
430
p < 0.01; ***: p < 0.001.; ns: not significant.
431
432
4. Discussion 433
As expected, both species reduced their radial growth during drought events. When drought 434
occurs, photosynthesis is reduced leading to less carbon available for functions such as radial 435
growth which in turn decreases (Chaves et al., 2003; Palacio et al., 2014).
436
Resistance and resilience to drought differed between oak and pine, as expected (Table 4), 437
though the mean values for each species were close to each other (Table 3). Stand 438
composition had no effect on the resistance indices of the species studied (Table 5, Table 6).
439
However, tree size did have an effect in some cases. The influence of tree size was 440
28
pronounced and unidirectional for resistance and resilience in Scots pine for several drought 441
events. Results for sessile oak show that the size effect varied between drought events or 442
indices.
443
4.1. Oak and pine respond differently to drought events 444
We first showed that sessile oak and Scots pine responded differently to the five drought 445
events studied. Pine was more resistant during the 1990-1992 drought period and the 2010 446
drought while oak was more resistant during the 2003 and 2006 droughts. The drought events 447
studied here occurred at different periods during the growing season and this could have 448
influenced the responses of the two species. Indeed, several studies have shown that pine and 449
oak species have different growth dynamics during the growing season (Weber et al., 2007;
450
Eilmann et al., 2009; Michelot et al., 2012b). Complementary analyses of the SPEI over the 451
spring (March to May) and summer months (June to August) separately revealed different 452
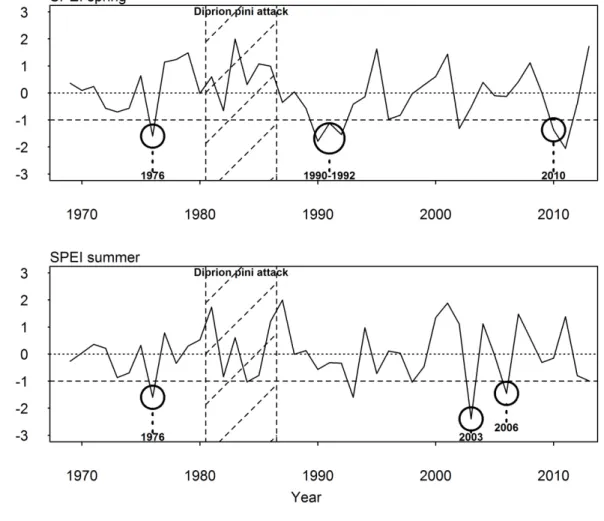
types of drought (Figure 6).
453
29
Figure 6. SPEI computed for spring (April to June) and for summer (July to August) from 454
1970 to 2013. The selected drought events are indicated by a bold circle. The horizontal 455
dotted line indicates the threshold of -1 below which a drought was considered severe. The 456
1981 to 1986 period (hatched zone) was removed from our analysis because of severe pine 457
defoliation by Diprion pini.
458
459
The 1976 drought was global throughout the whole growing season. The 1990-1992 and 2010 460
droughts occurred in the spring while the 2003 and 2006 droughts were intense summer 461
droughts. Our results suggest that Scots pine was more resistant during spring droughts than 462
sessile oak, and that sessile oak was more resistant during summer droughts (Table 4). The 463
1976 drought, which lasted through spring and summer, should have affected both species;
464
our results confirm this (we found no difference between the two species for any index, Table 465
4Erreur ! Source du renvoi introuvable.). Their differing growth dynamics, particularly 466
30
how the two species form intra-annual wood, could explain this time-dependent resistance.
467
Zweifel et al. (2006) showed that pubescent oak (Quercus pubescens) starts radial growth 468
about one month before leaf expansion, achieving almost half of the annual radial increment 469
by the time the leaves reach full expansion at the end of spring. Furthermore, oak species have 470
been found to be more sensitive to spring conditions, and particularly to water availability 471
during spring, than to summer conditions and droughts (van der Werf et al., 2007; Weber et 472
al., 2007; Eilmann et al., 2009; Zang et al., 2012; Morán-López et al., 2014). Earlywood vessels 473
in oak are formed before and during budburst using stored reserves from the previous growing 474
season (Corcuera et al., 2004). These newly formed vessels are wide allowing such ring- 475
porous species to transport more water during early growing season but at the expense of 476
increased embolism risk.They rapidly become embolized as conditions become more stressful 477
during the growing season (Cochard and Tyree, 1990). During spring droughts, the oak’s 478
newly formed vessels are exposed to the risk of cavitation leading to water deficit and 479
reduced cell enlargement. Water stress during spring is thus the most important factor 480
controlling radial growth for oak (Tardif and Conciatori, 2006). This phenomenon constrains 481
ring width despite the potential activation of drought avoidance mechanisms (Eilmann et al., 482
2009). In contrast, summer drought would be of less consequence on oak radial growth as the 483
radial increment would have mainly occurred during the months preceding the drought.
484
However, a summer drought still reduces photosynthesic activity for oak through stomatal 485
closure, which prevents further accumulation of reserves for the following year’s growth 486
(Chaves et al., 2003). For Scots pine, on the other hand, needles only appear during the 487
summer and the tree has achieved a mere fourth of its annual radial increment by the time 488
needles reach full expansion (Zweifel et al., 2006). This species’ radial growth dynamics, 489
which have been extensively studied in Europe, show a stronger dependency on conditions at 490
the end of spring and during the summer months (Weber et al., 2007; Eilmann et al., 2009;
491