HAL Id: hal-01243223
https://hal.archives-ouvertes.fr/hal-01243223
Submitted on 14 Dec 2015
HAL is a multi-disciplinary open access archive for the deposit and dissemination of sci- entific research documents, whether they are pub- lished or not. The documents may come from teaching and research institutions in France or abroad, or from public or private research centers.
L’archive ouverte pluridisciplinaire HAL, est destinée au dépôt et à la diffusion de documents scientifiques de niveau recherche, publiés ou non, émanant des établissements d’enseignement et de recherche français ou étrangers, des laboratoires publics ou privés.
Low Energy and low fluence helium implantations in tungsten: Molecular dynamics simulations and
experiments
Lucile Pentecoste, Pascal Brault, Anne-Lise Thomann, Pierre Desgardin, Thomas Lecas, Tayeb Belhabib, Marie-France Barthe, Thierry Sauvage
To cite this version:
Lucile Pentecoste, Pascal Brault, Anne-Lise Thomann, Pierre Desgardin, Thomas Lecas, et al.. Low Energy and low fluence helium implantations in tungsten: Molecular dynamics simulations and exper- iments. Journal of Nuclear Materials, Elsevier, 2016, 470, pp.44-54. �10.1016/j.jnucmat.2015.12.017�.
�hal-01243223�
Low Energy and low fluence helium implantations in tungsten:
Molecular dynamics simulations and experiments
Authors : L. Pentecoste1, P. Brault1,*, A.-L. Thomann1,*, P. Desgardin2, T. Lecas1, T.
Belhabib2, M.-F. Barthe2, T. Sauvage2
1 GREMI, UMR7344 CNRS Université d’Orléans BP6744, 45067 Orléans Cedex 2, France
2 CEMHTI, UPR3079 CNRS, 1D avenue de la Recherche Scientifique, 45071 Orléans Cedex 2, France
Abstract:
300 eV Helium implantation process into tungsten at 300 K has been studied with molecular dynamic simulations (MD). Predicted retention doses were compared to that obtained from experiments performed in equivalent conditions. A saturation phenomenon of the helium retention was evidenced for a number of impinging He atoms and a retention dose similar in both, experiments and simulations. From MD simulations it is learnt that observed Helium diffusion, formation and coalescence of clusters are the phenomena leading to the flaking of the substrate. These processes could explain the saturation of the Helium retention observed experimentally at low energies.
Keywords : Molecular Dynamics, Helium retention, plasma-wall interactions
Corresponding authors: pascal.brault@univ-orleans.fr; anne-lise.thomann@univ-orleans.fr
1. Introduction
Due to its low sputtering yield and high melting point, tungsten is the material chosen to compose the first wall of the divertor of ITER fusion reactor. This part of the chamber will face the most severe conditions of the plasma, such as high fluxes of light particles with a wide range of energies and high heat loads1–3. Studies on plasma material interactions are currently carried out to anticipate the evolution of this metal while exposed to fusion plasma. Several reactors are developed to investigate the interactions of such fusion plasma on W such as Nagdis-I and II in Nagoya or Pisces in San Diego4,5.
Gas implantation, diffusion and retention into metals are well-explored phenomena6,7 Experimental studies have evidenced that He ion fluxes on W substrates lead to various surface morphology changes such as blistering, fuzz formation and even flaking8–11. Those features appearance is strongly dependent on the flux and incident energy of the ions; it also depends on the substrate temperature during the implantation process. At high energies, keV to MeV, mean penetration depths are high (100 nm to microns) and defects induced by elastic and inelastic collisions lead to the formation of damages in the substrates. However at low ion energies (below W displacement thresholds: 90 eV transferred from the impinging ion) the formation of the characteristic damage features is still under investigation.
Experiments performed in Nagdis-II by Nishijima et al8 showed damages as holes appeared for high fluxes (1019 cm-2s-1) and high doses or number of impinging atoms (1023 cm-²) for energies ranging from 5 to 30 eV at high temperature (1300 to 2950 K). It was also reported by Lee et al12 that a limited number of He could remain in the material for energies below W displacement threshold for implantations performed with fluxes ranging from 1014
to 1015 cm-2.s-1 and doses from 1017 to 1019 cm-2. Simulations using molecular dynamics were also performed to study the phenomena involved in the implantation process at low energies. Henriksson et al. studied the behaviour of helium with doses below 1014 cm-2 and with energies varying from 50 to 200 eV at 0 and 300 K13. Li et al. investigated implantations of 1015 cm-2 impinging helium ions on W at 200 eV at temperatures from 300 to 1500 K14,15. Both observed formation of growing and exploding clusters which liberate their He content to the surface. In the case of slightly higher energies (300 eV to 1 keV), the mean penetration of the He is observed to be deeper and no “cluster rupture” was identified due to
simulations stopped too early in the course of He interactions15.
In the present article, the objective is to describe the phenomena observed during the simulation of implantation process carried out at doses ranging from 1014 to 1017 cm-2 and with a kinetic energy of 300 eV at a temperature of 300 K. the simulations were performed by molecular dynamics and SRIM16 calculations. MD simulations initial conditions are chosen to closely fit with experiments. The aim is to explain the saturation of the retained He atom number which does not occur because of the “cluster ruptures” but is however evidenced for implantation experiments performed at energies below W displacement threshold.
Then after a review of the details of the simulation and experimental methods, the MD simulation and experimental results are discussed and compared.
2. Model and Experiments
2.1. Model, Calculations: starting parameters and data treatment
To investigate the phenomena occurring during the implantation of Helium into the tungsten, molecular dynamic simulations are carried out on an Alineos quadriprocessor 8 cores high performance computer using LAMMPS17. Besides, the SRIM code, which is widely referred to in ion/material interaction studies, is used in addition to compare the statistics of the resulting implanted atom concentration and depth profiles.
A (100) body-centred cubic tungsten crystal box consisting of 17 x 17 x 204 unit cells is built, for which dimensions are then 53.8 x 53.8 x 645.7 Å. Periodic boundaries conditions are set in the x [100] and y [010] directions, and free motion is allowed along z [001]. The temperature of the substrate is set to 300 K, thus matching the room temperature experiments. The bottom of the box is composed of a fixed layer of 6 unit cells (20.5 Å) which mimics the unperturbed bulk. The rest of the W atoms are maintained at the temperature 300 K by the mean of a Berendsen thermostat18. The thermostat is used because the fluxes of impinging atoms used in MD simulations are unphysically high as compared to the experiments in order to reduce the large calculation times and properly accounting He interactions with W and already He present in W. Then over a set time, velocities of the W atoms are re-evaluated and brought back to values matching the initially set global temperature of the substrate. The substrate atom W current velocities are
modified using the multiplicative coefficient :
2 1
1
1
k s
T T dt
.
Where dt is the integration timestep (here 0.1 fs), Ts is the targeted temperature, Tk is the current temperature and is the time needed for reaching the targeted temperature Ts.
This thermostat allows proper energy relaxation of the substrate for mimicking energy dissipation in the experiment on a reasonable time scale: it is set here to 1 ps, a value consistent with a model of electron-phonon coupling19,20 that allows estimation of the relaxation time by the formula:
Z k Lne T
m
B e
D
F e
2
2
ΘD is the surface Debye temperature, Ts the substrate temperature, L the Lorentz number, n the electron density, e the electron charge, kB the Boltzmann constant, Z the valence, me the electron mass, κ the thermal conductivity, εF the Fermi energy and Tk is the kinetic temperature. For W, = 1 ps and is used as the relaxation time of the Berendsen thermostat.
Substrate thickness is chosen in order to limit to 0.5% the implanted He atoms crossing the substrate through the fixed W atoms layer. This allows observing all the implanted He atoms, their localization and surrounding, considering the channelled atoms as well. Also, the high number of thermostated W atoms combined with the energy dissipation handled by the thermostat helps keeping the desired temperature of the substrate at 300 K such as in the experiments. Moreover the thickness is chosen in order to keep unperturbed
thermostated layers at the substrate bottom and so observe a smooth transition toward the fixed bottom layers. Thus none of the perturbations of the W lattice are missing.
Helium ions are treated as atoms, as they are neutralized at the W surface, so classical MD simulations are then applicable. He atoms are injected one by one and in a direction normal to the surface from a randomly chosen position above the box. This allows avoiding any interaction before reaching the substrate’s surface. The frequency of the helium atom injection is set between 2.5 and 5 at.ps-1. Such impingement frequency allows no lateral interaction between induced perturbations in the W crystal during the dissipation time, due
to the large enough substrate width. The kinetic energy of the impinging He is set to be 300 eV. The lattice displacement threshold for a W atom is of 90 eV, and the maximum energy transferred from a He atom to a W atom is 25 eV when the He collides with an energy of 300 eV. This value is obtained from the elastic collision energy transfer formula: Etr =
Ei*4m1m2/(m1+m2)². The number of helium atoms impinging the W surface ranges from 2000 to 10000 for a surface of 53.8x53.8 Å2. It corresponds to the experiment doses ranging from 1014 to 1017 cm-2.
Handling molecular dynamics only requires the knowledge of inter-atomic potentials and a set of initial conditions. We use the Juslin and Wirth potentials21: W-W interactions are described by a modified Ackland-Therford potential and W-He interactions are modelled from DFT study. Finally, He-He interactions in the substrate are described by Beck’s potential22, which would allow He cluster growth.
Analysis of He retention rate, of snapshots during implantation simulations and of implanted He atom depth profiles will give insights into the interaction dynamics of the He with W.
SRIM calculations are also carried out for determining retention rates and depth profiles using SRIM 2013 with 2008 stopping power parameters16,23. SRIM software uses Binary Collision Approximation and is commonly used in simulating implantation processes. It considers an amorphous substrate with a density matching the W structure (19.3 g cm-3) and ignores either the interaction between He atoms or effect of the accumulation in the
substrate. Moreover SRIM calculations do not account for recombination of interstitials with the vacancies, nor for defect clustering and irradiation-induced amorphization. Thus
comparison with MD simulations, where these effects are considered, would allow to highlight their role on the retention of He in W.
2.2. Experiments
Polycrystalline tungsten samples are 7x7x0.3 mm pieces of 99.95% purity. The samples were mechanically polished using diamond pastes with grain size ranging from 6 down to 0.1 µm. They were then annealed under high vacuum (10-7 to 10-6 mbar) and at high
temperature (1600 °C) for one hour. This annealing removes the polishing induced defects and reveals the polycrystalline structure of the substrates in the near surface region as observed in the figure 1. The most important feature is the large grain size minimizing grain boundaries size obtained after annealing.
Figure 1: SEM images of the polished W samples surfaces magnified 5000 times (a)prior and (b) after 1600°C annealing.
A dedicated Radio-Frequency Inductively Coupled Plasma source was developed at the GREMI to perform 3He implantations. The plasma source is composed of a quartz tube surrounded by a copper coil in which flows the RF current lighting up the plasma and is connected to a diffusion chamber in which is located the -300 V biased substrate holder. He plasma lights on at a pressure of 10-3 mbar and expands towards the diffusion chamber. The substrates are exposed to He ions with a kinetic energy of 300±20 eV with fluxes ranging
a) b)
10 µm 10 µm
from 1011 to 1014 cm-².s-1. Implantations are performed at 300 K for various durations to obtain a range of ion impinging number from 1014 cm-2 to 1017 cm-2. The 3He isotope was chosen instead of 4He because it can be quantified using the Nuclear Reaction Analysis technique (NRA).
The total amount of 3He retained in the samples is measured by NRA in a dedicated apparatus DIADDHEM at the CEMHTI24 laboratory, Orléans.
The nuclear reaction used to quantify the He content is 3He(d,1H)α 25-28. A 900 keV deuterium beam is used to create nuclear reactions with 3He atoms present in the W substrate. The nuclear reaction products are an 4He ( particle) and a 1H (proton) with energies of 2-3 and 15 MeV, respectively. The concentration of retained 3He is determined by counting the emitted protons for a given deuterium beam charge. The total proton number is normalized by the beam charge and compared to the one measured with the same conditions in a standard sample containing 10163He cm-2. The 3He concentration is then determined using a simple proportionality relation.
Even if MD simulations are concerned by 4He, the mass difference between the two isotopes
3He/4He is not expected to induce a variation in the defects formed into the tungsten lattice.
The maximum energy transferred by a 3He atom (19 eV) remains still below the
displacement threshold of a lattice W atom. J. Amano et al29determined experimentally using FIM technique the diffusion coefficients for both isotopes and concluded there was no strong effect of the mass on the enthalpy of migration and only a difference less than 15% in the diffusion coefficient. Thus, we consider that both isotopes have the same effects on W substrate when implanted and that the comparison between MD and NRA results is possible.
3. Results and Discussions
3.1. Retention rate
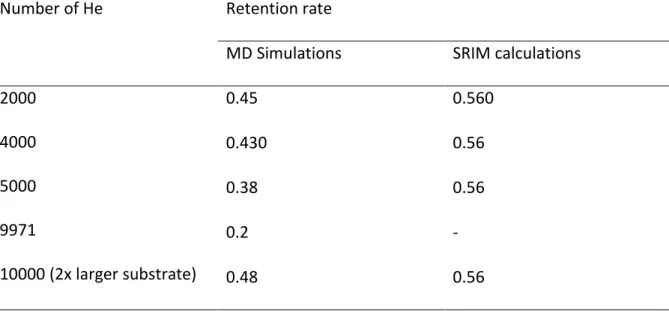
MD simulation shows a decrease of the He retention rate when increasing the He atom number. This is different from SRIM calculations which lead to a constant retention rate (Table1).
Table 1: MD and SRIM results for the retention rates of He ions incident on W normal to the surface.
Number of He Retention rate
MD Simulations SRIM calculations 2000
4000 5000 9971
10000 (2x larger substrate)
0.45 0.560
0.430 0.56
0.38 0.56
0.2 -
0.48 0.56
Beyond the nature of interactions considered in each code, an important difference between MD and SRIM calculations lies in the fact that each SRIM impact is on unperturbed
amorphous material without any dose effect. Conversely, MD simulations consider helium accumulation under the substrate surface. Thus, it appears to be an important parameter impacting the retention rate when increasing the incident He atoms number due to He-He and He-W interactions leading to a modified W lattice. Henriksson et al. 13 reported such a comparison between MD and SRIM. They observed such a large difference, for low energy implantations, which is decreasing when impinging atom energy reached 1 keV. The SRIM code is known as a powerful tool in the case of high energy implantations as it is based on binary collision approximations. However those interactions are less important in the case of
low energy implantations where many body interactions come into play with moving atoms.
The difference found between MD and SRIM highlights the limitation of SRIM code for the low kinetic energies and shows the importance of considering relevant many-body
interactions.
3.2. Implantation process
Snapshots of the MD simulations are presented in figure 2a to 2l. It displays the evolution of the substrate, the formation of He clusters, growing and forming bubbles.
The vertical dotted line gives the initial z=0 position of the W surface. When increasing injection of He atoms, swelling of the surface is observed and thus the outermost W surface is evolving towards higher z values. The bottom of the substrate is truncated at a depth of 150 Å for clarity, but extends to 645 Å for MD simulations.
Figure 2: Snapshots of the implantation process with 9971total impinging He atoms at 300 eV and at 300 K. The W atoms are figured with small dots and He atoms with large balls for clarity. (a) The substrate before any impinging atoms reaches it. (b-e) Helium atoms diffuse and form clusters, the substrate surface moves toward higher z. (f-j) clusters number and size grow with a preferential zone (B) at the mean penetration depth of the Helium atoms. (k-l) Clusters in the intermediate zone (B) coalesce which leads to the rupture of the substrate in two parts: the flaking.
At the beginning of the implantation process, helium atoms slow down at various depths and diffuse in the lattice of the substrate (Figure 2b). Early after the beginning, small He cluster start to form and they do not diffuse anymore when they have a size greater than 6 He atoms, in agreement with previous studies.30,31 They behave as traps for new incoming He atoms (figure 2 a-d). Two typical trajectories are presented in figures 3a and b. In both cases the mobility of the growing clusters is reduced as soon they reach a size of 3 He atoms.
(a) (b)
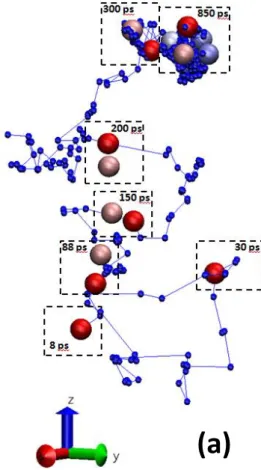
Figure 3: Two different trajectories of He atoms leading to cluster growth in tungsten. Big spheres are He atoms. Small sphere are equal time interval of the trajectories. (a) The He2
cluster is travelling a longer time before growing to He3 cluster compared to (b). In both cases, the mobility of the growing cluster Hen is greatly reduced when n =3. The clusters stop to move for n > 6.
From this step, the clusters are further growing (figure 2 d and e) via coalescence:
different helium clusters are growing up to contact as displayed in figure 4
Figure 4: Coalescence of two He clusters at times (a) 600 ps (b) 720 ps and (c) 800 ps
Big clusters form between 30 and 60 Å depth below the outermost surface and then coalesce to form broad bubbles (figure 2 f to j). Helium concentration in this 30-60 Å slice is continuously increasing. In the meantime, the W lattice is continuously expanding along the z axis. This is mainly due to “loop punching event”:13-15 the W atoms are pushed away as a He bubble is growing. The W atoms are thus moving along (111) planes as “crowdion cascade” towards the surface where they are stacking in crystal positions above the initial surface. This results in increasing the height of the current surface15 as illustrated in figure 5.
(a) (b) (c)
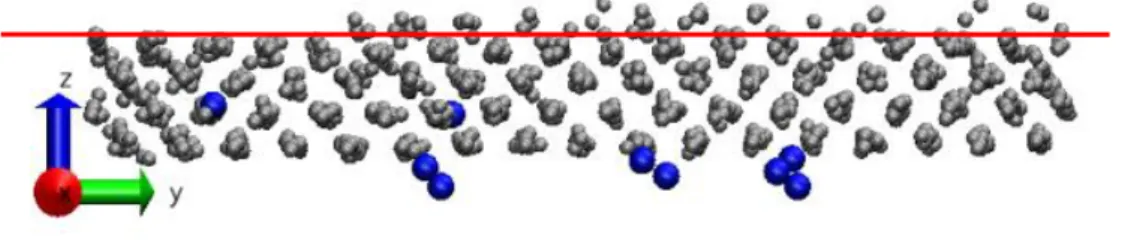
Figure 5: The overall surface is expanded by displaced W atoms, due to bubble growth, above the surface horizontal line give initial z = 0 surface.
After some time, the He bubble becomes large enough to induce W lattice fracture. This looks like the so-called flaking (figures 2 k and l and figure 6).
Figure 6: details of the substrate flaking. (a) He bubbles are ready to coalesce on the width of the substrate (b) the single bubble start to expand (c) the substrate is fractured.
This phenomenon as already been observed experimentally by Gilliam et al.11From this step, the simulation is stopped as the implantation begins on a “refreshed” substrate surface already containing implanted He atoms.
For investigating the processes leading to the rupture of the substrate, we study the evolution of the depth concentration profile.
(a) (b) (c)
3.3. Depth profiles
3.3.1. Final depth profile
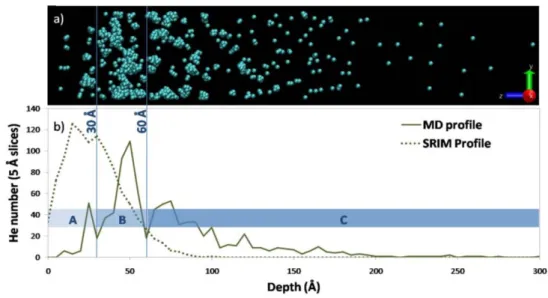
In Figure 7(a) a snapshot of the helium atom positions is presented for 2000 impinging and 901 retained atoms. While in figure 7(b), the helium depth profiles determined both by SRIM and MD simulations are potted.
Figure 7: a) Snapshot of the MD simulated He atoms distribution. The W atoms have been removed for clarity; b) Corresponding plot of the depth distribution comparing MD
simulations (full line) and the SRIM calculations (dotted lines). The area labelled A, B and C define three different implantation zones.
MD simulation calculated He concentration profile exhibit a multimodal distribution defining three main zones of He localization. The three zones are defined as: a near-surface zone (A) from the surface to 30 Å in-depth, an intermediate zone (B) between 30 and 60 -70 Å below the surface, where the highest helium concentration is found, and a third zone (C) from 60 - 70 Å to the bulk of the substrate in which the helium concentration decreases towards the in-depth. From 200 Å depth, the concentration of He becomes negligible. Note that the position of the regions is measured from the outermost surface at the considered implantation time, not from the initial surface in order to take into account the swelling behaviour. The SRIM profile shows a distribution expanding from the outermost W surface
to 90 Å with a maximum at 15 Å, without multimodal structure nor spreading. This is due to the different interactions involved in MD and SRIM.
The shape of the depth profile obtained with MD simulation is displaying a stratification of the He concentration. Such stratified depth profile was observed by Li et al.15 for simulations of 200 eV helium implantation in (001) tungsten at 300 K. They observed a near-surface zone below three or four W layers such as the one we defined as A (fig 7-b) where single helium atoms are located and small clusters formed. They revealed that such small clusters led to changes of the morphology near the substrate surface. However, the biggest clusters formed in their case were located 45 Å below the surface. These clusters can also undergo a
“rupture” which consists in emptying from most of their He atoms content, ejecting them away from the surface. In our case, the highest concentration of helium is located deeper (60 – 70 Å) than for 200 eV impinging atoms, so clusters are unable to explode and eject all or part of their helium content. The clusters accumulate, coalesce and eventually separate the substrate in two parts.
3.3.2. Depth profile evolution
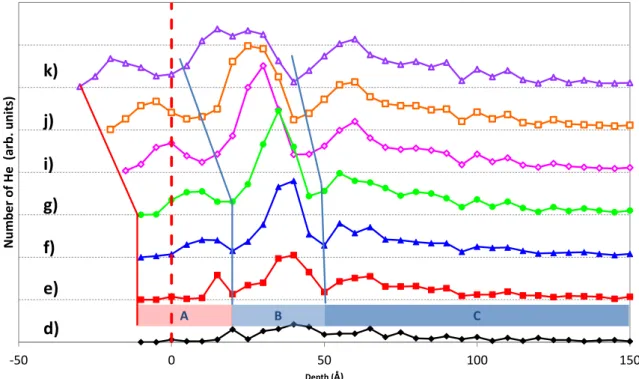
Evolution of the helium depth distribution is plotted in Fig 8 for various number of impinging He atoms.
Figure 8: Depth profile plots as a function of the number of impinging He atoms . The vertical dotted line displays the initial surface at t=0 and the full one corresponds to the actual swelled surface. The separating lines show the evolution of the B and C zones. Each depth profile corresponds to a frame presented in fig 2. Labels on left part of the plot correspond to snapshots of figure 2.
The three zones A, B and C previously defined quickly appear after the beginning of the implantation. As soon as 900 atoms are retained (plot e) we observe the premises of
preferential slowing down sites for the helium between 30 and 60 Å (zone B), broadening to 70 Å when retained He concentration increases. The increase of the retain concentration corresponds to formation, growth and expansion of bubbles ultimately leading to the flaking. This intermediate region (B) where the clusters grow corresponds to the mean penetration depth of the incident ions at this energy. The deeper region (Zone C-from 50 Å to the substrate bottom in frame e) originates from the He atoms which were not trapped by clusters in the previous zones and diffuse in the substrate. The He density decreases with the depth forming a tail in the zone C. The near-surface region (A) corresponds to the helium atoms that quickly lose their energy close the surface and acts as traps for further cluster
-50 0 50 100 150
Number of He (arb. units)
Depth (Å)
k) j) i) g) f) e)
d) A B C
growth. Regions A and C surrounding the bubble (in the B zone) do not seem to evolve much after the maximum of concentration is reached (frame g). In the case of the C region, it is due to the impossibility for the helium atoms to cross the bubble where they are trapped.
On the other hand, a slight increase of the concentration in the A zone is observed and corresponds to balance between incoming He atoms which are rapidly slowing down thus contributing to the formation and growth of small clusters, and those which enter
temporarily and escape from the substrate. These latter are recorded as backscattered ions.
In order to check if the periodic boundaries used in the simulations are not responsible for such behaviour (cluster formation and saturation) in response to the implantation process, the simulation was performed on a two times larger substrate with the same proportional number of impinging helium atoms. The cluster formation and substrate rupture proceeded similarly.
The highest concentration of helium reachable in the W substrate corresponds to the time when the substrate is starting to break. We define this as the saturation level. After the flaking phenomenon, the surface is considered as partially regenerated leading to a new surface already containing some helium atoms that is exposed to the helium flux. Due to calculation time limitations when the saturation occurs, the simulation is stopped and the implantation process is no more considered on the flaked substrate surface.
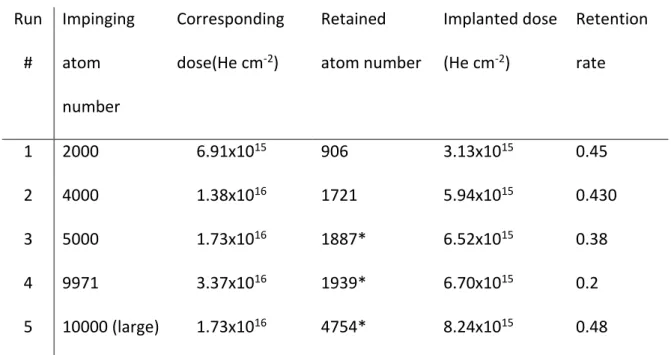
The saturation level is reported in Table 2 which lists the number of retained helium atoms and the corresponding implanted dose as a function of the impinging He atom number. The runs 3 and 4, give similar saturation levels since the saturation phenomenon appears between 4000 and 5000 impinging helium atoms, corresponding to doses of 1.38 and 1.73
1016 He cm-2. The surface is twice larger for the run 5 so the dose is the same as for the run 3, the number of retained atoms is about twice the number for the smaller surface substrate. It means the phenomena are not surface size dependent.
Table 2: Number of injected and retained He atoms for various MD simulation runs Run
#
Impinging atom number
Corresponding dose(He cm-2)
Retained atom number
Implanted dose (He cm-2)
Retention rate
1 2000 6.91x10¹⁵ 906 3.13x10¹⁵ 0.45
2 4000 1.38x10¹⁶ 1721 5.94x10¹⁵ 0.430
3 5000 1.73x10¹⁶ 1887* 6.52x1015 0.38
4 9971 3.37x10¹⁶ 1939* 6.70x1015 0.2
5 10000 (large) 1.73x10¹⁶ 4754* 8.24x1015 0.48 (*) Substrate rupture occurred at this number of retained He atoms.
In order to check the hypothesis of saturation phenomenon, experiments are carried out performing helium implantations in conditions matching the simulations parameters: 300 eV Helium ion implantation at room temperature and number of impinging He atoms below and above the predicted saturation level.
3.4. Helium retention
The helium retention corresponds to the number of atoms which remains in the
substrates after the implantation experiment. Experimentally, this number is measured by NRA. In the case of the simulations, Molecular Dynamics results allow performing statistics on each impinging helium atoms upon its spatial coordinates. The number of atoms with a z
coordinate below the surface of the tungsten substrate is determined and reported to the area of the substrate box. Finally, SRIM software gives directly a number of backscattered ions. The implantation probability is readily deduced from this number.
The measured implanted doses are plotted versus the impinging He atom number in figure 9. Also, are plotted the MD and SRIM simulations results.
Figure 9: Implanted dose (measured or calculated) as function of the number of impinging He atoms per unit area. The empty diamonds are the experimental measurements of the dose obtained by NRA. The full triangles are results from the molecular dynamic simulations.
The full line corresponds to the 100% implantation probability and the dotted line corresponds to the implantation probability obtained by SRIM calculations (Pi=0.56).
Two behaviors are observed depending on the impinging He atoms number. Before saturation, i.e. below impinging 1016 He cm-2, the implanted dose increases linearly.
Experimentally, the implanted dose corresponds to 83% of the number of impinging He atoms calculated from the ion current measured on the substrate holder. This ratio is higher
Implanted Dose (at.cm-2)
Impinging He number (at.cm-2)
NRA Measure MD calculations 100%
SRIM-Pi=0.56
1015
1015 1016 1017
1016
1018
than the calculated values of 56% for SRIM and 45 to 49% predicted by the MD simulations depending on the dose. Such experimental high retention rates were also evidenced experimentally in the literature but at higher energies, thus far from our conditions. E Zenobia et al32 performed implantations with low impinging He atoms number (5x10¹⁶ He cm-2) with a kinetic energy of 30 keV, they observed a retention close to 100%. Meanwhile, Gilliam et al11 considered the retention to be equal to 100% below the “critical dose” at which they observed the formation of blisters during implantations of 1.3 MeV He ions impinging tungsten.
On the other hand, MD simulations are considering the crystallinity of the sample, moving substrate atoms and helium accumulation contrary to SRIM calculations which assume an amorphous substrate with W density but is taking into account electronic effects. So retention values are not expected to be similar. MD implanted dose is even lower than the one calculated by SRIM, due to counting He atoms liberated from bubbles too close from the surface.
A reason which could explain such differences with experiments of the implanted dose for low impinging He atoms number could be the nature of real samples which are
polycrystalline. Various crystal orientations are present promoting or not the channeling and grain boundaries exist where He accumulation is different from the grain “bulk”. It has been recently demonstrated that (111) orientation of W allows deeper He implantation.33 At the same time it is reported that “Helium clustering behavior and bubble formation are largely independent of the surface orientation at depths below about 3 nm”.33 So our (100)
simulations will provide a relevant picture of bubble growth leading to the substrate fracture (fuzz phenomenon). Various experimental and simulation studies presented the effect of the grain boundaries on He retention in W. On the one hand, Sefta et al.34 MD study compared
the helium implantation processes happening either there were or not grain boundaries.
They showed the helium propensity to accumulate in those locations which could explain the difference between the experimental values and the simulated ones. On the other hand, the comparison of various grain size made by Zenobia et al32, mentioned in the previous section, showed the Helium retention in nano-grain sized tungsten was lower than in
polycrystalline W with micrometric grain size, but at considerably higher energies, compared to the present work. They assumed the density of grain boundaries to be responsible for the low retention level. Hu et al carried out large scale MD simulations on a model
polycrystalline W at 933 K.35 They observed that helium segregates towards grain boundaries as well as the outer surface. Thus very different results are reported in the literature
regarding the effect of grain boundaries, but also in different situations. In the present experimental work W, substrates exhibits very large grains with small area of grain
boundaries, thus these boundaries may have a limited impact on the He retention process.
Moreover, He atoms were found to stop migrating as soon as a small cluster of around 7 atoms is formed, at 300 K. At this temperature, they cannot reach the boundaries anymore and the global implantation process can be considered as implantation in a single crystal grains, which is described in the present MD simulations.
Above an impinging He atoms number of 1016 He cm-2, a leveling-off of the implanted dose appears, defining a saturation regime. This trend is observed both experimentally and using MD simulations at an implanted dose slightly above 5.1015 He cm-2. The fact that no
saturation step is predicted by SRIM shows again that this phenomenon is related to the effect of accumulation of He in the W lattice and to the interaction between implanted He atoms. Such saturation is expected when invoking He mobility and the resulting ease to
escape away. This behavior was observed experimentally by Lhuiller et al36, who assumed that the low implanted doses measured by NRA resulted from the high mobility of helium in tungsten lattice. This was also observed earlier at low temperature by Soltan et al37and J.
Amano et al.29
Lee et al.12 claimed the saturation would happen because of the stress fields increasing in the lattice due to the growth of a localized dense array of HenVm complexes preventing the deep penetration of the He ions and promoting the cluster ruptures and the ejection of the He atoms outside the material.
Our MD results attributing saturation to a flaking mechanism do not contradict these hypotheses, but focus on the role of “exploding” (or expanding) bubbles in liberating large amount of He. This can be related to highly strained tungsten lattice. Strain can originate from bubble growth, due to merging clusters which leads to swelling of the W
lattice38,39.When an helium atom implanted dose threshold is reached (depending on incident energy and experiment temperature), the flaking and exfoliation occur10,11. He diffusion and He atom escaping the substrate observed in the near-surface zone (zone A) contributes also to the saturation phenomenon, the way Lhuillier suggested it36. On the other hand, as mentioned before, as soon as helium atoms start forming clusters, their mobility dramatically decreases even close to the surface40,41. This also leads to the bubble growth, expansion and flaking phenomenon when these clusters merge with the deeper ones.
One should be careful in directly comparing experiments and MD simulations: experiments are carried out on polycrystalline W while present MD simulations are considering a perfect single crystal W. Nevertheless, the MD study of Sefta et al.34 mimicking He interactions on model polycrystalline W at 60 eV show that polycrystalline state only affect bubble size
distribution and location for the same implanted dose. Flaking then should not be affected by these features when the bubbles coalesce close to saturation level. Moreover
experiments of Gilliam et al.11 showed that the crystalline state only plays a role for low dose while at higher dose, i.e. close to observed saturation, there is no more difference between single crystal and polycrystalline W substrates.
4. Conclusion
Molecular dynamics and SRIM simulations are carried out to give an insight into helium behaviour during implantation process into tungsten leading to bubble formation.
Experiments are compared to MD simulations, paying attention to the close matching of initial conditions.
MD simulations describe three steps in the helium behaviour:
- He penetrates the substrate and diffuses interstitially, until it encounters another He atom.
- Two He atoms form a cluster which stops diffusing and become a trap site for other incoming He atoms. The stratification observed on the calculated depth profiles is due to the formation of clusters at different depths of the impinging helium atoms and on the way by which the energy is dissipated in the substrate.
- Formed He clusters grow and coalesce beneath W substrate surface until He
concentration becomes high enough to lead to tungsten flaking. On the other hand, we do not observe near-surface “cluster rupture” leading to only He atom ejection towards vacuum
300 eV 3He implantation experiments in polycrystalline W samples corroborate the impinging He atom number and the retention doses at which the saturation phenomenon occurs, which is found around 5.1015 He cm-2. This is also consistent with previous
experimental studies at low energy. However, below a certain impinging He atom number, there is a difference between the retained doses obtained with the two methods, simulation and experiments; this is attributed to the polycrystalline nature of the samples. Further work will allow studying influence of the impinging helium atom kinetic energy and substrate temperature. An interesting point would be to introduce a kinetic energy distribution function more consistent with the experiments and include grain boundaries in the simulation box.
Acknowledgements
Conseil Régional du Centre is gratefully acknowledged for granting “PIMAT” project. We would like to thank C. S. Becquart and J. Boisse for providing us with modified He-W potentials.
References
[1] R. E. Nygren, R. Raffray, D. Whyte, M.A. Urickson, M. Baldwin, L. L. Snead, J. Nucl. Mater. 417 (2011), 451–456.
[2] J. Roth, E. Tsitrone, A. Loarte, T. Loarer, G. Counsell, R. Neu, V. Philipps, S. Brezinsek, M. Lehnen, P.
Coad, C. Grisolia, K. Schmid, K. Krieger, A. Kallenbach, B. Lipschultz, R. Doerner, R. Causey, V. Alimov, W.
Shu, O. Ogorodnikova, A. Kirschner, G. Federici, A. Kukushkin, J. Nucl. Mater. 390-391 (2009), 1–9.
[3] A. W. Kleyn, W. Koppers, N. Lopes Cardozo, Vacuum 80 (2006) 1098–1106.
[4] D. M. Goebel, G. Campbell, R. W. Conn, J. Nucl. Mater. 121 (1984) 277–282.
[5) S. Kajita, N. Ohno, N.; M. Yajima, J. J. Kato, J. Nucl. Mater. 440 (2013) 55–62.
[6] K. Erents, G. Carter, Vacuum 16 (1966), 523–527.
[7] R. S. Barnes, G. B. Redding, A. H. Cottrbll, Philosophical Magazine 3 (1958) 97–99.
[8] D. Nishijima, M. Y. Ye, N. Ohno, N.; S. J. Takamura, J. Nucl. Mater. 329-333 (2004) 1029–1033.
[9] M. J. Baldwin, R. P. Doerner, Nucl. Fusion 48 (2008), 035001.
[10] M. Tokitani, S. Kajita, S. Masuzaki, Y. Hirahata, N. Ohno, T. Tanabe, Nucl. Fusion 51 (2011) 102001.
[11] S. B. Gilliam, S. M. Gidcumb, N. R. Parikh, D. G. Forsythe, B. K. Patnaik, J. D. Hunn, L. L. Snead, G. P.
Lamaze, J. Nucl. Mater. 347 (2005), 289–297.
[12] H. T. Lee, A. A. Haasz, J. W. Davis, R. G. Macaulay-Newcombe, D. G.; Whyte, G. M. Wright, J. Nucl.
Mater. 363-365 (2007) 898–903.
[13] K. O. E. Henriksson, K. Nordlund, J. Keinonen, Nucl. Instruments Methods Phys. Res. B 244 (2006) 377–
391.
[14] M. Li, J. Cui, J. Wang, Q. Hou, J. Nucl. Mater. 433 (2013) 17-22
[15] M. Li, J. Cui, J. Wang, Q. Hou, Nucl. Instruments Methods Phys. Res. B 337 (2014) 45–54.
[16] J. F. Ziegler, M. D. Ziegler, J. P. Biersack, Nucl. Instruments Methods Phys. Res. Sect. B Beam Interact.
with Mater. Atoms 268 (2010) 1818–1823.
[17] S. Plimpton, “Lammps Sandia,” 1995. [Online]. Available at: www.lammps.sandia.gov.
[18] H. J. C. Berendsen, J. P. M. Postma, W. F. van Gunsteren,A. DiNola, J. R. Haak, J. Chem. Phys. 81 (1984) 3684–3690.
[19] D. B. Graves, P. Brault, J. Phys. D. Appl. Phys. 41 (2009) 194011.
[20] Q. Hou, M. Hou, L. Bardotti, B. Prével, P. Mélinon, A. Perez, Phys. Rev. B 62 (2000) 2825–2834.
[21] N. Juslin, B. D. Wirth, J. Nucl. Mater. 432 (2013) 61–66.
[22] D. E. A. Beck, Molecular Physics, 14 (1968) 311–315.
[23] R.E. Stoller, M. B. Toloczko, G. S. Was, A. G. Certain, S. Dwaraknath, F. A. Garner Nucl. Instruments Methods Phys. Res. Sect. B Beam Interact. with Mater. Atoms 310 (2013), 75–80.
[24] T. Sauvage, H. Erramli, S. Guilbert, L. Vincent, M. F. Barthe, P. Desgardin, G. Blondiaux, C. Corbel, J. P.
Piron, F. Labohm, A. Van Veen, J. Nucl. Mater. 327 (2004), 159–164.
[25] Paszti F.,Nucl. Instr. and Meth. in Phys. Res. B 66 (1992) 83-106
[26] B.M.U. Scherzer, R. Behrisch, J. Roth, Nucl. Instr. and Meth. 157 (1978) 75-81 [27] R. Schultz, Behrisch R., B.M.U. Scherzer, Nucl. Instr. and Meth. 168 (1980) 295-299 ; [28] W. Jager, J. Roth, Nucl. Instr. and Meth. 182-183 (1981) 975-983.
[29] J. Amano, D. N. Seidman, J. Appl. Phys. 56 (1984) 983–992.
[30] L. Hu, K. D. Hammond, B. D. Wirth, D. Maroudas, Surf. Sci. 626 (2014) L21.
[31] L. Hu, K. D. Hammond, B. D. Wirth, D. Maroudas, J. Appl. Phys. 118 (2015)163301 [32] S. J. Zenobia, G. L. Kulcinski, Phys. Scr. T138 (2009) 014049.
[33] K D. Hammond, B. D. Wirth, J. Appl. Phys. J. Appl. Phys. 116 (2014) 143301 [34] F. Sefta, K. D. Hammond, N. Juslin, B. D. Wirth, Nucl. Fusion 53 (2013) 073015.
[35] L. Hu, K. D. Hammond, B. D. Wirth, D. Maroudas, J. Appl. Phys. 115 (2014) 173512
[36] P. E. Lhuillier, T. Belhabib, P. Desgardin, B. Courtois, T. Sauvage, M. F. Barthe, A. L. Thomann, P. Brault, Y. Tessier, J. Nucl. Mater. 433 (2013) 305–313.
[37] A. S. Soltan, R. Vassen, P. Jung, J. Appl. Phys. 70 (1991) 793–797.
[38] M. Miyamoto, D. Nishijima, M. J. Baldwin, R. P. Doerner, Y. Ueda, K. Yasunaga, N. Yoshida, K. Ono, J.
Nucl. Mater. 415 (2011) S657–S660.
[39] A. A. Haasz, M. Poon, J. W. Davis, J. Nucl. Mater. 266 (1999) 520–525.
[40] X.-C. Li, X. Shu, P. Tao, Y. Yu, G.-J. Niu, Y. Xu, F. Gao, G.-N. Luo, J. Nucl. Mater. 455 (2014) 544–548.
[41] A. V. Barashev, H. Xu, R. E. Stoller, J. Nucl. Mater. 454 (2014) 421–426.